
Back to Journals » Diabetes, Metabolic Syndrome and Obesity » Volume 18
The Relationships Between Lifestyle Behaviors, Health Perceptions, and Psychosocial Outcomes of Metabolic Syndrome Severity
Authors Daniels BT, Suzuki S, Karavolos K, Drees BM, Lohse B, Bailey-Davis L, Nicklas JM, Masters KS, Powell LH
Received 13 August 2024
Accepted for publication 24 February 2025
Published 14 May 2025 Volume 2025:18 Pages 1575—1585
DOI https://doi.org/10.2147/DMSO.S484850
Checked for plagiarism Yes
Review by Single anonymous peer review
Peer reviewer comments 2
Editor who approved publication: Dr Rebecca Baqiyyah Conway
Bryce T Daniels,1 Sumihiro Suzuki,1 Kelly Karavolos,1 Betty M Drees,2 Barbara Lohse,3 Lisa Bailey-Davis,4 Jacinda M Nicklas,5 Kevin S Masters,6 Lynda H Powell1
1Family and Preventative Medicine, Rush University Medical Center, Chicago, IL, USA; 2Department of Internal Medicine, Biomedical and Health Informatics, University of Missouri-Kansas City School of Medicine, Kansas City, MO, USA; 3Wegmans School of Health and Nutrition, Rochester Institute of Technology, Rochester, NY, USA; 4Department of Population Health Sciences, Geisinger Health System, Danville, PA, USA; 5Department of Medicine, Division of Internal Medicine, University of Colorado Denver | Anschutz Medical Campus, Denver, CO, USA; 6Department of Psychology, University of Colorado Denver | Anschutz Medical Campus, Denver, CO, USA
Correspondence: Bryce T Daniels, Department of Family and Consumer Sciences, University of Arkansas System Division of Agriculture’s Cooperative Extension Service, 2301 S. University Avenue, Little Rock, AR, 72204, USA, Email [email protected]
Purpose: The prevalence of metabolic syndrome (MetS) continues to increase. The severity of MetS can be defined by the number of components or, more recently, a continuous MetS severity score (MetSSS). However, studies that examine lifestyle factors predictive of MetS severity, in general, are lacking. This study aims to compare lifestyle behaviors (eg, physical activity and diet), health perceptions (eg, overall and mental health perceptions), and psychosocial outcomes (eg, perceived stress and social support) among people with a varied number of MetS components and to evaluate associations with MetSSS.
Patients and Methods: This cross-sectional study utilized baseline data from a randomized controlled trial of 618 participants with MetS recruited from 5 different sites across the US We collected data using accelerometers, standard questionnaires, bloodwork, and doing physical measurements. We used a series of separate linear regression models (unadjusted and adjusted) to evaluate differences in lifestyle behaviors, health perceptions, and psychosocial factors between people with 3, 4, and 5 MetS components. We conducted additional linear regression models (unadjusted and adjusted) to assess the association between these same variables and a continuous MetSSS.
Results: Lifestyle behaviors, health perceptions, and psychosocial factors were not different among people with 3, 4, and 5 MetS components. However, in the adjusted models, a lower MetSSS was associated with more average daily steps (β = − 631.69, p < 0.001), healthier overall health perception (β = − 0.14, p = 0.014), more social support for physical activity from friends (β = − 0.89, p = 0.011) and more social support for healthy eating from friends (β = − 0.42, p = 0.015).
Conclusion: The MetSSS was shown to be more sensitive to modifiable lifestyle factors compared to the number of MetS components, indicating the importance of using the MetSSS in lifestyle interventions targeting MetS to achieve MetS remission.
Keywords: metabolic syndrome severity, health, behaviors, metabolic syndrome treatment
Introduction
Approximately 42% of US adults suffer from metabolic syndrome (MetS),1 and its prevalence significantly increased from about 16% to 20% of young adults (aged 20 to 39 years) from 2011–2012 to 2015–2016.2 MetS is diagnosed by the coexistence of ≥3 out of 5 cardiometabolic risk factors (ie, MetS components): high blood pressure; central obesity; elevated triglycerides; elevated fasting glucose, and low high-density lipoprotein (HDL) cholesterol.3 Each risk factor has an established cut-off value (sex-specific for some) that indicates presence of risk.3 A MetS diagnosis is associated with higher risks for cardiovascular disease morbidity and mortality, diabetes, liver and kidney disease, cancer, cognitive decline, and cirrhosis.4,5
A diagnosis of MetS can have varying severity. The most common approach to measuring severity is based upon the number of 5 diagnostic criteria that are met (ranging from 3 to 5 components). A greater number of MetS components (ie, cardiometabolic risk factors) elevates risks for cardiovascular disease,6 diabetes,7 and all-cause mortality.8 Typically, central obesity (high waist circumference) and low HDL are the two most common components of a MetS diagnosis combined with high blood pressure or elevated triglycerides.9 The current binary cut-off (eg, “normal” or “high”) oversimplifies the data and ignores gradations of risk. Individuals just below a cut-off are treated as “normal”, while those just above it are considered “at risk”, even though their actual risk may be equivalent. Further, these cut-offs do not adjust for race, but race may impact the MetS components.10 The cut point of triglycerides at greater than 150 mg/dl may be inappropriate for non-Hispanic Blacks, who, on average, show lower triglyceride levels.11 Therefore, establishing true MetS severity may be more complex than simply counting the number of components that meet diagnostic targets. Recently, to address these issues, metabolic syndrome severity scores (MetSSS) have been created that produce a continuous measure of severity representing the spectrum of MetS and accounts for sex and race.12–14 One rigorously constructed yet practically useful score was introduced by Gurka et al, (2014) who performed a confirmatory factor analysis on National Health and Nutrition Examination Survey (NHANES) (1999–2010), which included data from non-Hispanic-White, non-Hispanic-Black, or Hispanic (Mexican-American/other Hispanic) participants, ranging from 20 to 64 years old. The confirmatory factor analysis findings led to the development of the sex and race/ethnic-specific equations to calculate MetS severity as a continuous variable. However, these scores are not yet widely used in clinical practice nor has the clinical definition of MetS changed from binary cut-offs. The diagnosis of MetS and MetS remission continues to rely upon the number of cardiometabolic risk factors that coexist.
The fundamental root of MetS is widely understood to be a lifestyle characterized by poor dietary quality and physical inactivity.15–18 More recently, chronic stress has been identified as an additional fundamental root with direct and indirect influences on MetS.19 Physical activity can positively affect each component of MetS.20 Improving the quality of foods, modifying macronutrient distribution, and adhering to an energy-restrictive dietary pattern can also positively affect the components of MetS.21 Mindfulness is associated with lower waist circumference but no other clinical components of MetS.22
To our knowledge, no study has evaluated the association between lifestyle factors such as health behaviors, health perceptions, and psychosocial characteristics and the number of MetS components among individuals with MetS. Moreover, only two studies evaluated associations between lifestyle behaviors and MetSSS. One cross-sectional study found that self-reported physical activity and diet quality were significantly associated with lower MetSSS in older adults with MetS.23 A prospective study found anti-inflammatory diets and moderate to vigorous physical activity predicted lower MetSSS over one year in older adults with MetS.24
Identifying relationships between lifestyle factors and MetS severity in terms of number of components and severity score may help in the development of more robust interventions to promote MetS remission. We sought to compare lifestyle behaviors, health perceptions, and psychosocial factors among people with 3, 4, and 5 components of MetS and to evaluate the association between these lifestyle factors and the MetSSS.
Materials and Methods
Study Design
This cross-sectional study utilized the baseline data from a multisite randomized controlled trial of participants with MetS (ClinicalTrials.gov number NCT04036006). Baseline data completion was required before being randomized into the trial. Supplemental information on the methods of the parent trial can be found in the trial’s design and baseline cohort paper.25
Recruitment
Recruitment for the parent trial was conducted in four waves across five separate sites in the United States and completed between June 2019 and February 2022. Participants were eligible for the trial if they met the diagnostic criteria for MetS by having 3 or more MetS components at baseline examination including: high blood pressure (systolic >130 mmHg or diastolic >85 mmHg or anti-hypertensive drug therapy); central obesity (waist circumference >102 cm for males and >88 cm for females); high triglycerides (>150 mg/dL or drug treatment for elevated triglycerides); elevated fasting glucose (>100 mg/dL or drug treatment for elevated glucose), and low HDL cholesterol (<40 mg/dL for males, <50 mg/dL for females, or drug treatment for low HDL cholesterol).3 Participants with safety issues, logistical barriers, and treatments that could confound trial results were excluded. Potential participants were not eligible for the trial if they had a diagnosis of diabetes, heart disease, stroke, moderate or severe depression, history of bariatric surgery, history of an eating disorder within the last five years, mobility limitations, hearing disabilities, or use of a medication impacting appetite or weight.
Measures and Instrumentation
Social Demographic and Health History
Participants completed a questionnaire measuring sociodemographic items, such as race, education level, financial strain (ie, how hard it is to pay for basic needs) and a comprehensive health and psychiatric history.
MetS Severity
MetS Components
The measurement of blood pressure and waist circumference followed NHANES protocols.26 HDL cholesterol, triglycerides, and fasting glucose were measured through a fasted blood sample using Quest Diagnostics. Use of medications was evaluated through self-reported prescription medications and the review of pill bottles.27 Number of MetS components was summed for each participant. Participants were organically separated into groups based on the number of the components met. Specific combinations of MetS components within each group were not evaluated as the diagnosis is based on the number of components met and not specific component combinations.
MetS Severity Score
A continuous metabolic severity score for each participant – based on gender- and race-specific equations – was calculated.12 A higher MetSSS indicates an unhealthier MetS severity.
Lifestyle Behaviors Outcomes
Physical Activity
Moderate and vigorous physical activity minutes/week and the daily average of steps per day over one week were objectively measured using an accelerometer. Participants wore an accelerometer on their right hip for 7 consecutive days for at least 10 hours each day.28
Diet
Frequency of intake of fruit and vegetable servings, only vegetable servings, and sweetened beverages were used as diet outcomes. Participants completed items relating to fruit and vegetable intake and vegetable-only intake (excluding white potatoes, cooked dried beans, and vegetables in mixture such as omelets, casseroles, etc.) from the National Cancer Institute (NCI) All Day Screener.29
Mindfulness
Total mindfulness score from the 39 Likert Item Five-Facet Mindfulness Questionnaire (FFMQ) was used, where higher scores indicate more mindfulness behaviors.30
Health Perception Outcomes
Health Perceptions
Overall health perception and mental health perception to evaluate the health perceptions of participants were used. We recorded a Likert scale item, including answers: “poor”, “fair”, “good”, “very good”, and “excellent” to score 1–5, respectively, with a lower score indicating poorer health. Overall self-rated health was measured using the Short Form Health Survey (SF-36).31 The Mental Health Subscale of the SF-36 was used to evaluate mental health perception where higher scores indicated better perceived mental health.31
Psychosocial Outcomes
Cohen Perceived Stress Scale
We totaled a perceived stress score from 14 Likert scale items ranging from “never”, “almost never”, “sometimes”, “fairly often”, or “very often” and scored 0–4, respectively.32 We reverse-coded items as necessary. Scores could range from 0 to 56, with higher scores indicating higher perceived stress.
Sallis’ Social Support for Diet and Physical Activity
We used family social support for physical activity, friend social support for physical activity, friend social support for healthy eating (encouragement), and family social support for healthy eating (encouragement) as the social support measures of the study. We calculated family and friend social support scores from the 13 Likert items, which scored 1 to 5.33 Higher scores indicated higher social support for physical activity. Friend social support for eating (encouragement) and family social support (encouragement) scores were calculated from 10 Likert items, scored 1 to 5.33 Higher scores indicated higher social support for healthy eating.
Procedures
The Rush University Institutional Review Board was the central review board for all trial sites and approved all study procedures (IRB ORA # 18092408), which were in accordance with the Declaration of Helsinki. Before collecting baseline data, participants provided informed consent to participate in the trial. Baseline data were collected in 3 steps by trained research personnel at each site. First, participants completed self-reported questionnaires (eg, demographics and eligibility questionnaires, SF-36, NCI All Day Screener, and BRFSS). Participants then completed 2 lab visits. The first visit participants received an accelerometer to wear for 7 consecutive days, 10 hours/day and completed food and beverage logs (all intake over 3 weekdays and 1 weekend day). The second in-person visit included a blood draw after a 12-hour fast, physical measurements (eg, height, weight, waist circumference, and blood pressure), and completion of remaining self-reported data (eg, FFQM, social support for diet and physical activity, and perceived stressed).
Data Analysis
We reviewed the data for normality, and outliers. We conducted log transformations for total moderate and vigorous physical activity, total fruit and vegetable servings, and total vegetable only servings due to non-normality issues. We calculated descriptive statistics for all variables used in the analyses. We used SAS 9.434 for the analyses and defined statistical significance at p < 0.05.
We used a series of separate linear regression models, both unadjusted and adjusting for age, sex, race/ethnicity, education, and financial strain, to evaluate differences among participants having 3, 4, and 5 MetS components and total weekly minutes of moderate to vigorous physical activity, average daily step count, fruit and vegetable intake, vegetable only intake, FFQM total score, overall health rating, mental health, perceived stress, family and friends’ social support for physical activity participation, and family and friends’ social support encouragement for healthy eating.
We used a series of separate linear regression models, both unadjusted and adjusted for age, education, and financial strain (MetS severity scores already taken into account for sex and race/ethnicity), to evaluate relationships between health behavior, health perception, and psychosocial outcomes. It was hypothesized that lower MetS severity scores would be associated to healthier behaviors, perceptions, and improved psychosocial outcomes.
Results
Demographics and outcome descriptive statistics for the 3, 4, and 5 component groups can be found in Table 1. Overall, 55% (n = 339) of the participants met 3 MetS components, 33% (n = 202) of the participants met 4 MetS components, and 12% (n = 77) of the participants met 5 MetS components. Each group was predominantly in their mid-50s, white, college-educated, and did not struggle to pay for their basic needs. The sample, on average, was physically inactive (based on the Physical Activity Guidelines for Americans35), met guidelines for fruit and vegetable servings (based on the Dietary Guidelines for Americans36), moderately mindful, with good health perception ratings, perceived moderate amount of stress and social support for physical activity and diet. The number of MetS components had a significant graded relationship with the MetSSS (ie, as number of components increased so did MetSSS). A full summary of the sample’s (N = 618) demographic information can be found in the baseline and design paper.25 Eight participants were excluded from adjusted models because they refused to disclose their level of financial strain.
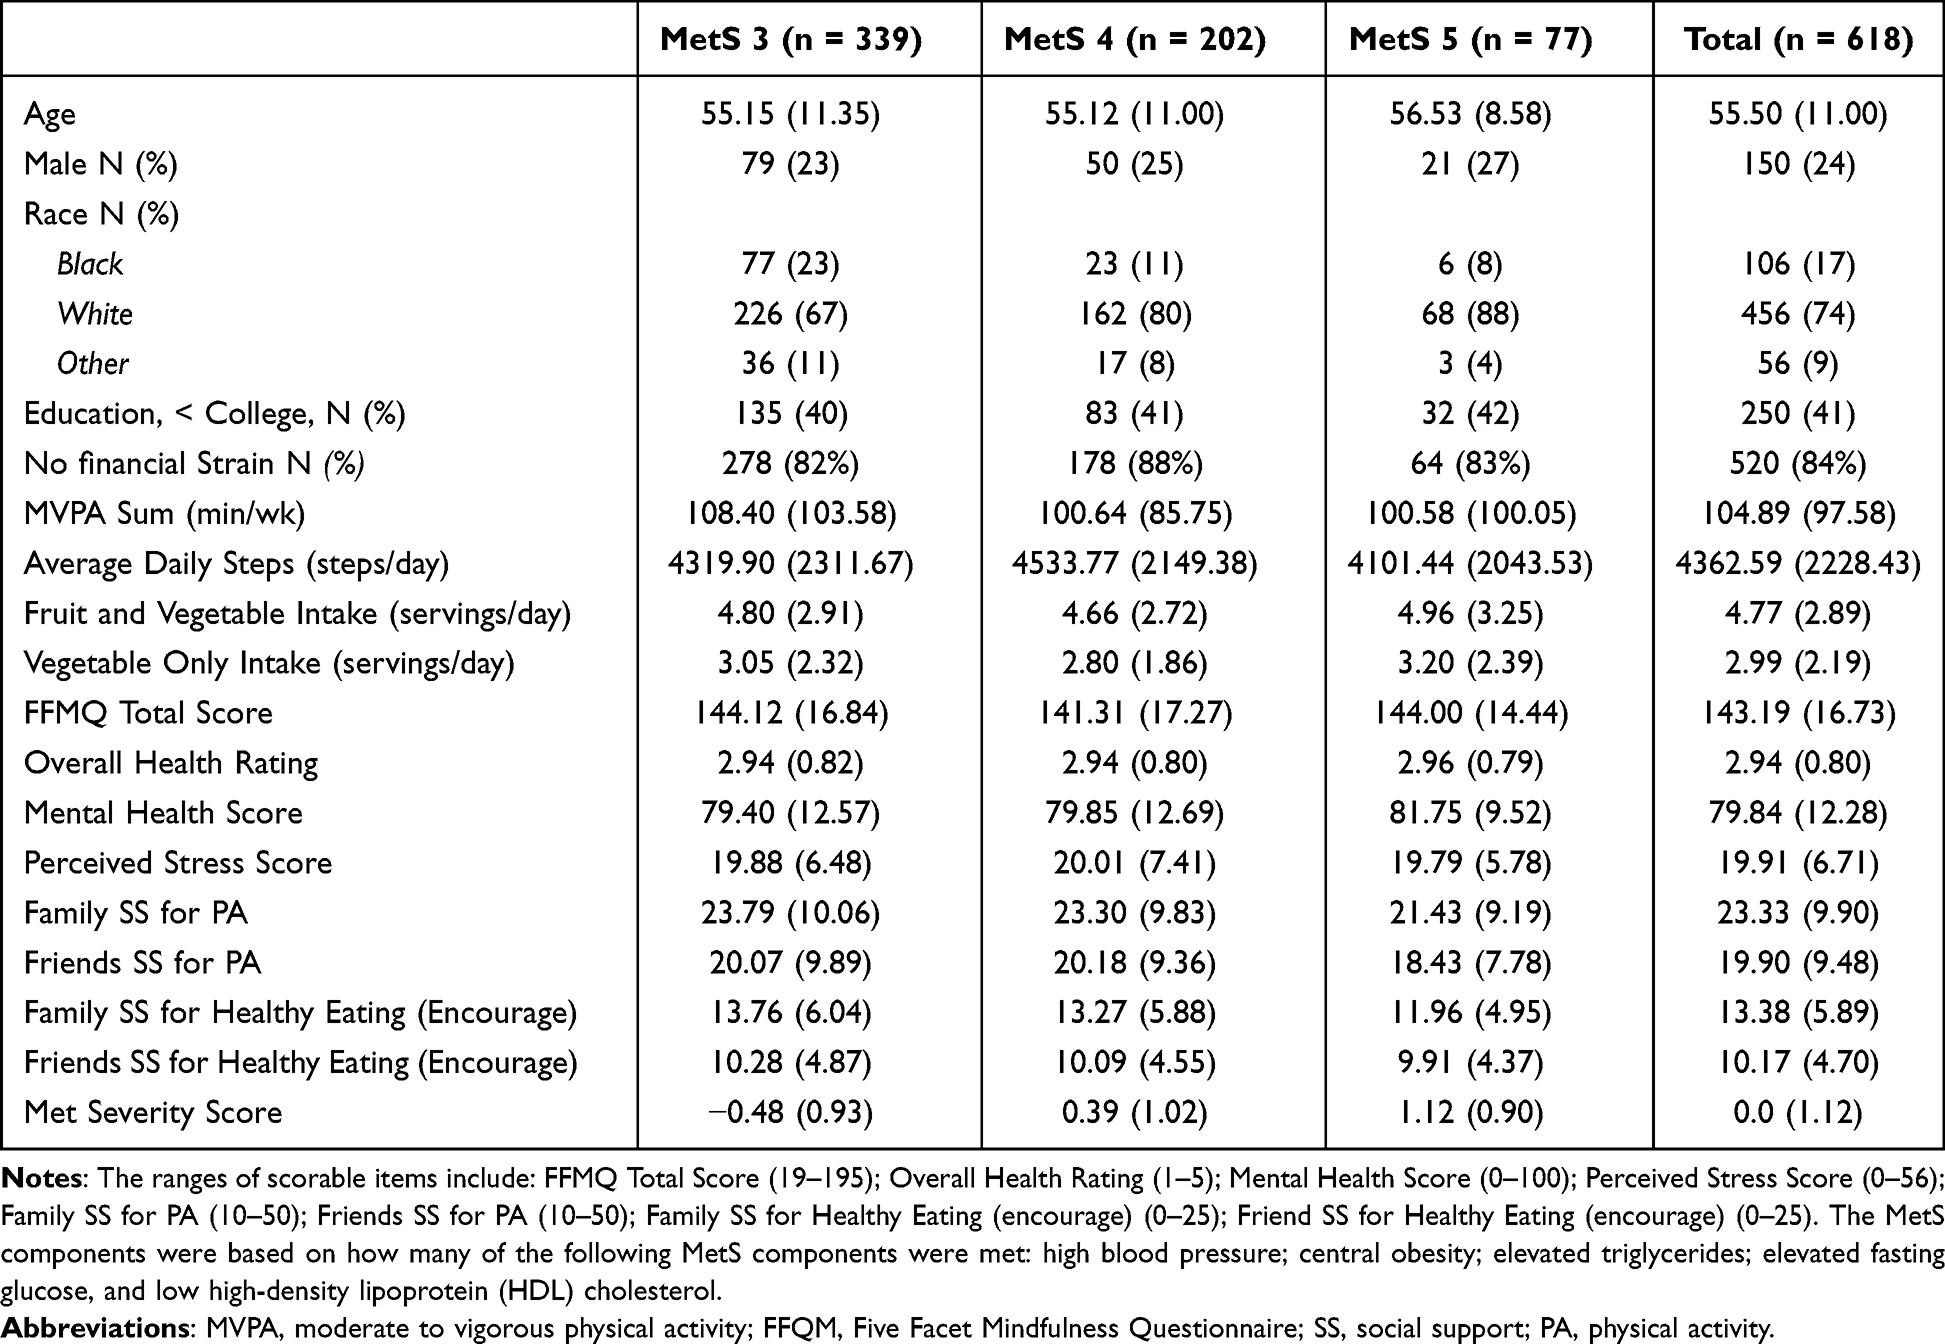 |
Table 1 Baseline Characteristics of Study Sample |
Correlates of Number of MetS Components
The study investigated lifestyle differences by number of MetS components. Table 2 summarizes the results of the unadjusted and adjusted models for each outcome. Overall, differences among the groups for physical activity, diet, and mindfulness were not significant. Table 3 summarizes the results of the unadjusted and adjusted models for those outcomes. Differences among the groups on overall health rating and mental health perception were not significant. Table 4 summarizes the coefficients, standard errors, and p-values for unadjusted and adjusted models for each perceived stress, social support for diet and exercise, and MetS severity scores. In an unadjusted model, people with 3 MetS components reported to be receiving significantly higher family social support for healthy eating (encouragement) (mean = 13.76, p = 0.0307) compared to people with 5 MetS components’ family social support for health eating (encouragement) scores (mean = 11.96, p = 0.0307). However, differences in the adjusted model for people with 3 components’ family social support for health eating (encouragement) (mean = 14.33) compared to people with 5 components’ family social support for health eating (encouragement) (mean = 13.17, p = 0.119) were not significant. No other differences were significant across groups for the psychosocial measures.
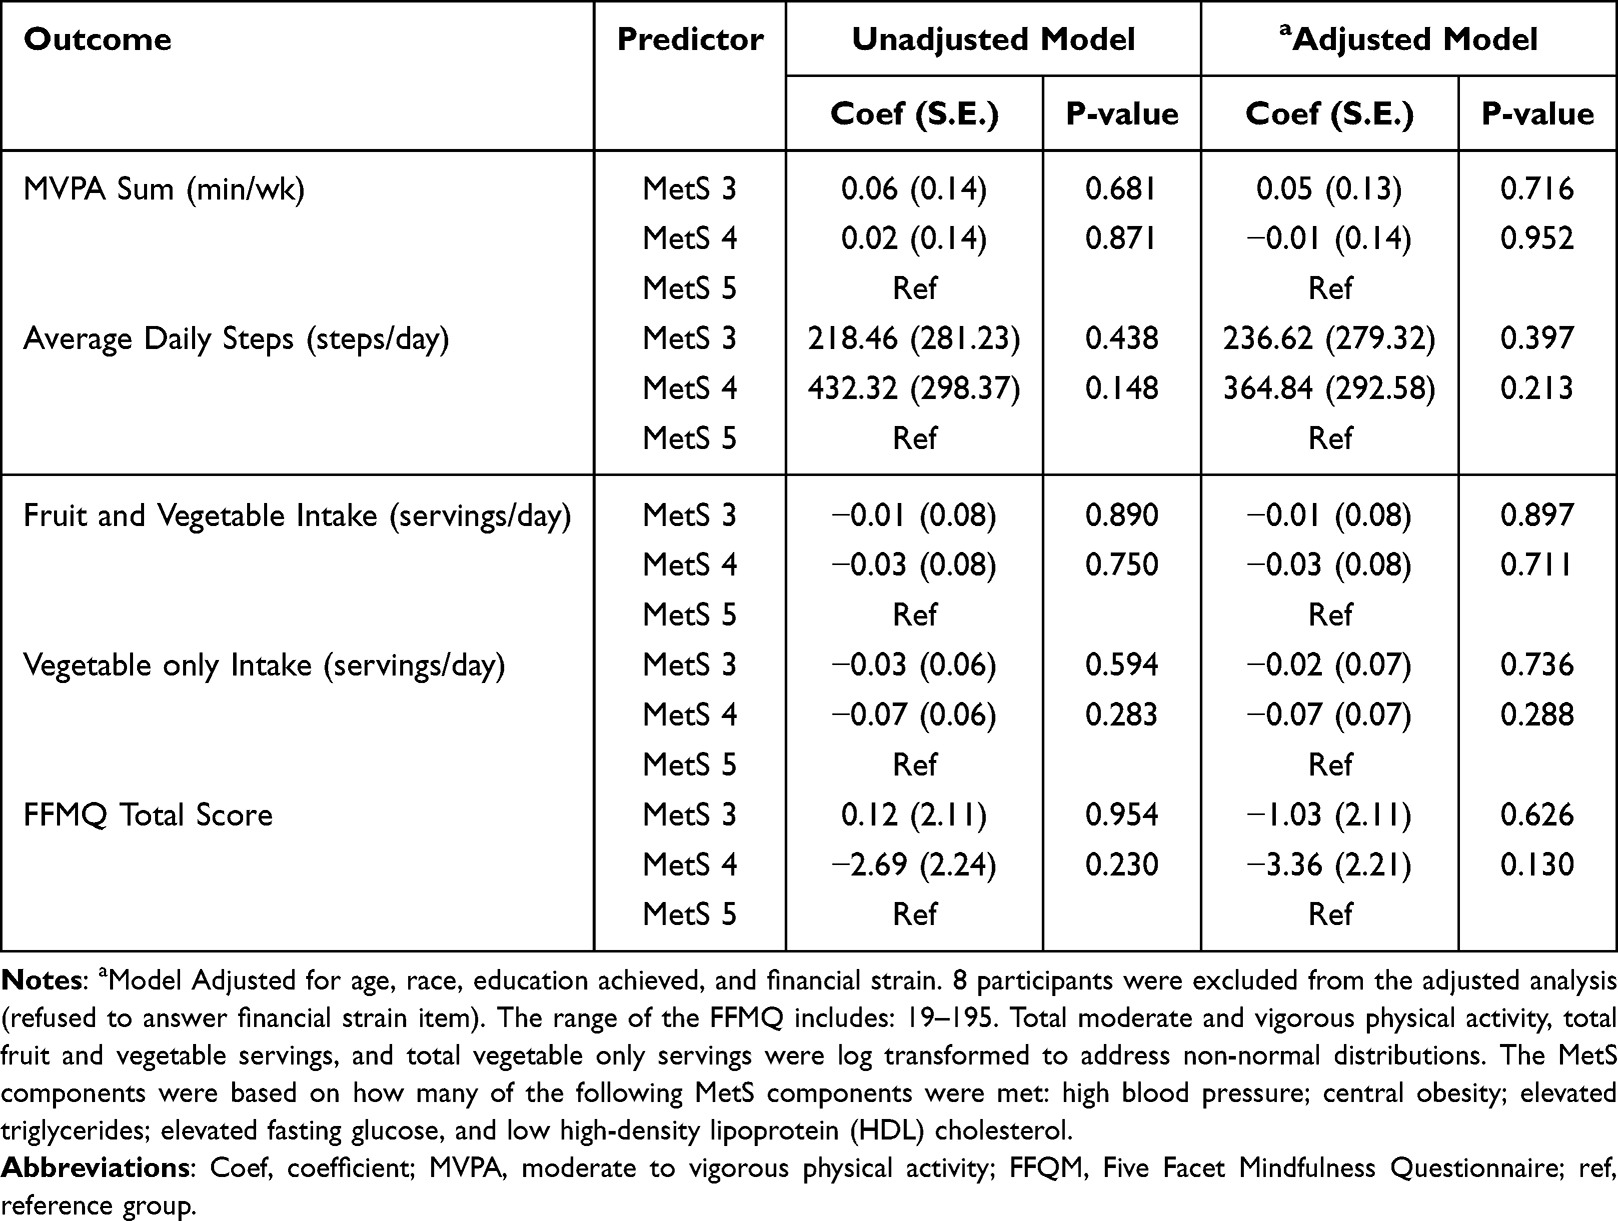 |
Table 2 Unadjusted and Adjusted Models for Health Behaviors and # MetS Components |
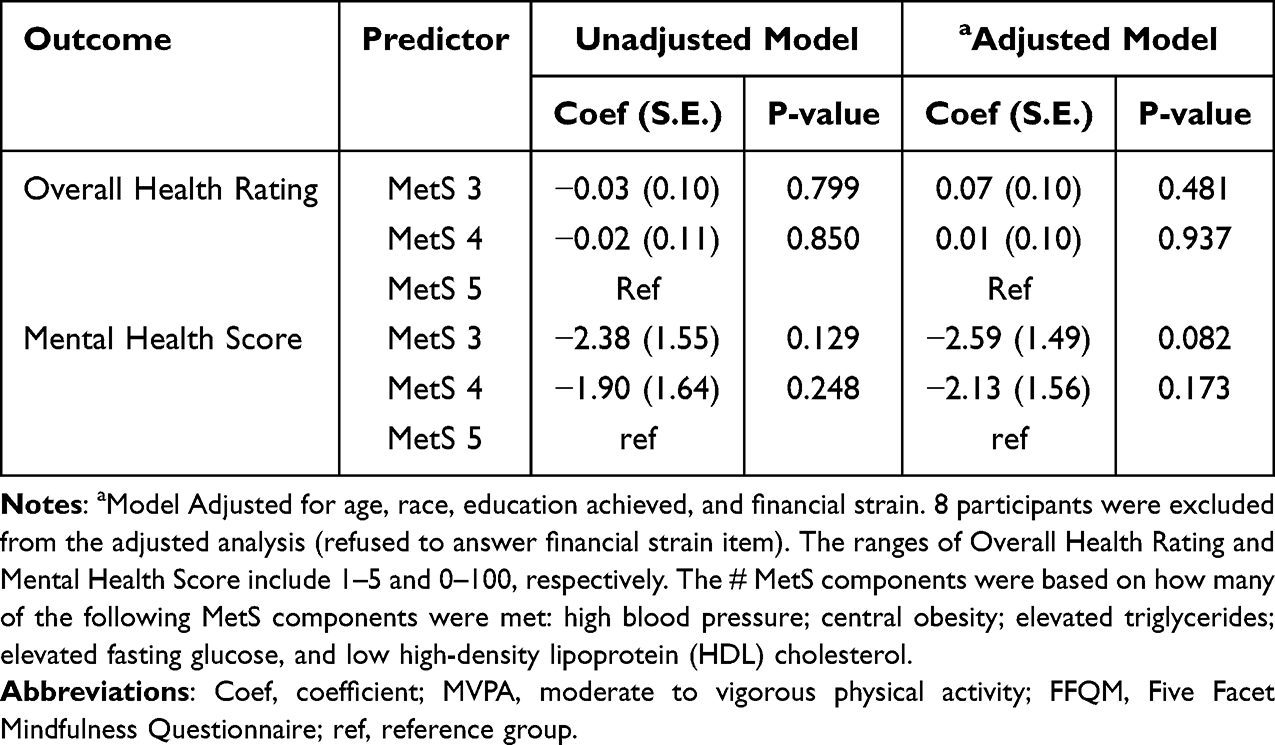 |
Table 3 Unadjusted and Adjusted Models for Health Perceptions and # MetS Components |
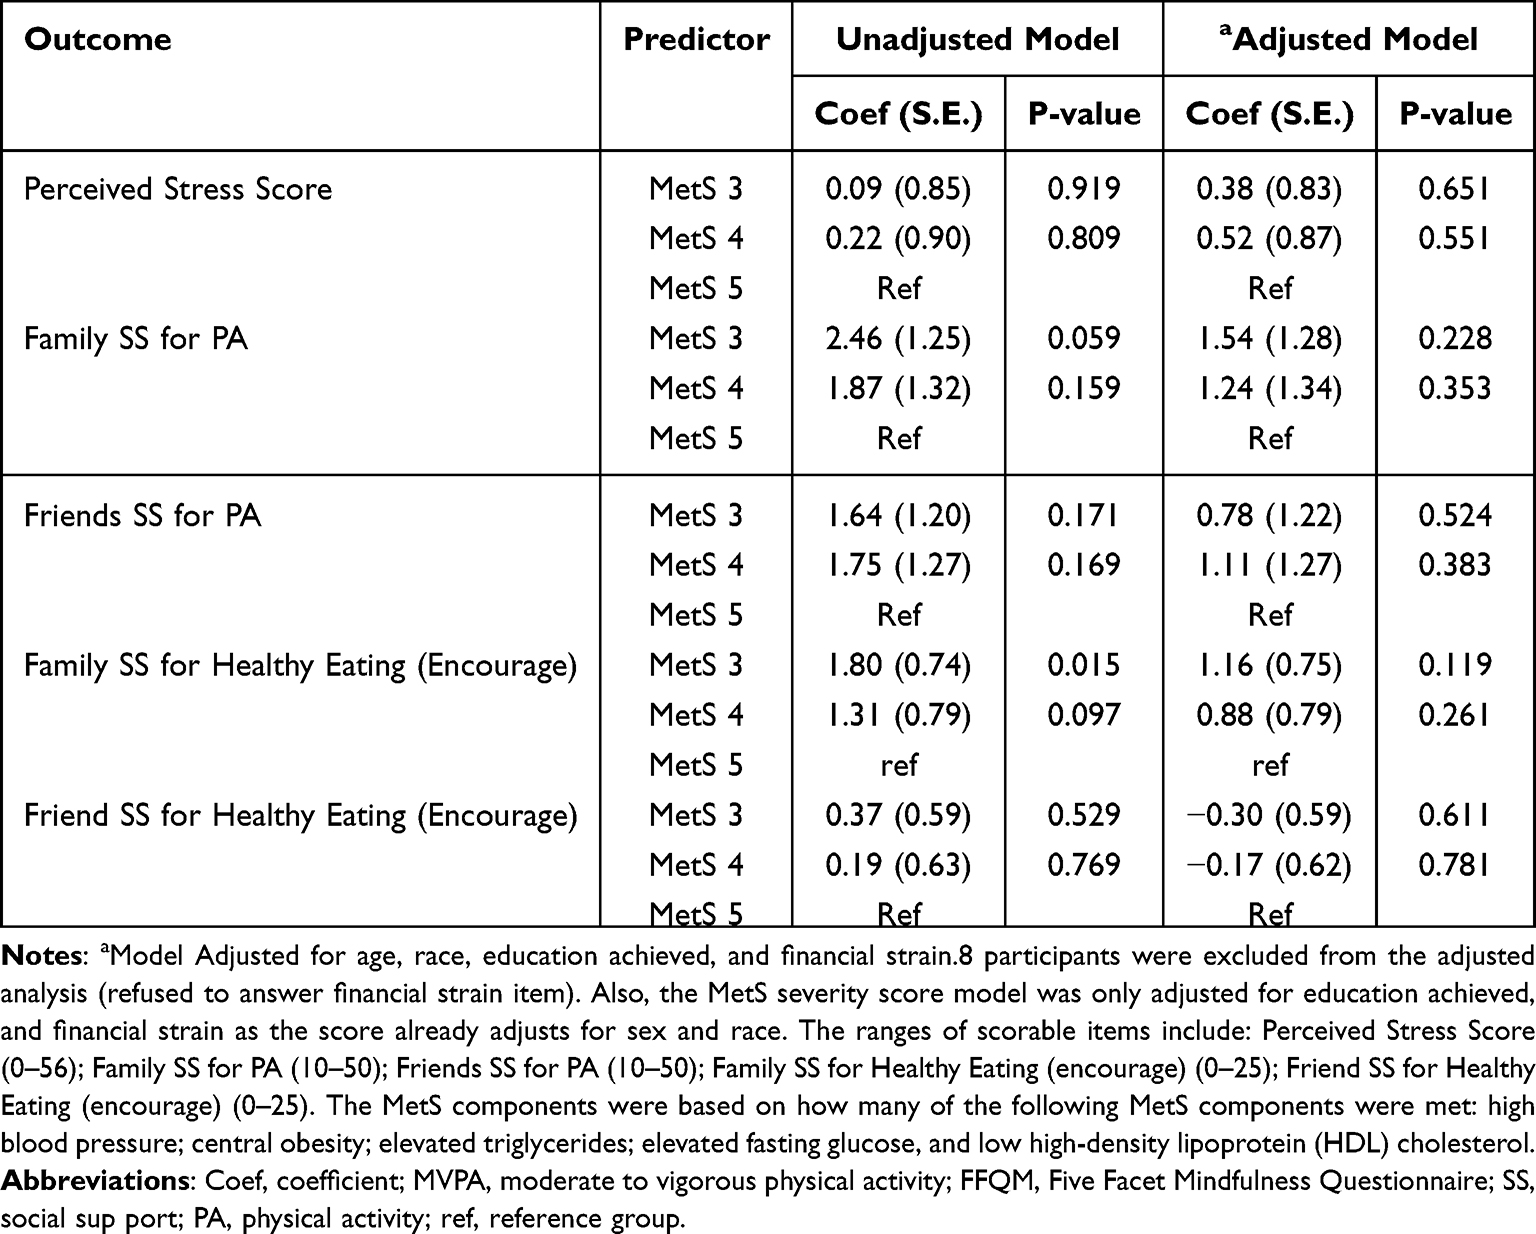 |
Table 4 Unadjusted and Adjusted Models for Psychosocial Outcomes and # MetS Components |
Correlates of MetSSS
We examined associations between the MetSSS and lifestyle outcomes. Table 5 summarizes the unadjusted and adjusted relationships between MetS severity score and all outcomes. Unadjusted MetSSS was significantly and inversely associated with average daily steps (p = 0.002), overall health rating (p = 0.006), friend social support for physical activity (p = 0.007), and friend social support for healthy eating (encouragement) (p = 0.018). After adjusting for education achieved, and financial strain, average daily steps (p < 0.001), overall health rating (p = 0.01), friend social support for physical activity (p = 0.011) and friend social support for healthy eating (encouragement) (p = 0.015) remained significantly associated with MetS severity.
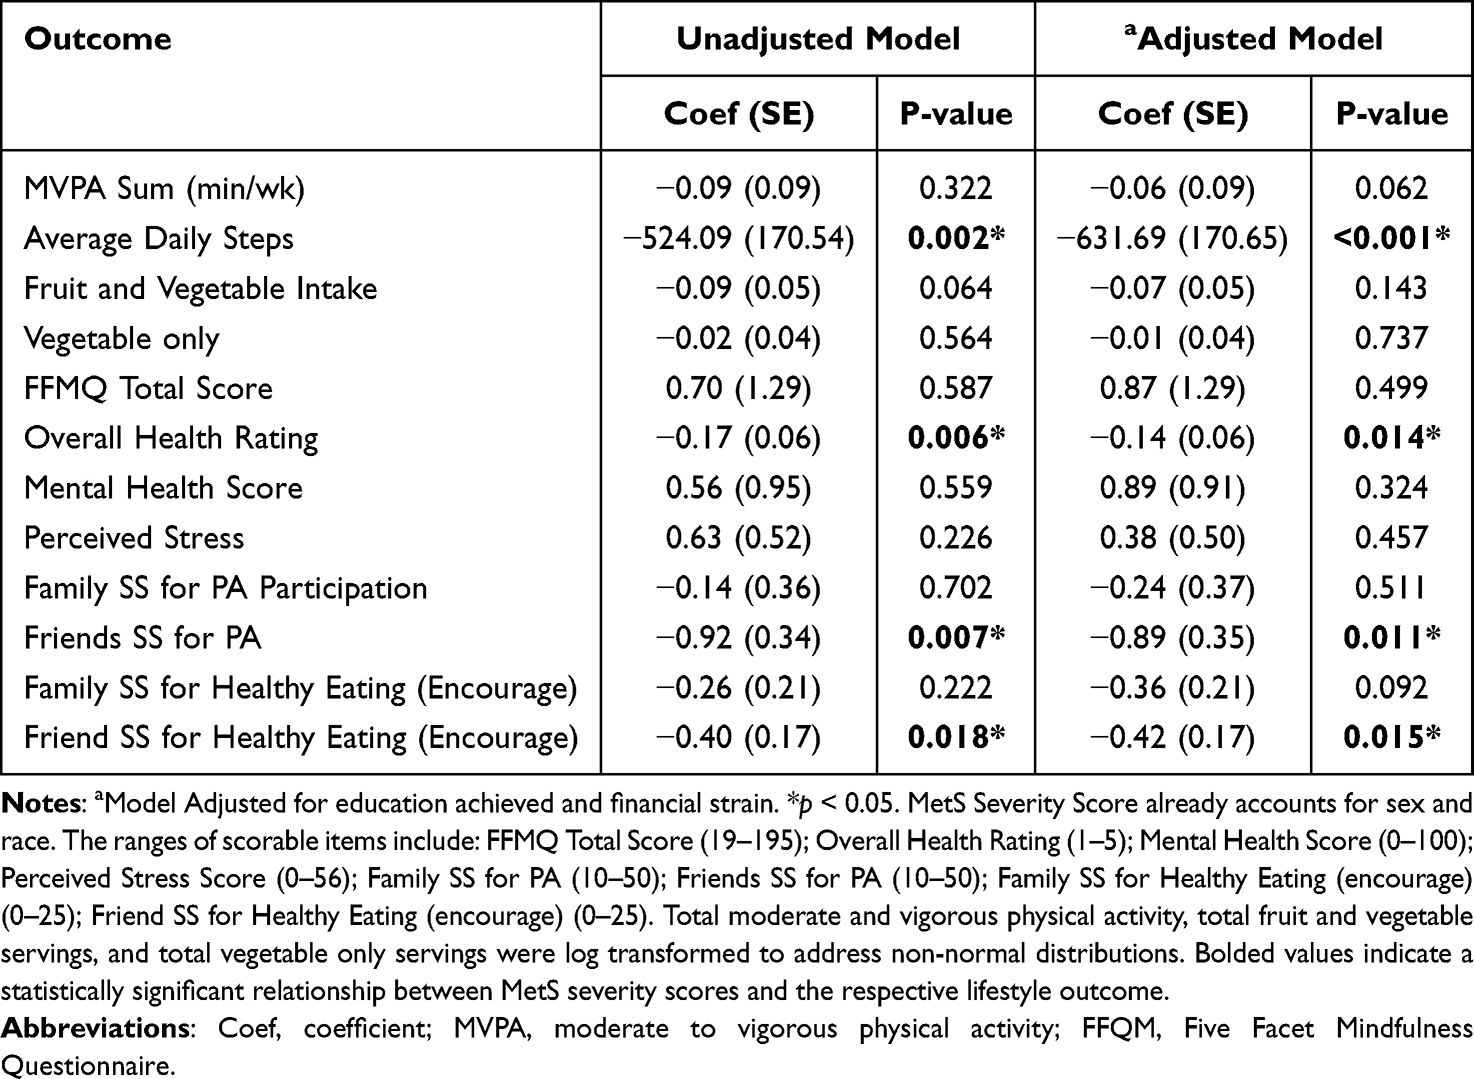 |
Table 5 Unadjusted and Adjusted Models for Lifestyle Factors and MetS Severity |
Discussion
Previous studies have demonstrated that physical inactivity,37 poor dietary habits,21 and stress19 are critical risk factors for developing MetS. Less research has been done on investigating how MetS severity relates to lifestyle after a MetS diagnosis. To our knowledge, no research has investigated the association of current lifestyle behaviors, health perceptions, and psychosocial outcomes with MetS severity. Lifestyle behaviors, health perceptions, and psychosocial outcomes were not related to the number of MetS components. People with 5 MetS components showed similar physical activity, diet, and mindfulness outcomes as people with 3 components. Despite a MetS diagnosis and being at a higher risk for cardiovascular disease6 and diabetes7 and all-cause mortality,8 participants, regardless of number of components, on average, perceived their overall health as “good” and reported good mental health. Psychosocial outcomes were also similar across the number of MetS components. One review paper reported that MetS development is a composite of the interaction between environmental, lifestyle, and genetic factors.38 The homogenous sample of older, college educated, white women demonstrates similar environmental and lifestyle factors. Genetic factors may play a role in developing more MetS components once diagnosed with MetS. Future studies could continue to investigate these relationships with a more diverse sample. Also, scientists could continue to investigate the role genetics plays in the development of more MetS components. Moreover, the number of MetS components as a severity measure shows to be less sensitive to modifiable lifestyle outcomes compared to the MetSSS.
Previous studies have demonstrated associations between MetSSS and physical activity.23,24 Our study used objective measurements of physical activity using accelerometers, compared to self-reported measures in the other studies. We showed average daily steps were significantly related to MetSSS. Average daily steps are less biased than self-reported physical activity measures that often overestimate physical activity performed.39 More studies could continue to investigate the relationship between objectively measured physical activity and MetSSS to confirm these findings and understand these relationships long-term. The current study demonstrated that eating fruits and vegetables was not significantly related to the MetSSS. This finding is similar to a previous cross-sectional study.23 However, a prospective analysis showed, after one year, that decreasing MetS severity scores was associated with a high intake of fruit and vegetables.24 These studies also use a more in-depth food log for looking at dietary variable. Future studies can consider long-term relationships between MetSSS and diet quality factors and investigate if these relationships are causal. Overall, MetSSS scores show to be more sensitive to lifestyle behaviors than the number of MetS components.
As a notable strength of our study, this was the first to investigate the MetSSS relationships with health perceptions and psychosocial outcomes. MetSSS was significantly related to better overall perceived health, higher friend social support for physical activity and higher friend social support for healthy eating (encouragement) in both unadjusted and adjusted models. The MetSSS is related to overall health perceptions, while number of components is not. This finding points to the increased sensitivity of MetSSS to an important health outcome compared the number of components. Also, friends’ social support is more important for performing physical activity and healthy eating for people with a MetS diagnosis. Getting additional support from peers may be critical to reducing MetS severity. For example, a systematic review by Chen et al, (2021) suggested that peer support was associated with weight loss and lower body mass indexes in people who were overweight and obese.40 This is different from research supporting that social support is not related to MetS.41,42 These studies looked at general social support but not social support for specific behaviors. Berthold et al (2021) did use a MetSSS, but the score was developed specifically for Asian populations as their study focused on Cambodian Americans. More research could help understand the relationship between MetS severity score and friend social support for physical activity and healthy eating to further see if the relationship is causal.
Overall, the study’s findings are limited by a cross-sectional design and self-reported measures. The cross-sectional design limits the findings to associations and not causal relationships. Many measures were self-reported measurements prone to different biases.43 However, the study did use objective measures when feasible, including objectively measured physical activity using accelerometers. The limited sample psychosocial demography tempers the generalization of the findings to any sample other than mainly white, college-educated women in their mid-50s who do not struggle to pay for their basic needs, had MetS, and were highly motivated to join a lifestyle intervention. Future studies must continue to clarify these results with a more diverse sample and with equal representation of the number of MetS components. Longitudinal studies are encouraged to better understand the relationships between MetS severity scores and lifestyle behaviors, health perceptions, and psychological factors.
Conclusion
The current study demonstrated that MetS components were not related to modifiable lifestyle correlates. MetSSS is shown to be more sensitive to the impact of physical activity (including average daily steps), dieting, overall health perception, and friend social support for physical activity and healthy eating for individuals. This sensitivity to modifiable health behaviors, health perceptions, and psychosocial outcomes shows the importance of using the MetSSS score in lifestyle interventions to help identify and reduce MetS severity and, ultimately, achieve MetS remission after receiving a MetS diagnosis.
Data Sharing Statement
Access to the data and data dictionary generated through this project may be granted through request to the corresponding author. Data sharing will conform to any restrictions specified by regulatory bodies. A brief request form summarizing the intended use of the data and/or a Data Use Agreement may be required depending on the nature of the data requested. No data that could potentially identify individual research subjects will be shared.
Acknowledgments
The authors acknowledge the time and effort of participants and thank them for being in the study. We also recognize and thank the project coordinators and research assistants at each study site and the faculty and staff of the research coordinating unit at Rush University Medical Center.
Funding
The trial was supported by a grant from the William G. McGowan Charitable Fund (the Fund). Supplementary funding was provided by Rush University Medical Center and the Rochester Institute of Technology. Neither the Fund nor the supplementary funders had any role in design or conduct of the trial, the decision to publish trial results, the analyses of data, or the preparation of this manuscript. Dr Nicklas was funded by a career development award from the National Heart Lung and Blood Institute at the National Institutes of Health (K23HL133604). Dr Nicklas is a coinvestigator on weight-loss studies funded by Eli Lilly and Novo Nordisk, a primary cardiovascular prevention trial funded by Cleerly Inc, and on a metabolic syndrome reversal trial funded by the McGowan Charitable Fund. Dr Lohse received support from the Wegman Family Charitable Foundation, Inc.
Disclosure
Dr Betty Drees reports grants from Abbott Diabetes Care and unrelated clinical trial for Viridian Therapeutics, outside the submitted work. Dr Jacinda Nicklas reports grants from McGowan Charitable Foundation, during the conduct of the study; grants from Eli Lily & Company, Novo Nordisk, and Cleerly, Inc., outside the submitted work. The authors report no other conflicts of interest in this work.
References
1. Liang X, Or B, Tsoi MF, Cheung CL, Cheung BMY. Prevalence of metabolic syndrome in the United States national health and nutrition examination survey 2011–18. Postgrad Med J. 2023;99(1175):985–992. doi:10.1093/postmj/qgad008
2. Hirode G, Wong RJ. Trends in the prevalence of metabolic syndrome in the United States, 2011-2016. JAMA. 2020;323(24):2526–2528. doi:10.1001/jama.2020.4501
3. Alberti KG, Eckel RH, Grundy SM, et al. Harmonizing the Metabolic Syndrome: A Joint Interim Statement of the International Diabetes Federation Task Force on Epidemiology and Prevention. Vol. 120. National Heart, Lung, and Blood Institute; American Heart Association; World Heart Federation; International Atherosclerosis Society; and International Association for the Study of Obesity. Circulation; 2009:1640–1645
4. Denson JL, Gillet AS, Zu Y, et al. Metabolic syndrome and acute respiratory distress syndrome in hospitalized patients with COVID-19. JAMA Network Open. 2021;4(12):e2140568–e2140568. doi:10.1001/jamanetworkopen.2021.40568
5. Yanai H. Metabolic syndrome and COVID-19. Cardiol Res. 2020;11(6):360–365. doi:10.14740/cr1181
6. Guembe MJ, Fernandez-Lazaro CI, Sayon-Orea C, et al. Risk for cardiovascular disease associated with metabolic syndrome and its components: a 13-year prospective study in the RIVANA cohort. Cardiovasc Diabetol. 2020;19(1):195. doi:10.1186/s12933-020-01166-6
7. Lee MK, Han K, Kim MK, et al. Changes in metabolic syndrome and its components and the risk of type 2 diabetes: a nationwide cohort study. Sci Rep. 2020;10(1):2313. doi:10.1038/s41598-020-59203-z
8. Wang Y, Zhang T, Zhang Y, et al. Interrelationships among abnormal P-wave axis, metabolic syndrome and its components, and mortality in U.S. adults. J Electrocardiol. 2024;84:137–144. doi:10.1016/j.jelectrocard.2024.04.004
9. Ogbera AO. Prevalence and gender distribution of the metabolic syndrome. Diabetol Metab Syndr. 2010;2(1):1. doi:10.1186/1758-5996-2-1
10. Walker SE, Gurka MJ, Oliver MN, et al. Racial/ethnic discrepancies in the metabolic syndrome begin in childhood and persist after adjustment for environmental factors. Nutr Metab Cardiovasc Dis. 2012;22(2):141–148. doi:10.1016/j.numecd.2010.05.006
11. Sumner AE. Ethnic differences in triglyceride levels and high-density lipoprotein lead to underdiagnosis of the metabolic syndrome in black children and adults. J Pediatr. 2009;155(3):S7–e7. doi:10.1016/j.jpeds.2009.04.049
12. Gurka MJ, Lilly CL, Oliver MN, et al. An examination of sex and racial/ethnic differences in the metabolic syndrome among adults: a confirmatory factor analysis and a resulting continuous severity score. Metabolism. 2014;63(2):218–225. doi:10.1016/j.metabol.2013.10.006
13. DeBoer MD, Gurka MJ. Clinical utility of metabolic syndrome severity scores: considerations for practitioners. Diabetes Metab Syndr Obes. 2017;Volume 10:65–72. doi:10.2147/DMSO.S101624
14. Honarvar M, Masoumi S, Mehran L, et al. Development and validation of a continuous metabolic syndrome severity score in the Tehran lipid and glucose study. Sci Rep. 2023;13(1):7529. doi:10.1038/s41598-023-33294-w
15. Wang HH, Lee DK, Liu M, Portincasa P, Wang DQH. Novel insights into the pathogenesis and management of the metabolic syndrome. Pediatr Gastroenterol Hepatol Nutr. 2020;23(3):189–230. doi:10.5223/pghn.2020.23.3.189
16. Benjamin EJ, Muntner P, Alonso A, et al. Heart disease and stroke statistics—2019 update: a report from the American Heart Association. Circulation. 2019;139(10):e56–e528. doi:10.1161/CIR.0000000000000659
17. Arnett DK, Blumenthal RS, Albert MA, et al. ACC/AHA guideline on the primary prevention of cardiovascular disease: a report of the American College of Cardiology/American Heart Association Task Force on Clinical Practice Guidelines. Circulation. 2019;140(11):e596–e646. doi:10.1161/CIR.0000000000000678
18. Zhang D, Liu X, Liu Y, et al. Leisure-time physical activity and incident metabolic syndrome: a systematic review and dose-response meta-analysis of cohort studies. Metabolism. 2017;75:36–44. doi:10.1016/j.metabol.2017.08.001
19. Kuo W, Bratzke LC, Oakley LD, et al. The association between psychological stress and metabolic syndrome: a systematic review and meta‐analysis. Obesity Rev. 2019;20(11):1651–1664. doi:10.1111/obr.12915
20. Chomiuk T, Niezgoda N, Mamcarz A, et al. Physical activity in metabolic syndrome. Front Physiol. 2024;15:1365761. doi:10.3389/fphys.2024.1365761
21. Castro-Barquero S, Ruiz-León AM, Sierra-Pérez M, et al. Dietary strategies for metabolic syndrome: a comprehensive review. Nutrients. 2020;12(10):2983. doi:10.3390/nu12102983
22. Guyot E, Baudry J, Hercberg S, et al. Mindfulness is associated with the metabolic syndrome among individuals with a depressive symptomatology. Nutrients. 2018;10(2):232. doi:10.3390/nu10020232
23. Gallardo-Alfaro L, Bibiloni MD, Mascaró CM, et al. Leisure-time physical activity, sedentary behaviour and diet quality are associated with metabolic syndrome severity: the PREDIMED-plus study. Nutrients. 2020;12(4):1013. doi:10.3390/nu12041013
24. Gallardo-Alfaro L, Del Mar Bibiloni M, Bouzas C, et al. Physical activity and metabolic syndrome severity among older adults at cardiovascular risk: 1-year trends. Nutr Metab Cardiovasc Dis. 2021;31(10):2870–2886. doi:10.1016/j.numecd.2021.06.015
25. Powell LH, Daniels BT, Drees BM, et al. Enhancing lifestyles in the metabolic syndrome (ELM) multisite behavioral efficacy trial. Am Heart J. 2024.
26. Centers for Disease Control and Prevention. National health and nutrition examination survey (NHANES): anthropometry manual. 2016 Available from: https://wwwn.cdc.gov/nchs/data/nhanes/2015-2016/manuals/2016_Anthropometry_Procedures_Manual.pdf.
27. Jimmy B, Jose J. Patient medication adherence: measures in daily practice. Oman Med Journal. 2011;26(3):155. doi:10.5001/omj.2011.38
28. Migueles JH, Cadenas-Sanchez C, Ekelund U, et al. Accelerometer data collection and processing criteria to assess physical activity and other outcomes: a systematic review and practical considerations. Sports Med. 2017;47(9):1821–1845. doi:10.1007/s40279-017-0716-0
29. National Cancer Institute. Eating at America’s table study: quick food scan. 2000. Available from: http://riskfactor.cancer.gov/diet/screeners/fruitveg/allday.pdf.
30. Baer RA, Smith GT, Hopkins J, et al. Using self-report assessment methods to explore facets of mindfulness. Assessment. 2006;13(1):27–45. doi:10.1177/1073191105283504
31. Je W Jr, Sherbourne CD. The MOS 36-item short-form health survey (SF-36): I. conceptual framework and item selection. Med Care. 1992;30(6):473–483. doi:10.1097/00005650-199206000-00002
32. Cohen S, Kamarck T, Mermelstein R. A global measure of perceived stress. J Health Soc Behav. 1983;24(4):385–396. doi:10.2307/2136404
33. Sallis JF, Grossman RM, Pinski RB, et al. The development of scales to measure social support for diet and exercise behaviors. Preventive Med. 1987;16(6):825–836. doi:10.1016/0091-7435(87)90022-3
34. SAS Institue Inc. SAS/ACCESS® 9.4 Interface to ADABAS. 2013.
35. Physical Activity Guidelines Advisory Committee. Physical activity guidelines advisory committee scientific report. U.S. Department of Health and Human Services; 2018.
36. U.S. Department of Agriculture and U.S. Department of health and human services. Dietary guidelines for Americans, 2020-2025. 2020. Available from: DietaryGuidelines.gov.
37. Hong S, Lee J, Park J, et al. Association between cardiorespiratory fitness and the prevalence of metabolic syndrome among Korean adults: a cross sectional study. BMC Public Health. 2014;14(1):1–9. doi:10.1186/1471-2458-14-481
38. Fahed G, Aoun L, Bou Zerdan M, et al. Metabolic syndrome: updates on pathophysiology and management in 2021. Int J Mol Sci. 2022;23(2):786. doi:10.3390/ijms23020786
39. Schaller A, Rudolf K, Dejonghe, et al. Influencing factors on the overestimation of self‐reported physical activity: a cross‐sectional analysis of low back pain patients and healthy controls. Biomed Res Int. 2016;2016(1):1497213. doi:10.1155/2016/1497213
40. Chen Y, Li Z, Yang Q, et al. The effect of peer support on individuals with overweight and obesity: a meta-analysis. Iran J Public Health. 2021;50(12):2439. doi:10.18502/ijph.v50i12.7926
41. Esquer E. The associations of chronic stress, social support, health behaviors and metabolic syndrome among Hispanic women. 2021.
42. Berthold SM, Bermudez-Millan A, Buckley T, et al. Social disconnection and metabolic syndrome score among Cambodian Americans with depression. Diabetes Res Clin Pract. 2021;175:108792. doi:10.1016/j.diabres.2021.108792
43. Althubaiti A. Information bias in health research: definition, pitfalls, and adjustment methods. J Multidiscip Health. 2016;211–217. doi:10.2147/JMDH.S104807
 © 2025 The Author(s). This work is published and licensed by Dove Medical Press Limited. The
full terms of this license are available at https://www.dovepress.com/terms
and incorporate the Creative Commons Attribution
- Non Commercial (unported, 4.0) License.
By accessing the work you hereby accept the Terms. Non-commercial uses of the work are permitted
without any further permission from Dove Medical Press Limited, provided the work is properly
attributed. For permission for commercial use of this work, please see paragraphs 4.2 and 5 of our Terms.
© 2025 The Author(s). This work is published and licensed by Dove Medical Press Limited. The
full terms of this license are available at https://www.dovepress.com/terms
and incorporate the Creative Commons Attribution
- Non Commercial (unported, 4.0) License.
By accessing the work you hereby accept the Terms. Non-commercial uses of the work are permitted
without any further permission from Dove Medical Press Limited, provided the work is properly
attributed. For permission for commercial use of this work, please see paragraphs 4.2 and 5 of our Terms.