Back to Journals » International Journal of General Medicine » Volume 15
The Relationships Between Glycated Hemoglobin and Bone Turnover Markers in Patients with Type 2 Diabetes but No Diabetic Nephropathy
Authors Zhao H, Zhang M, Zhen Y ![]() , Tang Y
, Tang Y
Received 16 March 2022
Accepted for publication 26 May 2022
Published 9 June 2022 Volume 2022:15 Pages 5591—5598
DOI https://doi.org/10.2147/IJGM.S366725
Checked for plagiarism Yes
Review by Single anonymous peer review
Peer reviewer comments 2
Editor who approved publication: Dr Scott Fraser
Hang Zhao,1 Miaomiao Zhang,2 Yunfeng Zhen,1 Yong Tang1
1Endocrinology Department, Hebei General Hospital, Shijiazhuang, Hebei, 050051, People’s Republic of China; 2Graduate School of Hebei Medical University, Shijiazhuang, Hebei, 050017, People’s Republic of China
Correspondence: Yong Tang, Endocrinology Department, Hebei General Hospital, 348, Heping West Road, Shijiazhuang, Hebei, 050051, People’s Republic of China, Email [email protected]
Purpose: To investigate the relationships between glycated hemoglobin (HbA1c) level and bone turnover markers (BTMs) in patients with type 2 diabetes mellitus (T2DM) but no diabetic nephropathy.
Patients and Methods: Patients with T2DM were recruited at Hebei General Hospital in China. The participants were allocated to three groups: an HbA1c < 7% group, an HbA1c 7%– 9% group, and an HbA1c ≥ 9% group. Their general characteristics, biochemical indices, and BTM concentrations were recorded.
Results: The ages of the HbA1c < 7% group and the HbA1c 7%– 9% group were significantly higher than that of the HbA1c ≥ 9% group (P< 0.05). The prevalence of a history of hypertension in the HbA1c 7%– 9% group was significantly higher than that in the HbA1c ≥ 9% group. The circulating low-density lipoprotein-cholesterol concentration in the HbA1c ≥ 9% group and the apolipoprotein B concentration in the HbA1c 7%– 9% group were significantly higher than those in the HbA1c < 7% group (P< 0.05). Compared with that in the HbA1c < 7% group, the circulating 25-hydroxyvitamin D (25OHD) concentration was significantly lower in the HbA1c ≥ 9% group (P< 0.05). Additionally, the circulating 25OHD and osteocalcin (OC) concentrations negatively correlated with HbA1c (P< 0.05).
Conclusion: An increase in HbA1c is associated with gradual decreases in the circulating concentrations of 25OHD and OC.
Keywords: type 2 diabetes, glycated hemoglobin, diabetic nephropathy, bone turnover markers
Introduction
Type 2 diabetes mellitus (T2DM) is now a highly prevalent disease and its macrovascular and microvascular complications are widely recognized. In addition, its impact on bone metabolism has recently been attracting attention.1 Fracture associated with diabetic osteoporosis (OP) is an important cause of disability and death.2 Bone turnover biomarkers (BTMs), including of bone formation and bone resorption, reflect changes in bone metabolism earlier than bone mineral density, and are often used to evaluate the progression of OP.3 In addition, kidney disease affects bone metabolism. Several studies have reported relationship between BTMs and diabetes. Two previous meta-analyses showed that both bone formation biomarkers [osteocalcin (OC), total collagen type I amino terminal extension of the peptide (P1NP)] and bone resorption biomarkers [β-collagen degradation products (β-CTX), parathyroid hormone (PTH)] were lower in diabetes patients compared with control subjects.4,5 25-hydroxyvitamin D (25OHD), which is not only as a bone formation biomarker but also a marker of vitamin D status, is closely related to insulin resistance and diabetes. Vitamin deficiency can mediate insulin resistance by destroying pancreatic islet cells, up-regulating epigenetic modifications caused by DNA demethylase genes, and affecting insulin signaling pathways, thereby accelerating the progression of diabetes.6 Clinical studies have shown that vitamin D supplementation can significantly reduce total cholesterol (TC), triglyceride (TG), glycated hemoglobin (HbA1c), and homeostasis model assessment-insulin resistance in patients with T2DM.7,8
In the present study, we aimed to determine the relationships between the level of HbA1c and BTMs in patients with T2DM, but no diabetic nephropathy, thereby excluding the effect of kidney disease.
Patients and Methods
Study Design and Subjects
We performed a cross-sectional study of eligible patients with T2DM who were hospitalized in the Endocrinology Department of Hebei General Hospital between May and December 2019. According to their HbA1c level, the participants were allocated to three groups: an HbA1c <7% group, an HbA1c 7%–9% group, and an HbA1c ≥9% group. The study was registered in ClinicalTrials.gov (Registration Number: ChiCTR2000029391). All of eligible patients signed informed consent forms and we promised we kept the participants’ information confidential. This study protocol was approved by Hebei General Hospital Ethics Committee (ethical approval number: 2020–01) and complied with Declaration of Helsinki.
Inclusion and Exclusion Criteria
Inclusion Criteria
(i) Adults (≥ 18 years).
(ii) Fulfilment of the T2DM diagnostic criteria of the World Health Organization, 1999.
(iii) Absence of diabetic nephropathy, on the basis of two negative 24-hour urine microalbumin (≥ 30 mg/24h) or albumin/creatinine ratio (≥ 30 mg/g) measurements made after admission.
(iv) A complete set of data.
Exclusion Criteria
(i) An acute complication of diabetes mellitus, including ketoacidosis, hyperglycemic hyperosmolar status, and hypoglycemia.
(ii) Acute or severe cardiovascular or cerebrovascular disease, such as acute myocardial infarction, acute cerebral infarction, or cerebral hemorrhage.
(iii) Administration of vitamin D, a bisphosphonate, calcium, estrogen, or other drugs that affect bone metabolism during the preceding 3 months.
(iv) Other types of kidney disease.
Data Collection
For eligible patients, the following data were collected.
(i) General characteristics: sex, age, smoking history, history of alcohol intake, family history of diabetes, presence of gastrointestinal disease, and history of hypertension.
(ii) Biochemical data: circulating total protein, albumin, creatinine, urea nitrogen, TC, TG, low-density lipoprotein-cholesterol (LDL-C), high-density lipoprotein-cholesterol (HDL-C), very low-density lipoprotein-cholesterol (VLDL-C), apolipoprotein A1 (ApoA1), and apolipoprotein B (ApoB) concentrations.
(iii) BTM concentrations: 25OHD, OC, P1NP, β-CTX, and PTH.
Statistical Analysis
SPSS 21.0 software (IBM Inc., Armonk, NY, USA) was used for statistical analysis. Continuous data are expressed as mean ± standard deviation (SD) if they were normally distributed and were analyzed using one-way ANOVA for comparisons between groups. Non-normally distributed data are expressed as the median (25th percentile, 75th percentile (P25, P75)) and a non-parametric test was used for comparisons between groups. For categorical data, the chi-square test was used for comparisons between groups. Correlation analysis was used to explore the relationships between HbA1c and BTM concentrations. P<0.05 was regarded as indicating statistical significance.
Results
General Characteristics of the Participants
A total of 157 patients aged between 20 and 82 years were included. Male and female participants accounted for 65.6% and 34.4%, respectively. Their mean ± SD HbA1c was 8.9%±2.1%. The participants in the HbA1c <7% and HbA1c 7%–9% group were older than those in the HbA1c ≥9% group (P<0.05). In addition, the prevalence of a history of hypertension in the HbA1c 7%–9% group was significantly higher than that in the HbA1c ≥9% group (P<0.05) (Table 1).
 |
Table 1 Comparison of General Characteristics of Different HbA1c Groups |
Comparisons of Biochemical Parameters Among the Groups
Compared with the HbA1c <7% group, the LDL-C concentration in the HbA1c ≥9% group and the ApoB concentration in the HbA1c 7%–9% group were significantly higher (P<0.05). In addition, the total protein concentration of the HbA1c 7%–9% group was higher than that of the HbA1c ≥9% group (P<0.05) (Table 2).
 |
Table 2 Comparison of Biochemical Parameters of Different HbA1c Groups |
Comparisons of BTM Concentrations Among the Groups and Their Relationships with HbA1c
Compared with the HbA1c <7% group, the 25OHD concentration in the HbA1c ≥9% group was lower (P<0.05). However, the concentrations of other bone formation markers (OC and P1NP) and bone resorption markers (β-CTX and PTH) did not differ among the three groups (Table 3). The correlation analyses showed that the concentrations of the bone formation markers 25OHD and OC negatively correlated with HbA1c (P<0.05), which implies that as the level of HbA1c increases, the concentrations of 25OHD and OC gradually decrease (Table 4, Figures 1–5).
 |
Table 3 Comparison of BTM Concentrations of Different HbA1c Groups |
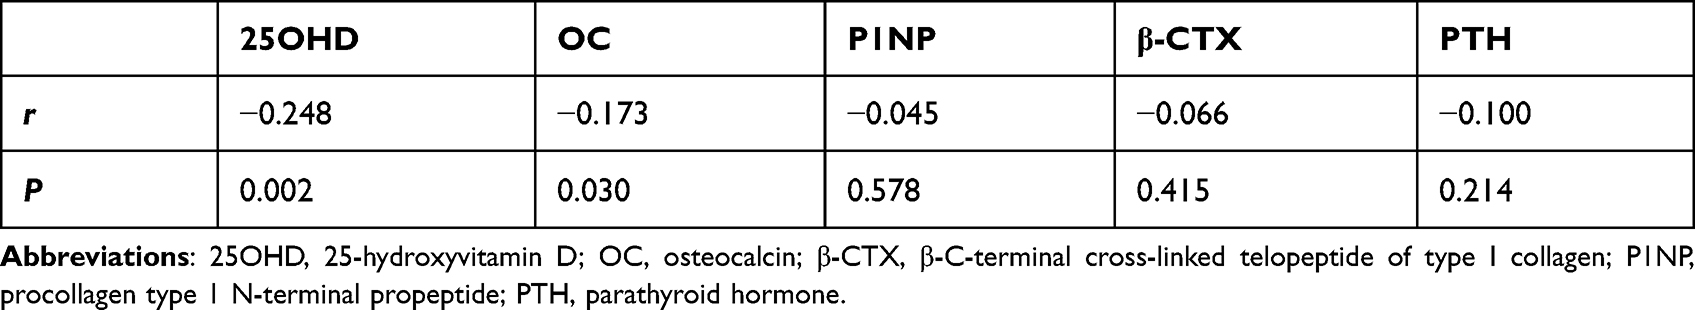 |
Table 4 Correlation Analysis Between HbA1c and Bone Turnover Markers |
 |
Figure 1 Correlation between HbA1c and 25OHD. |
 |
Figure 2 Correlation between HbA1c and OC. |
 |
Figure 3 Correlation between HbA1c and P1NP. |
 |
Figure 4 Correlation between HbA1c and β-CTX. |
 |
Figure 5 Correlation between HbA1c and PTH. Abbreviations: HbA1c, glycated hemoglobin; 25OHD, 25-hydroxyvitamin D; OC, osteocalcin; β-CTX, β-C-terminal cross-linked telopeptide of type I collagen; P1NP, procollagen type 1 N-terminal propeptide; PTH, parathyroid hormone. |
Discussion
OP is a significant risk factor for fracture. In addition, older individuals are predisposed toward complications such as bed rest, pressure sores, falling pneumonia, and lower extremity venous thrombosis, which are significant causes of disability and death and are associated with substantial care and financial burdens for their families and society.9 Bone metabolism and the relationship between abnormal glucose metabolism in diabetes and bone function have recently been attracting a lot of interest. BTMs, which include bone formation markers, such as 25OHD, OC, and P1NP, and bone destruction markers, such as β-CTX and PTH, can predict OP earlier than bone mineral density and provide information regarding bone metabolism.
The kidney also plays an important role in bone metabolism. For example, 25OHD is further hydroxylated in the kidney to generate 1,25-dihydroxyvitamin D, which is the active form of vitamin D.10 Therefore, the presence of kidney disease may affect BTM concentrations. For example, compared with people without kidney disease, patients with chronic kidney disease have a higher prevalence of severe vitamin D deficiency (up to 80%) and impaired glucose tolerance.11,12
A meta-analysis suggested that body mass index and vitamin D level were inversely correlated, in both diabetic and nondiabetic populations.13 It is evident that obesity could lead to metabolic diseases, such as insulin resistance, diabetes and cardiovascular disease.14 Previous studies have explored the relationships between blood glucose control and BTMs, and especially 25OHD. For example, a prospective study of 5000 healthy Danish 30–65-year-old showed that vitamin D deficiency is associated with more severe insulin resistance and the development of hyperglycemia.15 In addition, in the large-scale AusDiab study, there was an inverse relationship between the serum 25OHD concentration and metabolic parameters, such as fasting blood glucose, insulin resistance index, triglyceride concentration, and waist circumference; and the risk of new-onset diabetes increased within 5 years.16 A meta-analysis of 3094 individuals from four studies showed that low serum 25OHD concentration increased the risk of prediabetes. In addition, a meta-analysis of eight randomized controlled studies containing 1580 participants showed that vitamin D supplementation ameliorates the impaired glucose tolerance of patients with prediabetes.17 Senyigit et al18 found that a low 25OHD concentration is associated with the development and complications of diabetes, which suggests that vitamin D status may affect the progression of diabetes. Finally, a study conducted in South Korea that included 1175 patients with T2DM showed that the concentrations of 25OHD and PTH negatively correlate with HbA1c.19 However, these previous studies included participants with both uncomplicated T2DM and others with T2DM complicated by diabetic nephropathy.
In the present study, we included patients with T2DM but no diabetic nephropathy. The results show that in this population, the 25OHD concentration is highest in individuals with HbA1c <7% and that it is a significantly lower in those with an HbA1c ≥9%. Analysis of the relationships between HbA1c and BTMs showed that HbA1c negatively correlates with the bone formation markers 25OHD and OC, which implies that as the level of HbA1c increases, the concentrations of 25OHD and OC gradually decrease. Therefore, patients with lower HbA1c are more likely to be able to form bone effectively. Previous studies conducted on this subject have tended to be cross-sectional studies of the relationship between blood glucose control and 25OHD. In patients with T2DM but no chronic kidney disease, the serum 25OHD concentration and HbA1c are inversely related.20,21 However, in the present study, in addition to studying 25OHD, we also explored the relationships between other BTMs and HbA1c.
In our study, we found that the history of hypertension differed among different HbA1c groups. In fact, hypertension is also related to BTMs. A previous study indicated that low vitamin D status was associated with higher incidence of hypertension and was inversely associated with diastolic blood pressure.22 In patients with OP, hypertension was associated with low levels of OC and 25OHD.23 Furthermore, hypertensive patients had low intestinal calcium absorption and increased urinary calcium excretion, which would stimulate PTH secretion and calcium mobilization.24
The present study had some limitations. First, a healthy control group was not included, so we could not compare the relationships between HbA1c and BTMs between healthy people and patients with T2DM. Second, the participants were all hospitalized and their HbA1c levels were fairly high, which may have introduced some bias into the study. Third, the samples size was small and this was a cross-sectional study; therefore, we cannot draw conclusions regarding causality. Fourth, we did not describe the female estrogen status and fracture history in the study. However, these two factors may be related to the status of bone metabolism, and may in turn have affected the results to a certain extent as confounding factors. Last, the drug use in our patients was not recorded in detail. But at present, hypoglycemic drugs, such as insulin, incretin drugs, and metformin, can affect BTMs by affecting bone formation or bone absorption.25,26
In conclusion, in patients with T2DM but no diabetic nephropathy, HbA1c negatively correlates with the bone formation markers 25OHD and P1NP, which suggests that good blood glucose control may be associated with superior bone formation, and perhaps a lower risk of OP.
Abbreviations
ApoA1, apolipoprotein A1; ApoB, apolipoprotein B; BMI, body mass index; HbA1c, glycated hemoglobin; HDL-C, high-density lipoprotein cholesterol; IR, insulin resistance; LDL-C, low-density lipoprotein cholesterol; T2DM, type 2 diabetes mellitus; TC, total cholesterol; TG, triglyceride; VLDL-C, very low-density lipoprotein cholesterol; OC, osteocalcin; P1NP, procollagen type 1 N-terminal propeptide; PTH, parathyroid hormone; 25OHD, 25-hydroxyvitamin D; CI, confidence interval; β-CTX, β-C-terminal cross-linked telopeptide of type I collagen.
Data Sharing Statement
The data can be obtained by email request ([email protected]).
Ethics Approval
The study was approved by the Ethics Committee of Hebei General Hospital.
Acknowledgments
We thank Mark Cleasby, PhD, from Liwen Bianji (Edanz) (www.liwenbianji.cn/ac) for editing the English text of a draft of this manuscript.
Funding
This study is not being supported by a grant form.
Disclosure
The authors declare no conflicts of interest related to this work.
References
1. Hygum K, Starup-Linde J, Langdahl BL. Diabetes and bone. Osteoporosis Sarcopenia. 2019;5(2):29–37.
2. Fan Y, Wei F, Lang Y, et al. Diabetes mellitus and risk of Hip fractures: a meta-analysis. Osteoporosis Int. 2016;27(1):219–228.
3. Hernández JL, Olmos JM, Romaña G, et al. Bone turnover markers in statin users: a population-based analysis from the Camargo Cohort Study. Maturitas. 2013;75(1):67–73.
4. Starup-Linde J. Vestergaard. P Biochemical bone turnover markers in diabetes mellitus - A systematic review. Bone. 2016;82:69–78.
5. Hygum K, Starup-Linde J, Harsløf T, Vestergaard P, Langdahl B. Diabetes mellitus, a state of low bone turnover - a systematic review and meta-analysis. Eur J Endocrinol. 2017;176(3):R137–R157.
6. Szymczak-Pajor I, Śliwińska A. Analysis of association between Vitamin D deficiency and insulin resistance. Nutrients. 2019;11:4.
7. Tabesh M, Azadbakht L, Faghihimani E, Esmaillzadeh A. Effects of calcium-vitamin D co-supplementation on metabolic profiles in vitamin D insufficient people with type 2 diabetes: a randomised controlled clinical trial. Diabetologia. 2014;57(10):2038–2047.
8. El Hajj C, Chardigny JM, Boirie Y, et al. Effect of vitamin D treatment on glucose homeostasis and metabolism in Lebanese Older Adults: a randomized controlled trial. J Nutr Health Aging. 2018;22(9):1128–1132.
9. Chau YT, Nashi N, Law SC, et al. Undertreatment of osteoporosis following Hip fracture: a retrospective, observational study in Singapore. Arch Osteoporosis. 2020;15(1):141.
10. Jenkinson C. The vitamin D metabolome: an update on analysis and function. Cell Biochem Funct. 2019;37(6):408–423.
11. De Boer IH, Zelnick LR, Afkarian M, et al. Impaired glucose and insulin homeostasis in moderate-Severe CKD. J Am Soc Nephrol. 2016;27(9):2861–2871.
12. Nigwekar SU, Tamez H, Thadhani R. Vitamin D and chronic kidney disease-mineral bone disease (CKD-MBD). Bonekey Rep. 2014;3:498.
13. Rafiq S, Jeppesen PB. Body mass index, vitamin D, and type 2 diabetes: a systematic review and meta-analysis. Nutrients. 2018;10:9.
14. Zittermann A, Trummer C, Theiler-Schwetz V, et al. Vitamin D and cardiovascular disease: an updated narrative review. Int J Mol Sci. 2021;22:6.
15. Husemoen LLN, Thuesen BH, Fenger M, et al. Serum 25(OH)D and type 2 diabetes association in a general population a prospective study. Diabetes Care. 2012;35(8):1695–1700.
16. Gagnon C, Lu ZX, Magliano DJ, et al. Low serum 25-hydroxyvitamin D is associated with increased risk of the development of the metabolic syndrome at five years: results from a national, population-based prospective study (The Australian Diabetes, Obesity and Lifestyle Study: ausDiab). J Clin Endocrinol Metab. 2012;97(6):1953–1961.
17. Yu L, Zhai Y, Shen S. Association between vitamin D and prediabetes: a PRISMA-compliant meta-analysis. Medicine. 2020;99(8):e19034.
18. Senyigit A. The association between 25-hydroxy vitamin D deficiency and diabetic complications in patients with type 2 diabetes mellitus. Diabetes Metab Syndr. 2019;13(2):1381–1386.
19. Choi SW, Kweon SS, Lee YH, et al. 25-Hydroxyvitamin D and parathyroid hormone levels are independently associated with the hemoglobin A1c level of Korean type 2 diabetic patients: the Dong-Gu Study. PLoS One. 2016;11(6):e0158764.
20. El Lithy A, Abdella RM, El-Faissal YM, et al. The relationship between low maternal serum vitamin D levels and glycemic control in gestational diabetes assessed by HbA1c levels: an observational cross-sectional study. BMC Pregnancy Childbirth. 2014;14:362.
21. Shenoy V, Datta P, Prabhu K, et al. Association between vitamin D, fasting blood glucose, HbA1c and fasting lipid profile in euglycemic individuals. J Diabetes Res. 2014;2014:a1–8.
22. Chen H, Zhong N, Lu Z. Internal Medicine.
23. Hu Z, Yang K, Hu Z, et al. Determining the association between hypertension and bone metabolism markers in osteoporotic patients. Medicine. 2021;100(24):e26276.
24. Zittermann A, Schleithoff SS, Koerfer R. Putting cardiovascular disease and vitamin D insufficiency into perspective. Br J Nutr. 2005;94(4):483–492.
25. Kitaura H, Ogawa S, Ohori F. Effects of incretin-related diabetes drugs on bone formation and bone resorption. Int J Mol Sci. 2021;22:12.
26. Stage TB, Christensen MH, Jørgensen NR. Effects of metformin, rosiglitazone and insulin on bone metabolism in patients with type 2 diabetes. Bone. 2018;112:35–41.
 © 2022 The Author(s). This work is published and licensed by Dove Medical Press Limited. The
full terms of this license are available at https://www.dovepress.com/terms
and incorporate the Creative Commons Attribution
- Non Commercial (unported, 3.0) License.
By accessing the work you hereby accept the Terms. Non-commercial uses of the work are permitted
without any further permission from Dove Medical Press Limited, provided the work is properly
attributed. For permission for commercial use of this work, please see paragraphs 4.2 and 5 of our Terms.
© 2022 The Author(s). This work is published and licensed by Dove Medical Press Limited. The
full terms of this license are available at https://www.dovepress.com/terms
and incorporate the Creative Commons Attribution
- Non Commercial (unported, 3.0) License.
By accessing the work you hereby accept the Terms. Non-commercial uses of the work are permitted
without any further permission from Dove Medical Press Limited, provided the work is properly
attributed. For permission for commercial use of this work, please see paragraphs 4.2 and 5 of our Terms.