Back to Journals » Therapeutics and Clinical Risk Management » Volume 11
The relationships between blood pressure, blood glucose, and bone mineral density in postmenopausal Turkish women
Authors Cakmak HA, Cakmak B, Yumru AE, Aslan S, Enhos A, Kalkan AK, Coskun EI ![]() , Acikgoz AS, Karatas S
, Acikgoz AS, Karatas S
Received 24 August 2015
Accepted for publication 18 September 2015
Published 30 October 2015 Volume 2015:11 Pages 1641—1648
DOI https://doi.org/10.2147/TCRM.S95017
Checked for plagiarism Yes
Review by Single anonymous peer review
Peer reviewer comments 2
Editor who approved publication: Professor Garry Walsh
Huseyin Altug Cakmak,1 Burcu Dincgez Cakmak,2 Ayse Ender Yumru,3 Serkan Aslan,4 Asim Enhos,1 Ali Kemal Kalkan,4 Ebru Inci Coskun,5 Abdullah Serdar Acikgoz,6 Suat Karatas3
1Department of Cardiology, Mustafakemalpasa Government Hospital, Bursa, 2Department of Obstetric and Gynecology, Rize Kackar Government Hospital, Rize, 3Department of Obstetric and Gynecology, Sisli Hamidiye Etfal Training and Research Hospital, 4Department of Cardiology, Mehmet Akif Ersoy Thoracic and Cardiovascular Surgery Training and Research Hospital, Istanbul, 5Department of Obstetric and Gynecology, Inonu University, Malatya, 6Department of Obstetric and Gynecology, Cerrahpasa Medical Faculty, Istanbul University, Istanbul, Turkey
Background: Hypertension, diabetes mellitus, and osteoporosis are important comorbidities commonly seen in postmenopausal women. The aim of the present study was to investigate the relationships between blood pressure, blood glucose, and bone mineral density (BMD) in postmenopausal Turkish women.
Methods: In this cross-sectional study, 270 consecutive patients who were admitted to an outpatient clinic with vasomotor symptoms and/or at least 1 year of amenorrhea were included. The patients were categorized into three groups according to their blood pressure and metabolic status as follows: normotensive, hypertensive nondiabetics, and hypertensive diabetics. The T- and z-scores of the proximal femur and lumbar vertebrae were measured with the dual-energy X-ray absorptiometry method to assess the BMD of the study groups.
Results: Lumbar vertebral T-scores (P<0.001), lumbar vertebral z-scores (P<0.003), and proximal femoral T-scores (P<0.001) were demonstrated to be significantly lower in the hypertensive diabetic group compared to the hypertensive nondiabetic and normotensive groups. Systolic blood pressure was significantly inversely correlated with lumbar vertebral T-scores (r=-0.382; P=0.001), lumbar vertebral z-scores (r=-0.290; P=0.001), and proximal femoral T-scores (r=-0.340; P=0.001). Moreover, diastolic blood pressure was significantly inversely correlated with lumbar vertebral T-scores (r=-0.318; P=0.001), lumbar vertebral z-scores (r=-0.340; P=0.001), and proximal femoral T-scores (r=-0.304; P=0.001). Hypertension (odds ratio [OR]: 2.541, 95% confidence interval [CI]: 1.46–3.48, P=0.003), diabetes mellitus (OR: 2.136, 95% CI: 1.254–3.678, P=0.006), and age (OR: 1.069, 95% CI: 1.007–1.163, P=0.022) were found to be significant independent predictors of osteopenia in a multivariate analysis, after adjusting for other risk parameters.
Conclusion: The present study is the first to evaluate the relationships between blood pressure, blood glucose, and BMD in postmenopausal Turkish women. Moreover, both hypertension and diabetes were demonstrated as significant independent predictors of osteopenia in postmenopausal Turkish women. Clinicians should be aware of the high risk of developing osteopenia in diabetic hypertensive postmenopausal women.
Keywords: hypertension, type 2 diabetes mellitus, postmenopausal, bone mineral density
Introduction
Menopause is a physiological period of a woman’s life during which she lacks menstruation continuously for 12 months.1 Lives have been extended with improved diagnosis and treatment modalities, and women spend 20–30 years in the postmenopausal period.2 One of the most important health problems in the postmenopausal period, in addition to flushing and irritability, is impairment of bone mineral density (BMD), leading to osteopenia or osteoporosis.
Osteopenia defines BMD that is not normal, but that is not as low as the density in osteoporosis. It is defined by bone densitometry with a T-score of −1 to −2.5 based on the definition of the World Health Organization (WHO). Osteopenic decreased BMD leads to bone fragility and an increased risk of bone fractures. The major causes for osteopenia include calcium deficiency, vitamin D deficiency, genetic factors, and physical inactivity. A variety of pharmaceutical agents have been recommended for the treatment of osteopenia, including hormone replacement therapy, selective estrogen receptor modulator therapy, and antiresorptive therapy.3,4 As mentioned earlier, the difference between osteopenia and osteoporosis is that in osteopenia, the bone loss is not as severe as in osteoporosis, which means that someone with osteopenia is more likely to fracture a bone than someone with normal bone density, but less likely to do so than someone with osteoporosis.4
Hypertension is associated with alterations in calcium metabolism, leading to increased calcium loss, compensatory activation of the parathyroid gland, and increased movement of calcium from the bones.5 The long-lasting impairment of hypertension in calcium homeostasis may constitute one of the mechanisms involved in the pathophysiology of age-related excessive reduction of BMD. Moreover, it has been reported that calcium loss associated with high blood pressure may be due to lack of ability of the kidneys to handle this mineral. Recent study has also suggested that raised angiotensin II levels in hypertensive settings have a harmful effect by increasing bone resorption and decreasing mineralization.6
Metabolic alterations, which may be seen in type 2 diabetes mellitus (DM), can trigger impairments of calcium homeostasis, skeletal metabolism, and bone mass.7 Some recent studies have demonstrated an increased fracture risk related to type 2 diabetes; in type 2 diabetes complicated by osteoporosis, a larger decrease in bone formation than in bone resorption may be seen compared to the setting of postmenopausal osteoporosis, which mainly influences the indexes of bone formation and may be a lower turnover ratio type.8 Although type 1 DM has been associated with decreased BMD,9 there have been conflicting reports about BMD in type 2 DM; some authors have reported elevated BMD, some have reported decreased BMD, and others have reported that BMD did not change.10
Since the association between both blood pressure and glucose levels with BMD at the same time has not been studied previously in postmenopausal Turkish women, we aimed to investigate this relationship in this setting.
Materials and methods
In this observational cross-sectional study, 270 consecutive patients, who were admitted to an outpatient clinic of a high-volume training and research hospital with vasomotor symptoms and/or at least 1 year of amenorrhea between January and June 2014, were included. The patients were categorized into three groups according to blood pressure and metabolic status as follows: normotensive, hypertensive nondiabetics, and hypertensive diabetics.
The exclusion criteria for the present study were as follows: a regular or passive smoking habit; thyroid or parathyroid dysfunction; metabolic disease, including vitamin D deficiency indicated by a 25-hydroxyvitamin D3 level of <30 ng/mL; liver, kidney, or small or large intestinal dysfunction; some antihypertensive medications that affect calcium homeostasis and BMD, such as thiazide-group diuretics and calcium channel blockers, statins, antiaggregants, anticoagulants, and hormone replacement therapy; type 1 DM; metabolic syndrome; acute or chronic infectious disease; malignancy; and acute or chronic inflammatory disease.
The demographic and clinical characteristics of the study groups, including age, height, weight, total duration since onset of menopause, past medical history including chronic diseases and medications, systolic and diastolic blood pressures, and heart rate on admission, were collected from patient records.
The height and weight of each study participant were measured, and body mass index (BMI) was calculated as body weight in kilograms divided by the square of the height in meters (kg/m2). A combined assessment of leisure time and work activity during the study period was categorized into four grades of increasing activity via a questionnaire on which the participant, assisted by the survey physician, assigned a grade for her activity. The four levels were: 1) being almost entirely inactive or engaging in light physical activity 2 h/wk (eg, reading and watching television); 2) engaging in light physical activity for 2–4 h/wk (eg, walking, cycling, washing dishes, light gardening, and light physical exercise); 3) engaging in light physical activity for 4 h/wk or more vigorous activity for 2–4 h/wk (eg, brisk walking at 3–4 mph, fast cycling, heavy gardening, and sports that cause perspiration or exhaustion); and 4) engaging in vigorous physical activity for 4 h/wk, regular heavy exercise, or competitive sports several times per week. Level 1 was considered physically inactive, level 2 was considered a low level of physical activity, and levels 3 and 4 together were considered a moderate to high level of physical activity.
The T- and z-scores of the proximal femur and lumbar vertebrae were measured with the dual-energy X-ray absorptiometry (DEXA) method to assess the BMD of the study groups.
The eligible patients were between 40 years and 80 years of age, and all were able to provide written informed consent, which was a prerequisite for enrollment. The study complied with the Declaration of Helsinki, and the trial protocol was approved by the local ethics committee.
Definitions
Hypertension was diagnosed if systolic arterial pressure exceeded 140 mmHg and/or diastolic arterial pressure exceeded 90 mmHg, or if the patient used antihypertensive drugs.11 DM was defined as a previous history of the disease; the use of diet, insulin, or oral antidiabetic drugs; or a fasting venous blood glucose level of ≥126 mg/dL on two occasions in previously untreated patients.12
Laboratory measurements
Blood samples were drawn by venipuncture, using the vacutainer system from Becton Dickinson (Franklin Lakes, NJ, USA), into tubes containing anticoagulant ethylenediamminetetraacetates. Samples were collected from the antecubital vein between 8 am and 10 am after a 12-hour overnight fast, with the patient in a sitting position. The serum was obtained by centrifugation at 3,000 rpm at 4°C for 15 minutes. All routine biochemical and hematological parameter measurements were obtained on the day of the blood draw. The biochemical parameters, including fasting blood glucose, creatinine, sodium, potassium, calcium, hemoglobin A1c, total cholesterol, high-density lipoprotein cholesterol, low-density lipoprotein cholesterol, and triglycerides, were measured using an Abbott Diagnostics C8000i auto-analyzer (Abbott; Germany) with commercial kits. The low-density lipoprotein cholesterol was assayed by applying Friedewald’s formula for samples with triglycerides of ≤400 mg/dL. Hematological parameters were obtained using the Coulter LH 780 Hematology Analyzer (Beckman Coulter Ireland, Inc., Mervue, Galway, Ireland).
Dual-energy X-ray absorptiometry
BMD was measured for the lumbar spine (L2–L4) and proximal femur using a GE Lunar DPX-NT PRO (Lunar Corp., Adison, WI, USA) by DEXA scanning. BMD was determined according to standard lunar protocols. BMD was expressed in g/cm2 and as peak bone mass percentage in normal subjects (T-score), depending on the software used in the device. The results for the femoral neck and the lumbar spine were classified into three groups according to the WHO criteria: normal (T-score of ≥1.0 standard deviation [SD]), osteopenia (T-score from −1.0 to −2.5 SD), and osteoporosis (T-score of ≤2.5 SD). Patients with osteopenia or osteoporosis (T-score ≤1.0 SD) were grouped as having low bone mass.
The z-score is defined as measured BMD minus age-matched mean BMD divided by age-matched SD. Although not as widely used as the T-score, the z-score nevertheless remains a useful concept because it expresses the patient’s risk of sustaining an osteoporotic fracture, relative to their peers. It is particularly beneficial in situations when it is inappropriate to use the T-score, such as prior to the acquisition of peak bone mass. It can also be useful to consider the z-score in elderly individuals, a high proportion of them are classified as osteoporotic according to T-score criteria, even when BMD is normal for age.13
Statistical analysis
In the statistical analysis, continuous normally distributed variables were presented as mean ± SD. Categorical variables were presented as frequencies and/or percentages. The Kolmogorov–Smirnov test was used to evaluate whether the continuous variables were normally distributed. Student’s t-test was used for the comparison of normally distributed continuous numerical variables, the Mann–Whitney U-test was used for nonnormally distributed numerical variables, and the χ2 test was used for comparing categorical variables between the two groups. The one-way analysis of variance test was used for comparing categorical variables between the three groups. Correlations between systolic and diastolic blood pressures and lumbar vertebral T-scores, lumbar vertebral z-scores, and proximal femoral T-scores were assessed using the Pearson correlations test. A univariate and backward stepwise multivariate logistic regression analysis, which included variables with a P-value of <0.1 and the respective odds ratios (ORs) with a 95% confidence interval (CI), was performed to identify the independent predictors of osteopenia. A two-sided P-value was considered for all comparisons. Statistical significance was defined as P<0.05. Statistical analyses were carried out using the Statistical Package for Social Sciences for Windows 13.0 (SPSS Inc., Chicago, IL, USA).
Results
The baseline demographic and clinical characteristics of the study groups are presented in Table 1. There was no difference between the groups regarding the baseline demographic and clinical characteristics, except for systolic and diastolic blood pressures, which were found to be significantly higher in the hypertensive diabetic group compared to the hypertensive nondiabetic and normotensive groups (both P=0.001). There was no difference between the hypertensive diabetic group and the hypertensive nondiabetic group in terms of antihypertensive medications, such as angiotensin-converting enzyme inhibitors, angiotensin receptor blockers, beta blockers, and alpha blockers (all P>0.05). Moreover, the usage rates of alendronate, risedronate, and raloxifene were higher in the hypertensive diabetic group compared to the hypertensive nondiabetic and normotensive groups, which were statistically nonsignificant (all P>0.05). The baseline laboratory characteristics of the study groups are reported in Table 2. The fasting blood glucose and hemoglobin A1c levels were significantly higher in the hypertensive diabetic group compared to the hypertensive nondiabetic and normotensive groups (both P=0.001).
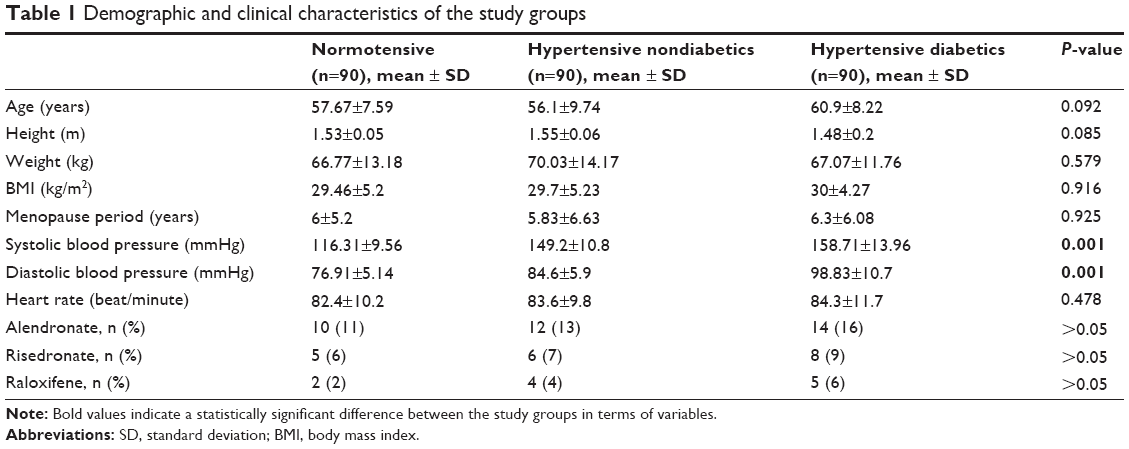 | Table 1 Demographic and clinical characteristics of the study groups |
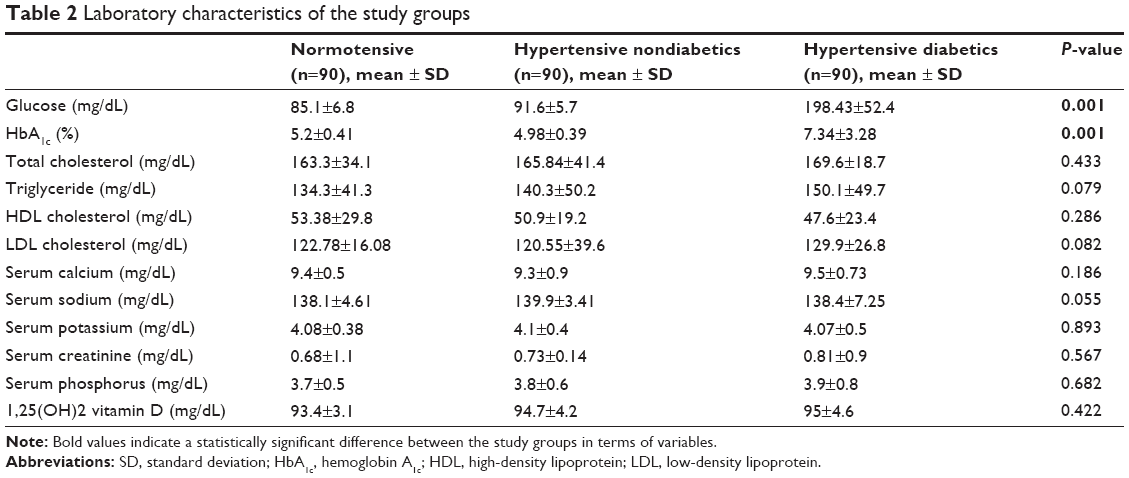 | Table 2 Laboratory characteristics of the study groups |
The results of measurement of BMD detected by DEXA between the three groups are presented in Table 3. These indicated osteopenia according to the WHO definition. Moreover, the lumbar vertebral T-scores (P<0.001), lumbar vertebral z-scores (P<0.003), and proximal femoral T-scores (P<0.001) were demonstrated to be significantly lower in the hypertensive diabetic group compared to the hypertensive nondiabetic and normotensive groups. However, the proximal femoral z-scores were not different between the three groups (P=0.499).
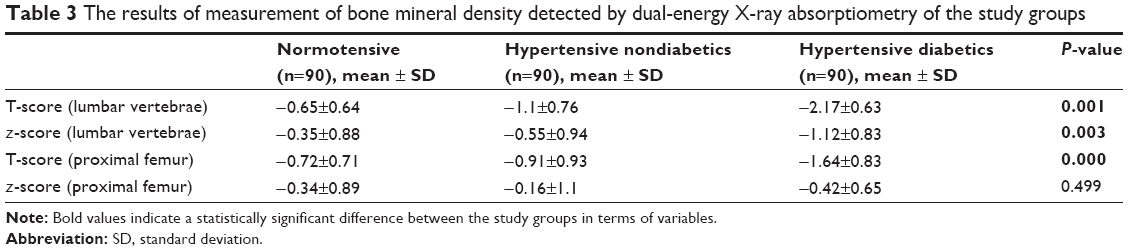 | Table 3 The results of measurement of bone mineral density detected by dual-energy X-ray absorptiometry of the study groups |
Furthermore, the lumbar vertebral T-scores (P<0.001) were significantly lower in the hypertensive diabetic group compared to the hypertensive nondiabetic group. Similarly, the lumbar vertebral T-scores (P<0.001) were significantly lower in the hypertensive nondiabetic group compared to the normotensive nondiabetic group. The lumbar vertebral z-scores were also demonstrated to be significantly lower in the hypertensive diabetic group compared to the hypertensive nondiabetic group (P<0.001). A similar relationship was found between the hypertensive diabetic group and the normotensive nondiabetic group (P<0.001). In addition, the proximal femoral T-scores were significantly lower in the hypertensive diabetic group compared to the hypertensive nondiabetic group (P<0.001). A similar association was obtained in the hypertensive diabetic group compared to the normotensive nondiabetic group (P<0.001).
Systolic blood pressure was significantly inversely correlated with lumbar vertebral T-scores (r=−0.382; P=0.001) (Figure 1), lumbar vertebral z-scores (r=−0.290; P=0.001) (Figure 2), and proximal femoral T-scores (r=−0.340; P=0.001) (Figure 3). Moreover, diastolic blood pressure was significantly inversely correlated with lumbar vertebral T-scores (r=−0.318; P=0.001) (Figure 4), lumbar vertebral z-scores (r=−0.340; P=0.001) (Figure 5), and proximal femoral T-scores (r=−0.304; P=0.001) (Figure 6).
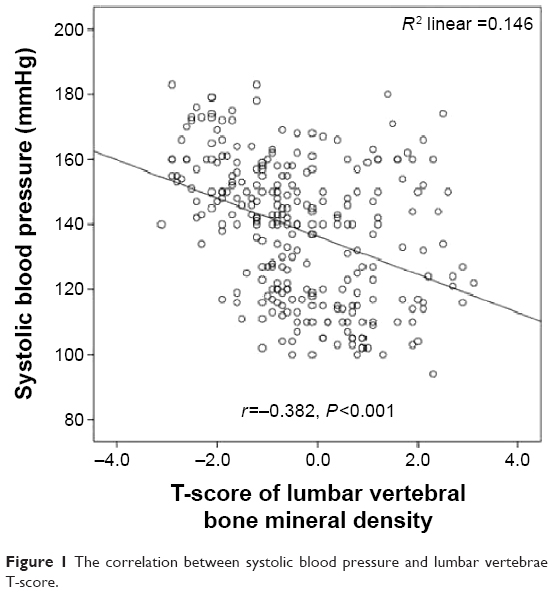 | Figure 1 The correlation between systolic blood pressure and lumbar vertebrae T-score. |
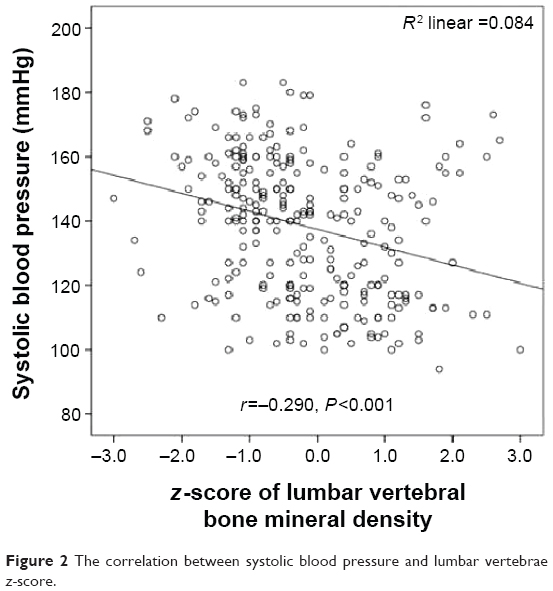 | Figure 2 The correlation between systolic blood pressure and lumbar vertebrae z-score. |
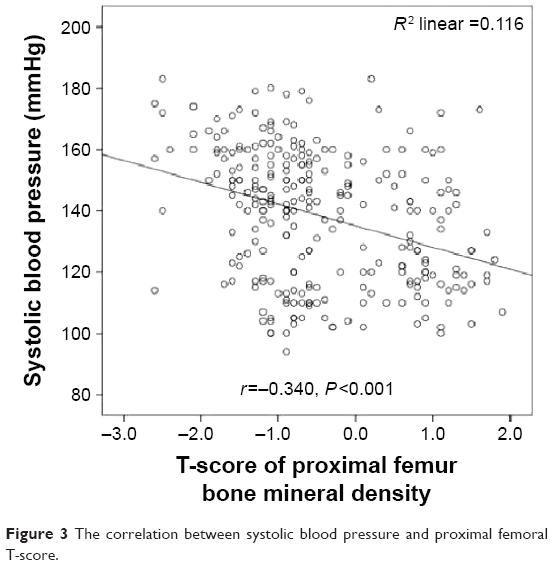 | Figure 3 The correlation between systolic blood pressure and proximal femoral T-score. |
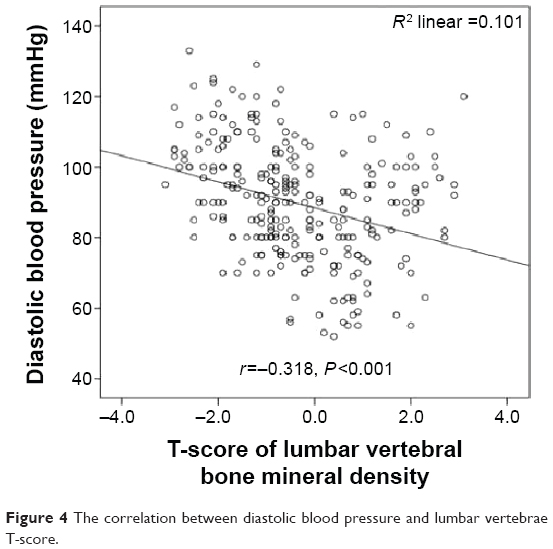 | Figure 4 The correlation between diastolic blood pressure and lumbar vertebrae T-score. |
 | Figure 5 The correlation between diastolic blood pressure and lumbar vertebrae z-score. |
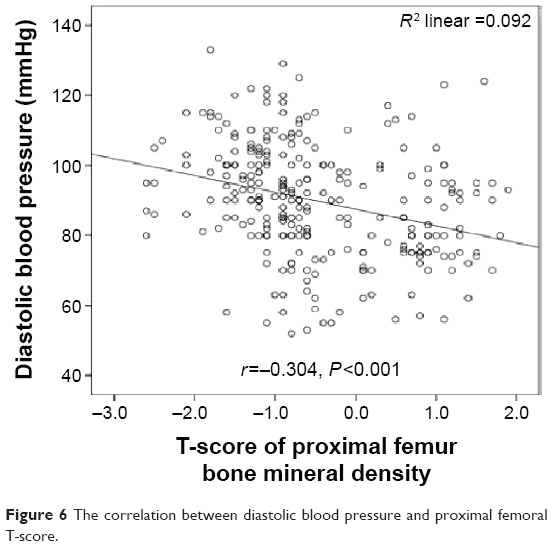 | Figure 6 The correlation between diastolic blood pressure and proximal femoral T-score. |
In a univariate regression analysis, age, presence of hypertension, and presence of DM were significantly associated with osteopenia. Hypertension (OR: 2.541, 95% CI: 1.46–3.48, P=0.003), DM (OR: 2.136, 95% CI: 1.254–3.678, P=0.006), and age (OR: 1.069, 95% CI: 1.007–1.163, P=0.022) were found to be significant independent predictors of osteopenia in a multivariate analysis, after adjusting for other risk parameters (Table 4).
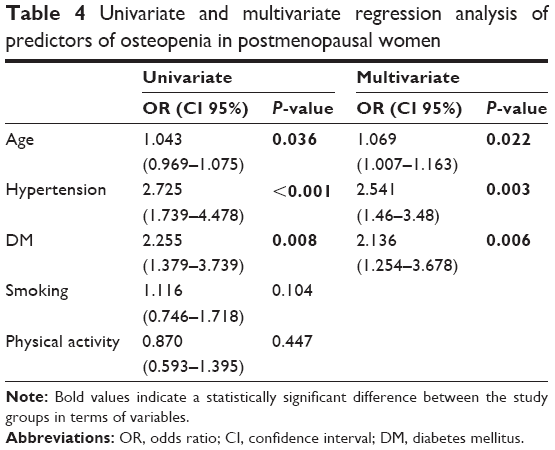 | Table 4 Univariate and multivariate regression analysis of predictors of osteopenia in postmenopausal women |
Discussion
In this study, we reported that BMD was significantly reduced in diabetic hypertensive postmenopausal Turkish women compared to nondiabetic hypertensives and normotensives. Furthermore, there were no differences detected between nondiabetic hypertensive and normotensive patients in terms of BMD. Hypertension, DM, and age were significant independent predictors of osteopenia in postmenopausal Turkish women.
The sex steroid levels, including estrogen, rapidly decrease in postmenopausal women. Hence, bone remodeling and calcium absorption from the bowels are impaired via raised inflammatory cytokines. In particular, within the first 15 years following menopause, bone density loss of up to 75% occurs.14 Other factors affecting bone density in postmenopausal women are comorbid diseases, foremost among which are diabetes and hypertension. Moreover, BMD is affected not only by serum calcium levels but by many other genetic and environmental risk factors, including diet, exercise habits, age, sex, race, and hormonal differences. The differences of BMD in cases of similar serum calcium levels may be due to these genetic and environmental risk factors between the three study groups.
Although the effects of hypertension on BMD and the mechanisms explaining this are not clear, there are some studies regarding the matter. In a study by Tsuda et al involving Japanese women with essential hypertension, it was stated that there was an inverse relationship between lumbar vertebral BMD and systolic blood pressure.15 In a prospective study conducted by Cappuccio et al, which investigated the association between blood pressure and bone mineral loss over time in elderly postmenopausal Caucasian women, it was shown that BMD decreased in the femoral neck with increasing systolic blood pressure. Moreover, for diastolic blood pressure, there was an association with bone loss in women younger than 75 years.5 In another study on the Swedish population, similar to the results of the study by Cappuccio et al, it was found that blood pressure and BMD were inversely related.6 In a study by Yazici et al conducted on a Turkish population, it was indicated that the presence of hypertension in postmenopausal women was an independent predictive indicator for low bone density.16 In this study, we detected that the BMD was significantly lower in hypertensive diabetic patients compared to hypertensive nondiabetic and normotensive patients.
In contrast to these studies, Mussolino et al did not find a relationship between hypertension and proximal femur BMD in a study they conducted while controlling for other potential influential parameters, such as BMI, age, smoking, and alcohol consumption.17 Likewise, in the National Health and Nutrition Examination Survey, no relationships were determined between hypertension and BMD.18
One of the mechanisms explaining the effect of hypertension on BMD is the increase in gene polymorphism in angiotensin-converting enzyme and in angiotensin II levels.18 This may cause an increase in bone resorption and may inhibit mineralization. Pérez-Castrillón et al showed that angiotensin-converting enzyme inhibitors and angiotensin II receptor blockers might also be useful in the treatment of osteoporosis in hypertensive women. Further, it is known that thiazides and angiotensin-converting enzyme inhibitors are related to increased calcium resorption.18 In our study, no significant decrease in BMD was detected when the hypertensive and normotensive groups were compared. The results of the present study differ from those of previous studies regarding hypertension due to a number of factors: patients taking thiazides were excluded from our study, while patients taking angiotensin-converting enzyme inhibitors were not; our study group only involved postmenopausal women, not men or young women; and in previous studies, diabetic patients were not excluded from the hypertensive group.
The relationship between diabetes and BMD was investigated in previous studies.19,20 It is thought that in patients with type 1 DM, insulin deficiency, decreased IGF-1 levels, and hypercalciuria play a role in the pathogenesis of increased bone loss.14 The femoral neck and trochanteric region values found in type 1 DM patients between the ages of 52 years and 57 years were determined to be lower than the values seen in type 2 DM patients and healthy controls.21 In postmenopausal type 1 DM patients, BMD was found to be relatively low. In type 2 DM patients, the risk of osteopenia is not as overt as in type 1 DM patients. While some studies on these patients indicated a decrease in BMD, others detected an increase. The mechanisms explaining the increase in BMD are obesity, the anabolic and mitogen effects of hyperinsulinemia, an increase in sex hormone-binding globulin, and increased estrogen and testosterone levels.22 Obesity increases the conversion of estrogen in peripheral tissues and acts as a safeguard against osteoporosis. Furthermore, the insulin resistance of fat cells may increase circulating quantities of sex hormones, such as androgens and estrogen, thereby increasing bone mass. Several epidemiological studies have shown that high body weights or high BMIs are related to high bone mass, and that decreases in body weight may cause bone loss.23,24
In a study by Isaia et al, decreased BMD was detected in patients with type 2 DM. This decrease arose from the period before the diagnosis of the disease, when metabolic control was impaired.25 In another study, forearm BMD in type 2 DM was found to be decreased.26 One of the ambiguities of type 2 DM is that the effect of oral antidiabetics on BMD is not exactly known. Studies have indicated that metformin increased osteogenesis by directly affecting the osteoblasts, and although sulfonylureas had an indirect favorable effect on fracture risk by correcting the glycemic control, they had an overall effect of reducing BMD, and pioglitazone was correlated with an increased fracture risk in postmenopausal women.27,28 In our study, diabetes caused a decrease in the BMD of the lumbar vertebrae and femur regions. All of the patients enrolled in our study had type 2 DM with good metabolic control.
Study limitations
The most important limitations of our study are that it is not prospective and it is a single-center study. The analysis of this study is restricted to postmenopausal women aged 50 years and older; therefore, the findings are not generalized to men or younger women. Since there is a lack of knowledge on the precise relationships between hypertension, diabetes, and BMD, further wide-scale prospective studies are needed, including analyses according to the agents used for treatment.
Conclusion
The present study is the first to demonstrate the strong relationships between blood pressure, blood glucose, and BMD at the same time in postmenopausal Turkish women. In our study, lumbar T- and z-scores and proximal femoral T-scores in hypertensive diabetic patients were found to be lower compared to isolated hypertensive nondiabetic or normotensive subjects. Moreover, both hypertension and diabetes were demonstrated as significant independent predictors of osteopenia in postmenopausal Turkish women. Clinicians should be aware of the high risk of developing osteopenia in diabetic hypertensive postmenopausal women.
Acknowledgment
The authors received no financial support for the research, authorship, and/or publication of this article.
Disclosure
The authors report no conflicts of interest in this work.
References
Vandenakker BC, Glass DD. Menopause and aging with disability. Phys Med Rehabil Clin N Am. 2002;12(suppl 1):s133–s151. | ||
Vural ZT, Gönenç I. Menopozda Yaşam Kalitesi [Life Quality in Menopause]. Turkiye Klinikleri J Fam Med Spec Top. 2014;5:64–69 [Turkish]. | ||
Root AW, Diamond FB. Disorders of mineral homeostasis in newborn, infant, child, and adolescent. In: Sperling MA, editor. Pediatric Endocrinology. Philadelphia: Elsevier Saunders; 2008:686–769. | ||
Karaguzel G, Holick MF. Diagnosis and treatment of osteopenia. Rev Endocr Metab Disord. 2010;11(4):237–251. | ||
Cappuccio FP, Meilahn E, Zmuda JM, Cauley JA. High blood pressure and bone-mineral loss in elderly women: a prospective study. Lancet. 1999;354:971–975. | ||
Pérez-Castrillón JL, Justo I, Silva J, et al. Bone mass and bone modelling markers in hypertensive postmenopausal women. J Hum Hypertens. 2003;17:107–110. | ||
Carnevale V, Romagnoli E, D’Erasmo E. Skeletal involvement in patients with diabetes mellitus. Diabetes Metab Res Rev. 2004;20:196–204. | ||
Ottenbacher KJ, Ostir GV, Peek MK, Goodwin JS, Markides KS. Diabetes mellitus as a risk factor for hip fracture in mexican american older adults. J Gerontol A Biol Sci Med Sci. 2002;57:M648–M653. | ||
Suzuki K, Sugimoto C, Takizawa M, et al. Correlations between bone mineral density and circulating bone metabolic markers in diabetic patients. Diabetes Res Clin Pract. 2000;48:185–191. | ||
Wakasugi M, Wakao R, Tawata M, Gan N, Koizumi K, Onaya T. Bone mineral density measured by dual energy x-ray absorptiometry in patients with non-insulin-dependent diabetes mellitus. Bone. 1993;14:29–33. | ||
James PA, Oparil S, Carter BL, et al. 2014 Evidence-based guideline for the management of high blood pressure in adults: report from the panel members appointed to the Eighth Joint National Committee (JNC 8). JAMA. 2014;311:507–520. | ||
Kadoglou NP, Iliadis F, Angelopoulou N, et al. Cardiorespiratory capacity is associated with favourable cardiovascular risk profile in patients with type 2 diabetes. J Diabetes Complications. 2009;23:160–166. | ||
Kanis JA, McCloskey EV, Johansson H, Oden A, Melton LJ, Khaltaev N. A reference standard for the description of osteoporosis. Bone. 2008;42:467–475. | ||
Öktem IK, Hekimsoy Z. Tip 2 Diyabetes Mellitus’ta Kemik Mineral Yoğunluğu [Bone mineral density in type 2 diabetes mellitus]. T Klin Tip Bilimleri. 2003;23:371–377 [Turkish]. | ||
Tsuda K, Nishio I, Masuyama Y. Bone mineral density in women with essential hypertension. Am J Hypertens. 2001;14:704–707. | ||
Yazici S, Yazici M, Korkmaz U, et al. Relationship between blood pressure levels and bone mineral density in postmenopausal Turkish women. Arch Med Sci. 2011;2:264–270. | ||
Mussolino ME, Madans JH, Gillum RF. Bone mineral density, blood pressure and stroke in elderly women. Stroke. 2003;34:210–211. | ||
Pérez-Castrillón JL, Justo I, Silva J, et al. Relationship between bone mineral density and angiotensin converting enzyme polymorphism in hypertensive postmenopausal women. Am J Hypertens. 2003;16:233–235. | ||
Albright F, Reifestein EC. Parathyroid Glands and Metabolic Bone Disease: Selected Studies. Vol. 150. 2nd ed. Baltimore: Williams and Wilkins Company; 1948:62. | ||
Meema EF, Meema S. The relationship of diabetes mellitus and body weight to osteoporosis in elderly females. Can Med Assoc J. 1967;96:132–139. | ||
Demirhan E, Eriman E, İçağasioğlu A, Haliloğlu S. Tip 1 Diabetes Mellituslu Hastalarin Kemik Mineral Yoğunluğu Sağlikli Kontrollerinkinden Farkli mı? [Is a bone mineral density of type 1 diabetes mellitus is different from healthy controls?] Osteoporoz Dünyasindan. 2007;13:28–32 [Turkish]. | ||
Lunt H, Florkowski CM, Cundy T, et al. A population-based study of bone mineral density in women longstanding type 1 (insülin dependent) diabetes. Diabetes Res Clin Pract. 1998;40:31–81. | ||
Douchi T, Yamamoto S, Oki T, et al. Difference in the effect of adiposity on bone density between pre- and postmenopausal women. Maturitas. 2000;34:261–266. | ||
Guney E, Kisakol G, Ozgen G, Yilmaz C, Yilmaz R, Kabalak T. Effect of weight loss on bone metabolism: comparison of vertical banded gastroplasty and medical intervention. Obes Surg. 2003;13:383–388. | ||
Isaia GC, Ardissone P, Di Stefano M, et al. Bone metabolism in type 2 diabetes mellitus. Acta Diabetol. 1999;36:35–38. | ||
Durmuş D, Topal T. Diabet ve Osteoporoz [Diabetes and osteoporosis]. Osteoporoz Dünyasindan. 2005;11:121–126 [Turkish]. | ||
Montagnani A, Gonnelli S. Antidiabetic therapy effects on bone metabolism and fracture risk. Diabetes Obes Metab. 2013;15:784–791. | ||
Dormandy JA, Charbonnel B, Eckland DJ, et al; PROactive Investigators. Secondary prevention of macrovascular events in patients with type 2 diabetes in the PROactive Study (PROspective pioglitAzone Clinical Trial In macroVascular Events): a randomised controlled trial. Lancet. 2005;366:1279–1289. |
 © 2015 The Author(s). This work is published and licensed by Dove Medical Press Limited. The
full terms of this license are available at https://www.dovepress.com/terms
and incorporate the Creative Commons Attribution
- Non Commercial (unported, 3.0) License.
By accessing the work you hereby accept the Terms. Non-commercial uses of the work are permitted
without any further permission from Dove Medical Press Limited, provided the work is properly
attributed. For permission for commercial use of this work, please see paragraphs 4.2 and 5 of our Terms.
© 2015 The Author(s). This work is published and licensed by Dove Medical Press Limited. The
full terms of this license are available at https://www.dovepress.com/terms
and incorporate the Creative Commons Attribution
- Non Commercial (unported, 3.0) License.
By accessing the work you hereby accept the Terms. Non-commercial uses of the work are permitted
without any further permission from Dove Medical Press Limited, provided the work is properly
attributed. For permission for commercial use of this work, please see paragraphs 4.2 and 5 of our Terms.