Back to Journals » Diabetes, Metabolic Syndrome and Obesity » Volume 12
The relationship of mitochondrial dysfunction and the development of insulin resistance in Cushing’s syndrome
Authors Ježková J, Ďurovcová V, Wenchich L ![]() , Hansíková H
, Hansíková H ![]() , Zeman J, Hána V, Marek J
, Zeman J, Hána V, Marek J ![]() , Lacinová Z, Haluzík M
, Lacinová Z, Haluzík M ![]() , Kršek M
, Kršek M
Received 18 March 2019
Accepted for publication 13 June 2019
Published 19 August 2019 Volume 2019:12 Pages 1459—1471
DOI https://doi.org/10.2147/DMSO.S209095
Checked for plagiarism Yes
Review by Single anonymous peer review
Peer reviewer comments 3
Editor who approved publication: Prof. Dr. Antonio Brunetti
Jana Ježková,1 Viktória Ďurovcová,1 Laszlo Wenchich,2,3 Hana Hansíková,3 Jiří Zeman,3 Václav Hána,1 Josef Marek,1 Zdeňka Lacinová,4,5 Martin Haluzík,4,5 Michal Kršek1
1Third Department of Medicine, First Faculty of Medicine, Charles University and General University Hospital, Prague, Czech Republic; 2Institute of Rheumatology, Prague, Czech Republic; 3Department of Pediatrics and Adolescent Medicine, First Faculty of Medicine, Charles University and General University Hospital, Prague, Czech Republic; 4Institute of Medical Biochemistry and Laboratory Diagnostic, First Faculty of Medicine, Charles University and General University Hospital, Prague, Czech Republic; 5Centre for Experimental Medicine, Institute for Clinical and Experimental Medicine, Prague, Czech Republic
Correspondence: Jana Ježková
Third Department of Medicine, First Faculty of Medicine, Charles University and General University Hospital, U Nemocnice 1128 02 Praha 2, Prague, Czech Republic
Tel +420 60 641 2613
Fax +420 22 491 9780
Email [email protected]
Purpose: Cushing’s syndrome is characterized by metabolic disturbances including insulin resistance. Mitochondrial dysfunction is one pathogenic factor in the development of insulin resistance in patients with obesity. We explored whether mitochondrial dysfunction correlates with insulin resistance and other metabolic complications.
Patients and methods: We investigated the changes of mRNA expression of genes encoding selected subunits of oxidative phosphorylation system (OXPHOS), pyruvate dehydrogenase (PDH) and citrate synthase (CS) in subcutaneous adipose tissue (SCAT) and peripheral monocytes (PM) and mitochondrial enzyme activity in platelets of 24 patients with active Cushing’s syndrome and in 9 of them after successful treatment and 22 healthy control subjects.
Results: Patients with active Cushing’s syndrome had significantly increased body mass index (BMI), homeostasis model assessment of insulin resistance (HOMA-IR) and serum lipids relative to the control group. The expression of all investigated genes for selected mitochondrial proteins was decreased in SCAT in patients with active Cushing’s syndrome and remained decreased after successful treatment. The expression of most tested genes in SCAT correlated inversely with BMI and HOMA-IR. The expression of genes encoding selected OXPHOS subunits and CS was increased in PM in patients with active Cushing’s syndrome with a tendency to decrease toward normal levels after cure. Patients with active Cushing’s syndrome showed increased enzyme activity of complex I (NQR) in platelets.
Conclusion: Mitochondrial function in SCAT in patients with Cushing’s syndrome is impaired and only slightly affected by its treatment which may reflect ongoing metabolic disturbances even after successful treatment of Cushing’s syndrome.
Keywords: Cushing’s syndrome, insulin resistance, mitochondrial enzyme activity, gene expression
Introduction
Cushing’s syndrome, induced by chronic glucocorticoid excess, is a rare disorder with an estimated annual incidence of 2.4 cases per one million inhabitants and a prevalence of 39.1 cases per million.1,2 Although rare, Cushing’s syndrome is a serious disorder significantly increasing patients’ morbidity and mortality, mainly due to cardiovascular diseases and complications thereof. Insulin resistance is a prominent feature of Cushing’s syndrome.3,4 Glucocorticoid excess influences glucose homeostasis and insulin sensitivity both directly, by interfering with the insulin receptor signaling pathway, and indirectly, by altering fatty acid and amino acid metabolism which contribute to the development of insulin resistance.5,6 Moreover, glucocorticoid excess may have direct effects on pancreatic beta cells.7 Finally, the truncal obesity that often accompanies Cushing’s syndrome contributes to the development of insulin resistance, impaired glucose tolerance and type 2 diabetes.8
Glucocorticoids are known for the anti-inflammatory activity which is attributed to the repression of pro-inflammatory genes at the transcriptional level or through posttranscriptional mechanism via interactions with anti-inflammatory proteins.9 However, chronic hypercortisolism, regardless of its exogenous or endogenous etiology, is associated with cardiovascular, thrombotic and metabolic complications. Chronic hypercortisolism determines a redistribution of body fat deposition leading to increased abdominal adiposity which is characterized by the increase in the abdominal visceral to subcutaneous fat ratio (V/S) in both male and female patients.10,11 In Cushing’s syndrome, visceral adiposity is associated with the altered production of adipokines. Several studies showed elevated leptin levels in patients with active Cushing’s syndrome compared with normal-weight and BMI-matched controls.12,13 The decrease in leptin secretion has been found after long-term remission and reflected changes in body fat.4,14 The elevation of resistin levels was described in female Cushing’s syndrome patients and did not significantly change after cure.4 Specific profile of monocytes, namely higher levels of circulating intermediate CD 14++, CD16+ and nonclassical CD 14+, CD16+ monocytes were found in Cushing’s syndrome patients.15 Both groups of monocytes produce inflammatory cytokines such as TNF-α and IL-1β.16–19 Some studies reported normal levels of circulating tumor necrosis factor – α (TNF-α) and higher levels of soluble TNF-α receptor in patients with active Cushing’s syndrome and after long-term remission.20,21 Similarly, circulating levels of interleukin 1β (IL-1β) and interleukin 6 (IL-6) remained elevated despite long-term remission of Cushing’s syndrome.20,22 Impairment of adipokine secretion, as well as the release of pro-inflammatory cytokines, contributes to a persistent state of chronic low-grade inflammation in patients with active Cushing’s syndrome and after successful treatment.20,22
Mitochondria plays an important role in cell metabolism by metabolizing nutrients and producing adenosine triphosphate (ATP) and heat. The main source of energy for the functional activity of cells is ATP, which is produced by oxidative phosphorylation (OXPHOS) in mitochondria. The adequate oxidative capacity of mitochondria is determined by expression levels of enzymatic complexes involved in oxidative phosphorylation, although the number and size of mitochondria are also important.23 Mitochondria also constantly produces a small amount of superoxide anion radicals. Imbalance between the production and the removal of the superoxide radicals may cause mitochondrial damage.24,25 Mitochondrial dysfunction is considered as one of the important mechanisms in the pathogenesis of insulin resistance and is associated with insulin resistance in skeletal muscle, as well as in other tissues, including fat, blood vessels and the liver, heart and pancreas.26–28
Glucocorticoid hormones are important mediators of the hypermetabolic state, which is seen during stress and after traumatic events. Nevertheless, there may be great differences between the short-term (days) and the long-term (weeks) effects of high levels of glucocorticoids on the mitochondrial metabolism in various tissues.29–31 It was reported that three days of dexamethasone injections increase cytochrome c oxidase activity in rat skeletal muscles, but not in other tissues.30 Conversely, one-day administration of high doses of glucocorticoids stimulated mitochondrial oxidation in cortical neurons, but long-term treatment significantly reduced mitochondrial oxidation.31
We hypothesized that chronic excess of glucocorticoid hormones in patients with Cushing’s syndrome could induce mitochondrial dysfunction which in turn contributes to the development of insulin resistance. The aim of the present study was to explore mitochondrial function in patients with Cushing’s syndrome, both in an active state with glucocorticoid excess and after successful treatment, and its possible implications in the development of insulin resistance.
Materials and methods
Subjects
Twenty-four patients with active Cushing’s syndrome and 22 control subjects participated in the study. Cushing’s syndrome was defined by typical clinical presentation, increased excretion of urinary free cortisol above 500 nmol/24 hrs, increased plasma midnight cortisol levels above 150 nmol/L and a lack of suppression of plasma cortisol levels in low-dose dexamethasone suppression test with cortisol levels remaining above 50 nmol/L. There were 18 patients with ACTH-producing pituitary adenoma and 6 patients with adrenal adenoma in the group of patients with Cushing’s syndrome. In all patients with ACTH-independent Cushing’s syndrome, ACTH levels were below 5 ng/L. Baseline plasma ACTH levels were between 37.4 and 377 ng/L in patients with ACTH-producing pituitary adenoma. Seven patients (five with ACTH-producing pituitary adenoma, two with adrenal adenoma) were treated with steroidogenesis inhibitors, namely ketoconazole (six patients) and metyrapone (one patient), before operation, ie, neurosurgery or unilateral adrenalectomy. Blood and adipose tissue sampling were performed before the initiation of medical treatment with steroidogenesis inhibitors. Nine of the patients with Cushing’s syndrome were also examined within a period of 24–30 months after successful treatment of Cushing’s syndrome. Out of those nine patients, five patients suffered from ACTH-independent Cushing’s syndrome and four from Cushing’s disease. Five patients with adrenal adenoma underwent unilateral adrenalectomy and two of them were treated with ketoconazole preoperatively. Four patients with ACTH-producing pituitary adenoma underwent neurosurgery and one was treated with ketoconazole preoperatively. In all four patients, morning cortisol level was less than 50 nmol/L postoperatively. At the time of blood and adipose tissue analysis after successful treatment, in six patients, the function of hypothalamic–pituitary–adrenal axis was recovered, in three patients, post-operative hypocortisolism persisted and was treated by replacement therapy (Hydrocortisone in doses ranging from 15 to 25 mg daily). Patients with adrenal cancer and ectopic Cushing’s syndrome were excluded from the study. The characteristics of the studied groups are summarized in Table 1.
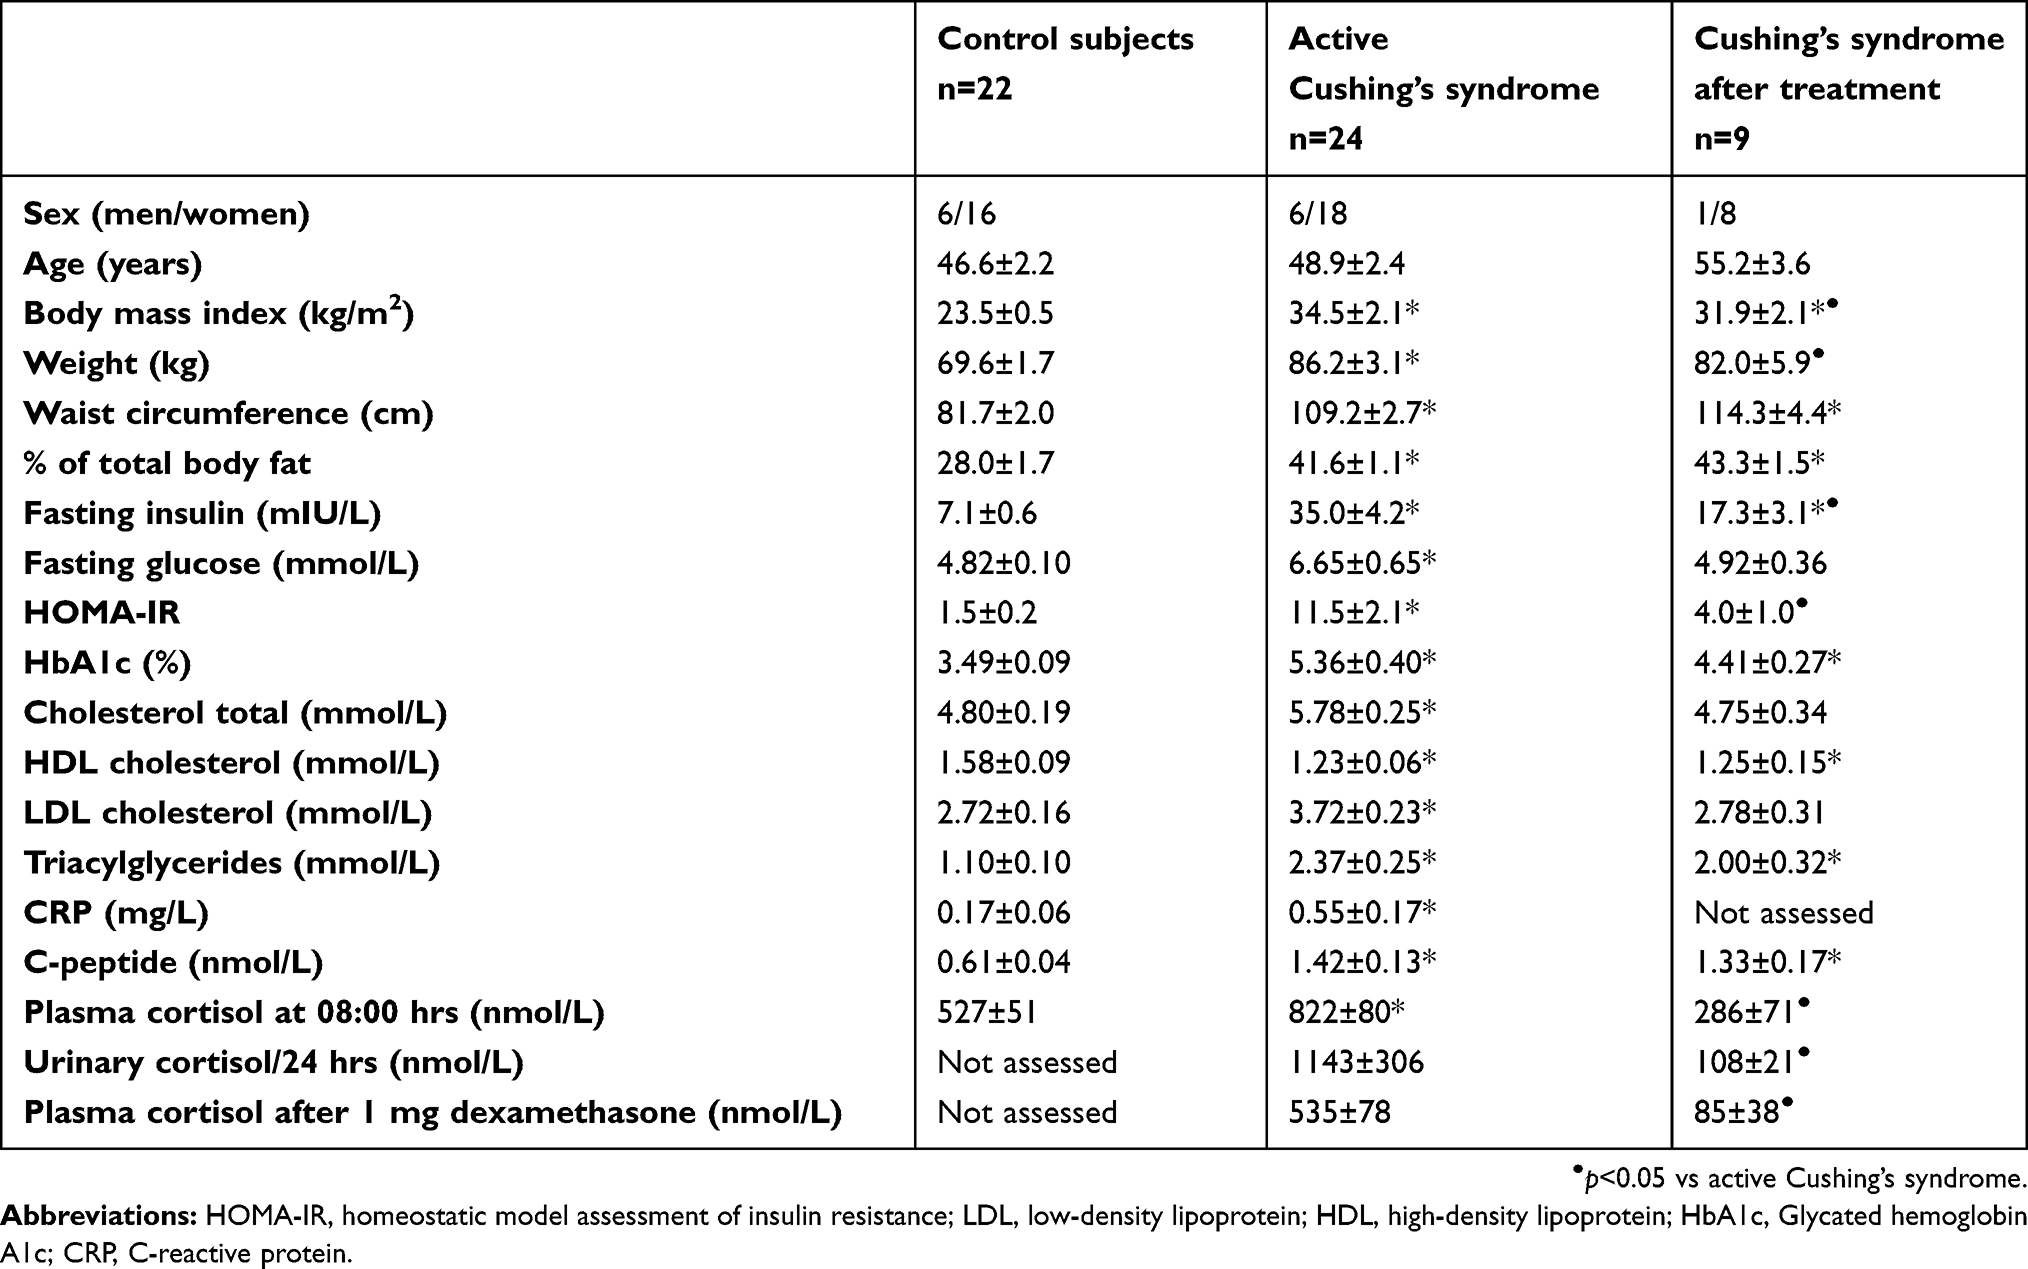 |
Table 1 Anthropometric, biochemical and hormonal characteristics of control subjects and patients with active Cushing’s syndrome and after successful treatment |
The study was approved by the Human Ethics Review Board, First Faculty of Medicine and General University Hospital, Prague, Czech Republic, and was performed in accordance with the guidelines proposed in the Declaration of Helsinki. Written informed consent was requested and obtained from all participants of the study.
Methods
Anthropometric examination, blood and adipose tissue sampling
All subjects were measured, weighed and their body mass index (BMI) was calculated. Blood samples for C-reactive protein (CRP), insulin, morning basal cortisol, cortisol after oral dexamethasone 1 mg taken at 11 p.m., ACTH, C-peptide and biochemical parameters measurement were taken between 7.00 a.m. and 8.00 a.m. after 12 hrs of overnight fasting. Blood sample for late-night cortisol was taken at 00 a.m. Blood samples were separated by centrifugation for 10 mins at 1000 x g within 30 mins from blood collection. Serum was subsequently stored in aliquots at −80°C until further analysis.
For the assessment of urinary free cortisol, patients provided a complete 24-hr urine collection.
Blood samples for monocyte isolation were collected in Na-EDTA anticoagulant and processed within 1–2 hrs.
Samples of SCAT were obtained by needle biopsy from the abdominal region as described previously.32
The percentage of total-body fat was assessed by body composition measurement using Dual-Energy X-Ray Absorptiometry (DEXA, Hologic Discovery, USA).
Hormonal and biochemical assays
Biochemical parameters (glucose, total and HDL-cholesterol and triglycerides, hemoglobin A1c) were measured in the Department of Biochemistry at the General University Hospital by standard laboratory methods. Serum insulin concentrations were measured by the RIA kit (Cis Bio International, Gif-sur-Yvette Cedex, France). Sensitivity was 2.0 mIU/mL. Serum CRP levels were measured by a highly sensitive ELISA (Bender Medsystems, Vienna, Austria) with a sensitivity of 3 mg/L. Plasma levels of cortisol were measured by the RIA kit (Immunotech, Prague, Czech Republic). Sensitivity was 10 nmol/L. Urinary free cortisol levels were determined by the RIA kit (Immunotech, Marseille, France). Sensitivity was 5 nmol/L. ACTH was determined by the IRMA kit (Immunotech, Marseille, France). C-peptide concentrations were determined by IRMA kits (Immunotech, Czech Republic). Sensitivity was 5 pmol/L. The intra- and inter-assay variabilities of the kits were less than 5% and less than 10%, respectively. The homeostasis model assessment of the insulin resistance index (HOMA-IR) was calculated using the following formula: fasting serum insulin (mIU/L)× fasting serum glucose (mmol/L)/22.5.
Mitochondrial enzyme activity assays
Determination of mitochondrial enzymes activity was performed as described previously.33 Shortly, platelets were isolated from 9 mL of blood with citrate by differential centrifugation without the addition of prostacyclin. Platelet protein was determined by Lowry. The enzyme activities of respiratory chain complexes NADH-coenzyme Q10 oxidoreductase (NQR, complex I), succinate-coenzyme Q10 oxidoreductase (SQR, complex II), cytochrome c oxidase (COX, complex IV) and the activity of citrate synthase (CS) were measured spectrophotometrically. All spectrophotometric measurements were performed in 1 mL cuvettes (1 cm, 37°C) using a double beam spectrophotometer Shimadzu UV-160. A total of 100 μg of platelet protein was used for each enzyme assay. Each value represents the mean of two assays on each control or patient platelet sample. Pyruvate dehydrogenase complex (PDH) activity was determined in isolated peripheral blood mononuclear cells (PBMCs) as decarboxylation of [1-14C] pyruvate. PBMCs from peripheral blood were isolated by differential centrifugation on Ficoll gradient.
Peripheral monocyte separation and total RNA isolation from monocytes and adipose tissue
Peripheral monocyte separation and total RNA isolation from monocytes and adipose tissue were described in detail previously.34
In brief, peripheral blood leukocytes were obtained from the blood sample using Ficoll-PaqueTM Plus. After centrifugation, leukocyte agglomerate was discharged and the pellet was dissolved in phosphate buffer pH 7.4 containing EDTA and BSA. Monocytes were isolated from cell pellet with magnetic-activated cell sorting technique (MiniMACS, Miltenyi Biotec, Bergisch Gladbach, Germany) using microbeads coated with CD14 antibody (MACS CD14 MicroBeads; Miltenyi Biotec). Total RNA was extracted from CD14+ monocyte samples on MagNA Pure instrument using MagNAPure Compact RNA Isolation kit (Roche Diagnostics GmbH, Germany).
Samples of SCAT were homogenized on a MagNALyser Instrument using MagNALyser Green Beads (Roche Diagnostics GmbH). Total RNA was extracted from the homogenized sample using RNeasy Lipid Tissue Mini Kit (Qiagen GmbH, Hilden, Germany). The RNA concentration was determined from the absorbance at 260 nm (BioPhotometer, Eppendorf AG, Hamburg, Germany). The integrity of the RNA was checked by visualization of the 18S and 28S ribosomal bands on 1% agarose gels with a GelRed™ Nucleic Acid GelStain.
cDNA sample preparation
Reverse transcription was performed in 20 μL reaction volume with 0.25 μg of total RNA using the High-Capacity cDNA Reverse Transcription Kit (Applied Biosystems, Foster City, CA, USA) according to the manufacturer’s protocol. Synthesized cDNA was stored at −20°C until quantitative real-time PCR.
Quantitative real-time PCR
mRNA expression of selected genes was determined in detail elsewhere.32
In brief, the determination of the mRNA expression of genes of interest MT-ND5 (gene encoding ND-5 subunit of mitochondrial enzyme complex-1, ie, NADH dehydrogenase 5); NDUFA 12 (gene encoding subunit 12 of NADH:ubiquinone oxidoreductase), SDHA (gene encoding flavoprotein subunit A of the complex of succinate dehydrogenase), CYC1 (gene encoding cytochrome c1), COX4I1 (gene encoding COX4I1 subunit of cytochrome c oxidase), ATP50 (gene encoding ATP50 subunit of ATP synthase), DLAT (gene encoding dihydrolipoamide-S-acetyltransferase, E2 subunit of PDH) and CS (gene encoding citrate synthase) was performed using an ABI PRISM 7500 instrument (Applied Biosystems, Foster City, CA, USA) with TaqMan® Universal PCR Master Mix, NO AmpErase® UNG and specific TaqMan® Gene Expression Assays (Applied Biosystems, Foster City, CA, USA). PCR amplifications were performed at least in duplicate in a total reaction volume of 20 μL. The expression of beta-2-microglobulin (B2M) was used to compensate for variations in input RNA amounts and the efficiency of reverse transcription. The modified formula 2−∆Ct was used to calculate relative gene expression.
Statistical analysis
Statistical analysis was performed on SigmaStat software (Systat Software, Inc., San Jose, CA, USA). All data are presented as mean±SEM (the standard error of the mean). Prior to analysis, all continuous variables were assessed for normality using the Kolmogorov–Smirnov test. Differences of relative gene expression, mitochondrial activity and serum biochemical parameters between patients with active Cushing’s syndrome and after successful treatment versus healthy subjects were evaluated using one-way ANOVA followed by Holm–Sidak method or ANOVA on Ranks followed by Dunn’s test as appropriate. Differences between patients with active Cushing’s syndrome versus after successful treatment were evaluated using paired t-test or Wilcoxon signed-rank test as appropriate. Statistical significance was assigned to p˂0.05.
The Spearman correlation test was used to calculate the relationships between the relative expression of selected mitochondrial genes in adipose tissue or in peripheral monocyte to other parameters.
Results
Anthropometric, biochemical and hormonal characteristics of study groups
Patients with active Cushing’s syndrome were comparable to the control group in age and gender distribution. As anticipated, the patients with active Cushing’s syndrome had significantly increased weight, BMI, % of total body fat, waist circumference, fasting glucose levels, insulin serum levels, HOMA-IR, glycated hemoglobin, C-peptide, serum lipids, CRP levels and morning basal cortisol levels (p<0.05). Significantly increased BMI, % of total body fat, waist circumference, glycated hemoglobin, C-peptide and serum lipid levels persisted after successful treatment of Cushing’s syndrome (p<0.05). Data are presented in Table 1.
mRNA expression of genes for selected mitochondrial proteins in abdominal subcutaneous adipose tissue
mRNA expression of selected genes for mitochondrial proteins was analyzed in subcutaneous adipose tissue (SCAT). The gene expression of MT-ND5, NDUFA12, SDHA, CYC1, COX4I1, DLAT and CS was significantly (p<0.05) decreased in active Cushing’s syndrome as compared to control group except for ATP50 which only tended to decrease, but the difference did not reach statistical significance. The gene expression of SDHA, CYC1, DLAT and CS persisted significantly (p<0.05) decreased even after successful treatment of Cushing’s syndrome while the expression of other genes (MT-ND5, NDUFA 12, COX4I1, ATP50) was decreased insignificantly (Figure 1). When studying the relationship between the expression of mitochondrial genes in SCAT and selected anthropometric, hormonal and biochemical parameters in the combined population of patients with Cushing’s syndrome both active and after successful treatment and control subjects, the expression of most mitochondrial genes in SCAT correlated inversely with anthropometric parameters (weight, BMI, waist circumference, % of total body fat) and surrogate measures of insulin resistance (fasting insulin, HOMA-IR) (Table 2).
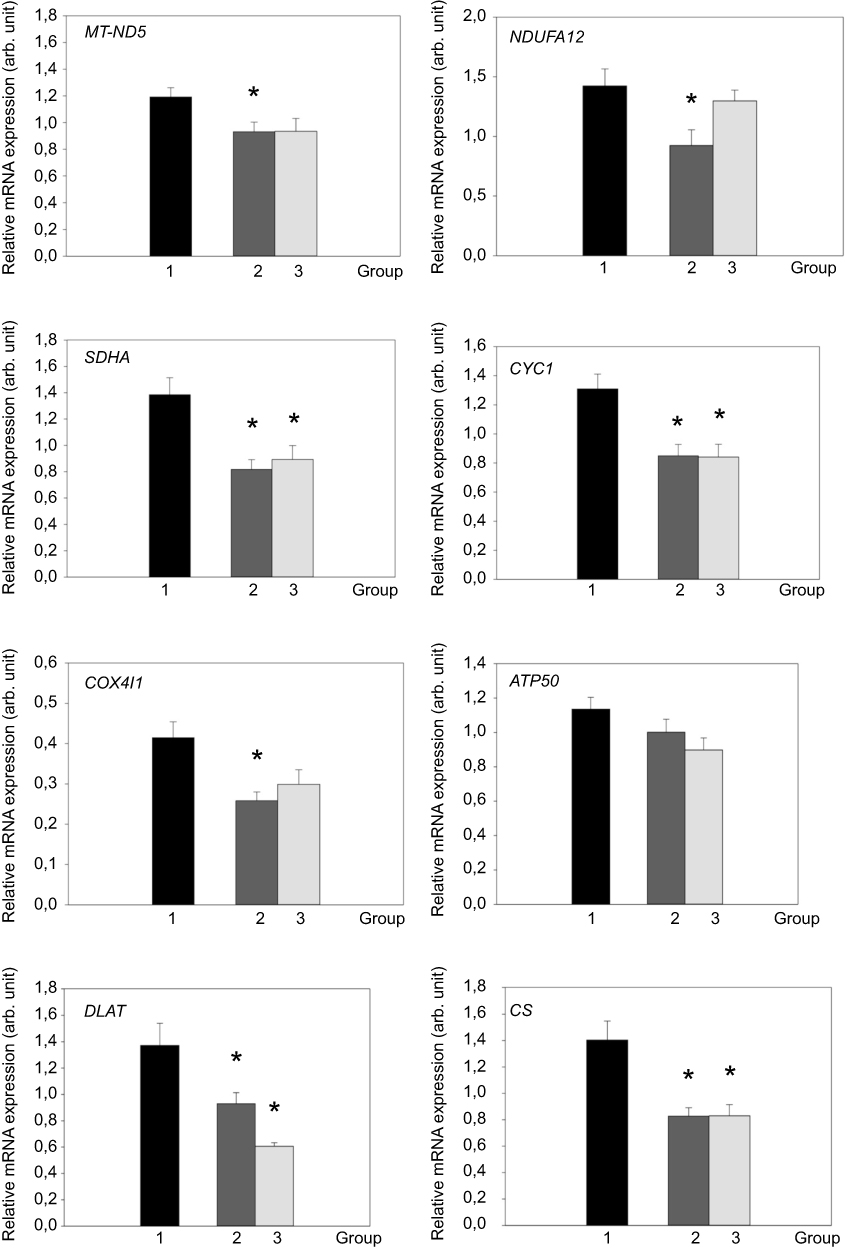 |
Figure 1 mRNA expression of genes for selected mitochondrial proteins in abdominal subcutaneous adipose tissue (SCAT) of control group (1, black bar), patients with active Cushing’s syndrome (2, dark gray bar) and Cushing’s syndrome after successful treatment (3, light gray bar). *p<0.05 vs control group. °p<0.05 vs active Cushing’s syndrome.Abbreviations: MT-ND5, mitochondrially encoded NADH dehydrogenase 5; NDUFA12, NADH:ubiquinone oxidoreductase subunit A 12; SDHA, succinate dehydrogenase subunit A; CYC1, cytochrome c1; COX4I1, cytochrome c oxidase subunit IV isoform 1; ATP50, ATP synthase peripheral stalk subunit OSCP; DLAT, dihydrolipoate-S-acetyltransferase; CS, citrate synthase; arb. unit, arbitrary unit. |
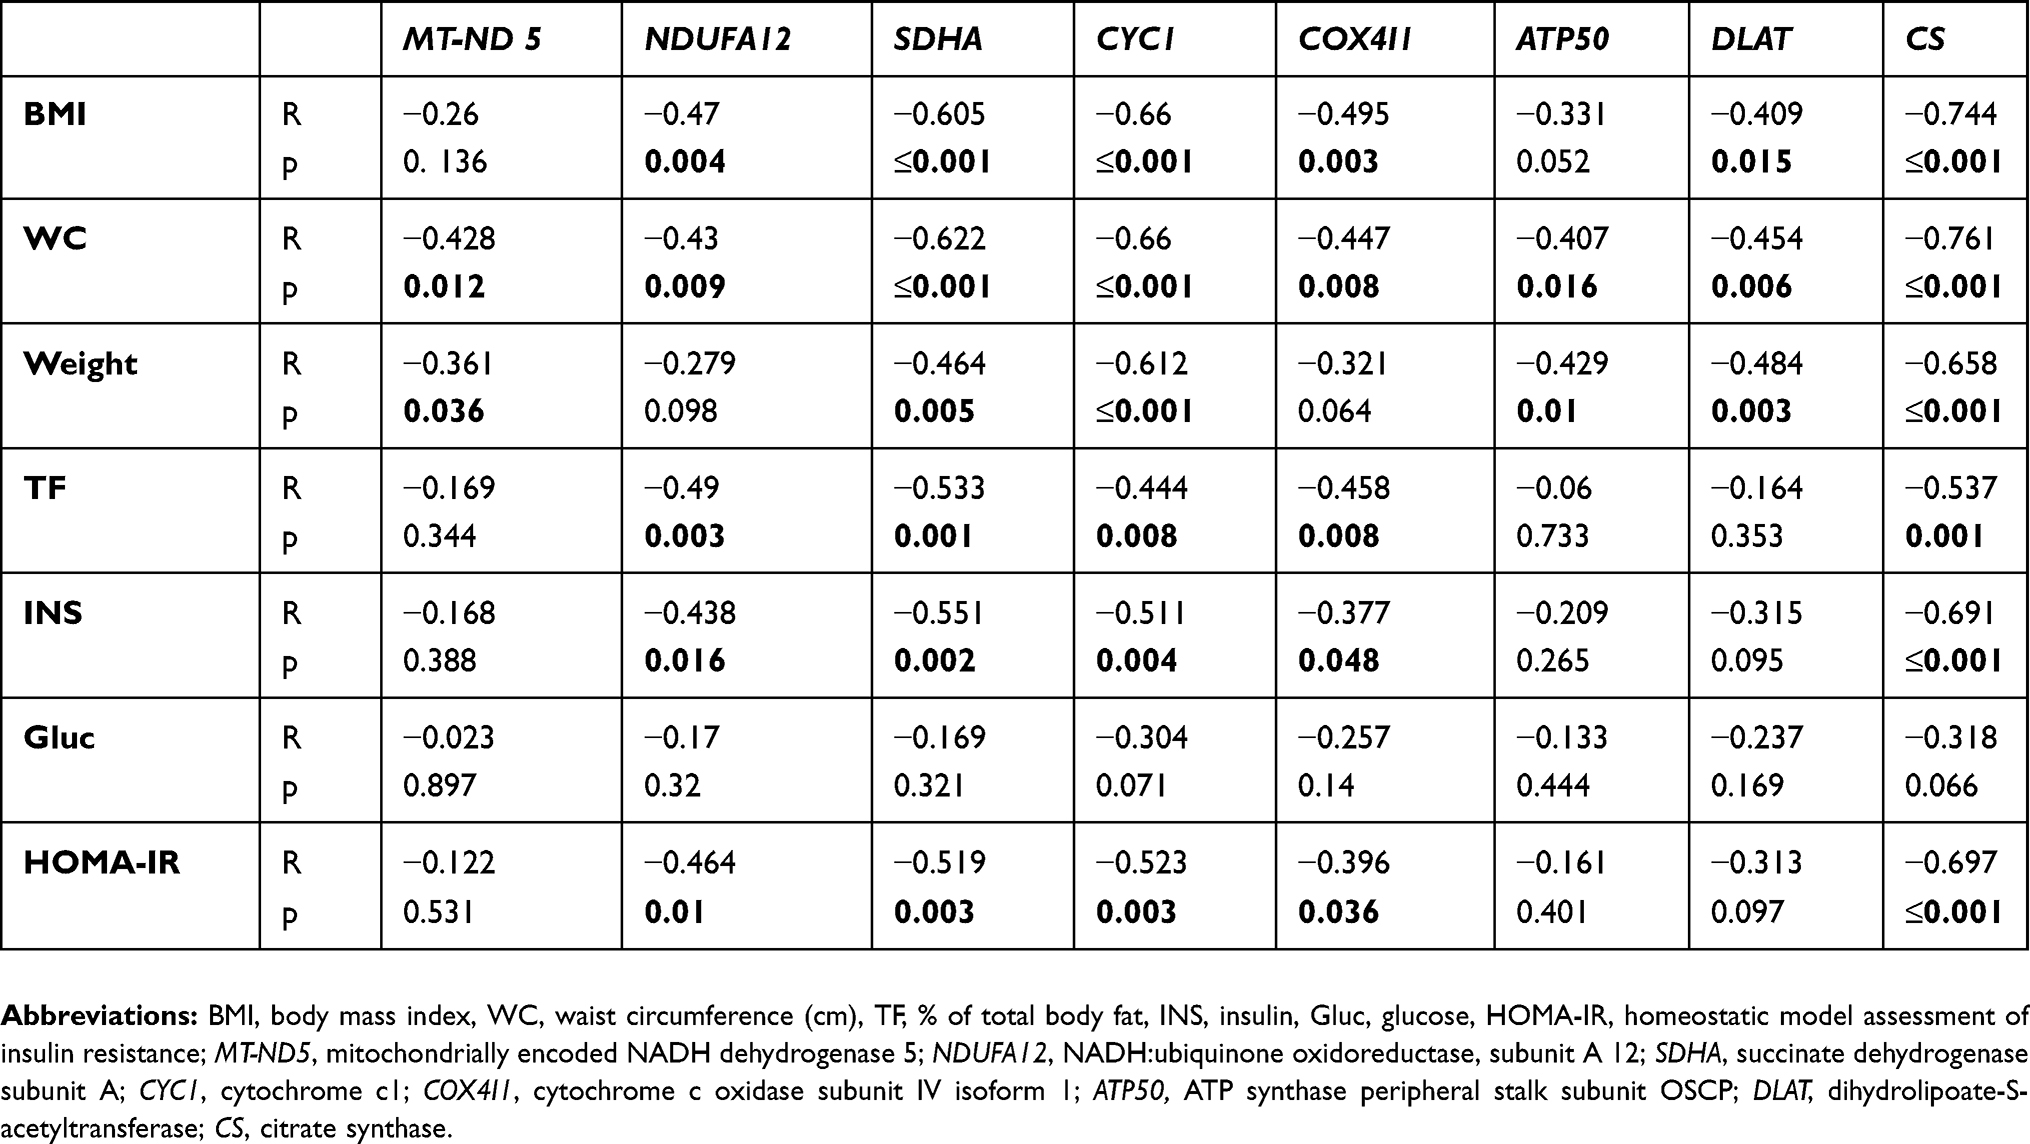 |
Table 2 Relationships of mRNA expression of selected genes for mitochondrial proteins in subcutaneous adipose tissue with other anthropometric, hormonal and biochemical parameters calculated in a combined population of the group of patients with Cushing’s syndrome and the control group (n=46) |
mRNA expression of genes for selected mitochondrial proteins in peripheral monocytes
The expression of selected respiratory chain enzymes was analyzed in peripheral monocytes. The gene expression of SDHA, CYC1, COX4I1, ATP50 and CS was significantly (p<0.05) increased in patients with active Cushing’s syndrome. The expression of these genes, except CS, decreased towards normal levels after successful treatment. On the contrary, the gene expression of MT-ND5 and NDUFA 12 tended to be lower in PM of patients with active Cushing’s syndrome and showed further decrease in patients with Cushing’s syndrome after successful treatment. The gene expression of NDUFA 12 and CS was decreased in patients with Cushing’s syndrome after successful treatment compared to patients with active Cushing’s syndrome (p<0.05). The data are shown in Figure 2. When studying the relationship between the expression of mitochondrial genes in peripheral monocytes and selected anthropometric, hormonal and biochemical parameters in the combined population of patients with Cushing’s syndrome both active and after successful treatment and control subjects, the gene expression of SDHA, COX4I1, ATP 50, DLAT, and CS positively correlated with BMI, waist circumference, percentage of total body fat, insulin levels and HOMA-IR (Table 3).
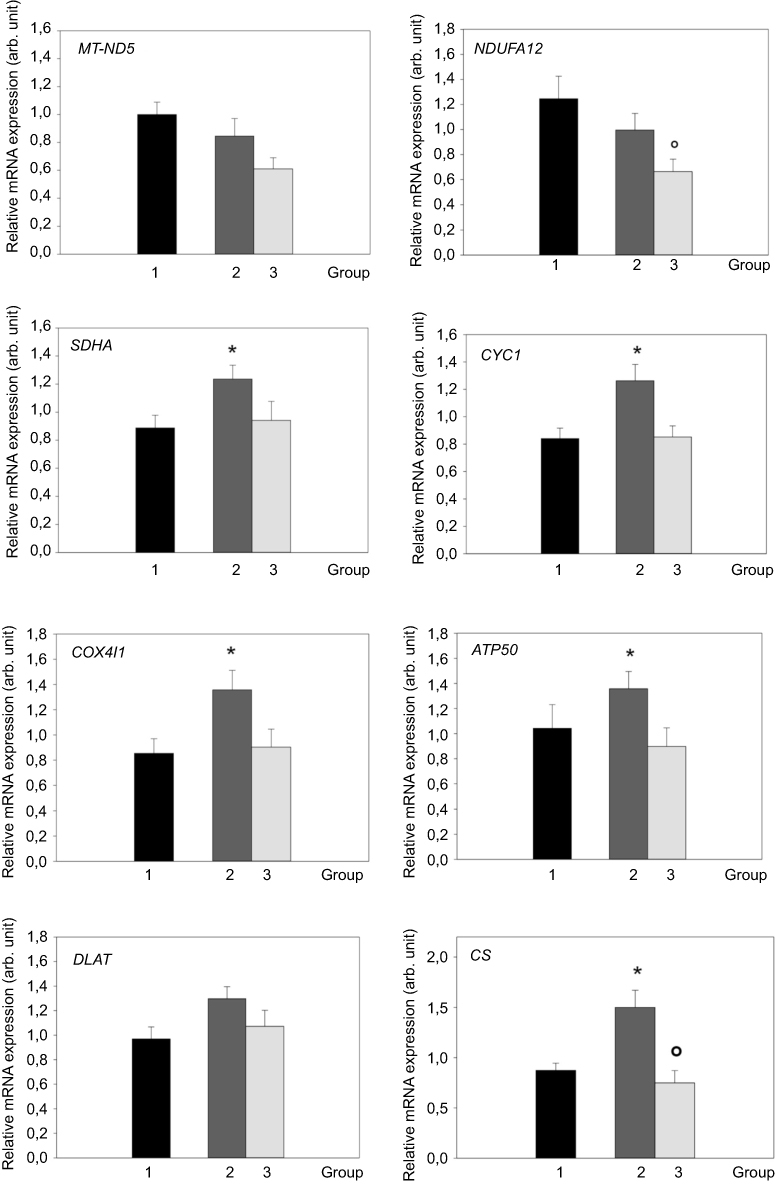 |
Figure 2 mRNA expression of genes for selected mitochondrial proteins in peripheral monocytes (PM) of control group (1, black bar), patients with active Cushing’s syndrome (2, dark gray bar) and Cushing’s syndrome after successful treatment (3, light gray bar). *p<0.05 vs control group °p<0.05 vs active Cushing’s syndrome. Abbreviations: MT-ND5, mitochondrially encoded NADH dehydrogenase 5; NDUFA12, NADH:ubiquinone oxidoreductase subunit A12; SDHA, succinate dehydrogenase subunit A; CYC1, cytochrome c1; COX4I1, cytochrome c oxidase subunit IV isoform 1; ATP50, ATP synthase peripheral stalk subunit OSCP; DLAT, dihydrolipoate-S-acetyltransferase; CS, citrate synthase; arb. unit, arbitrary unit. |
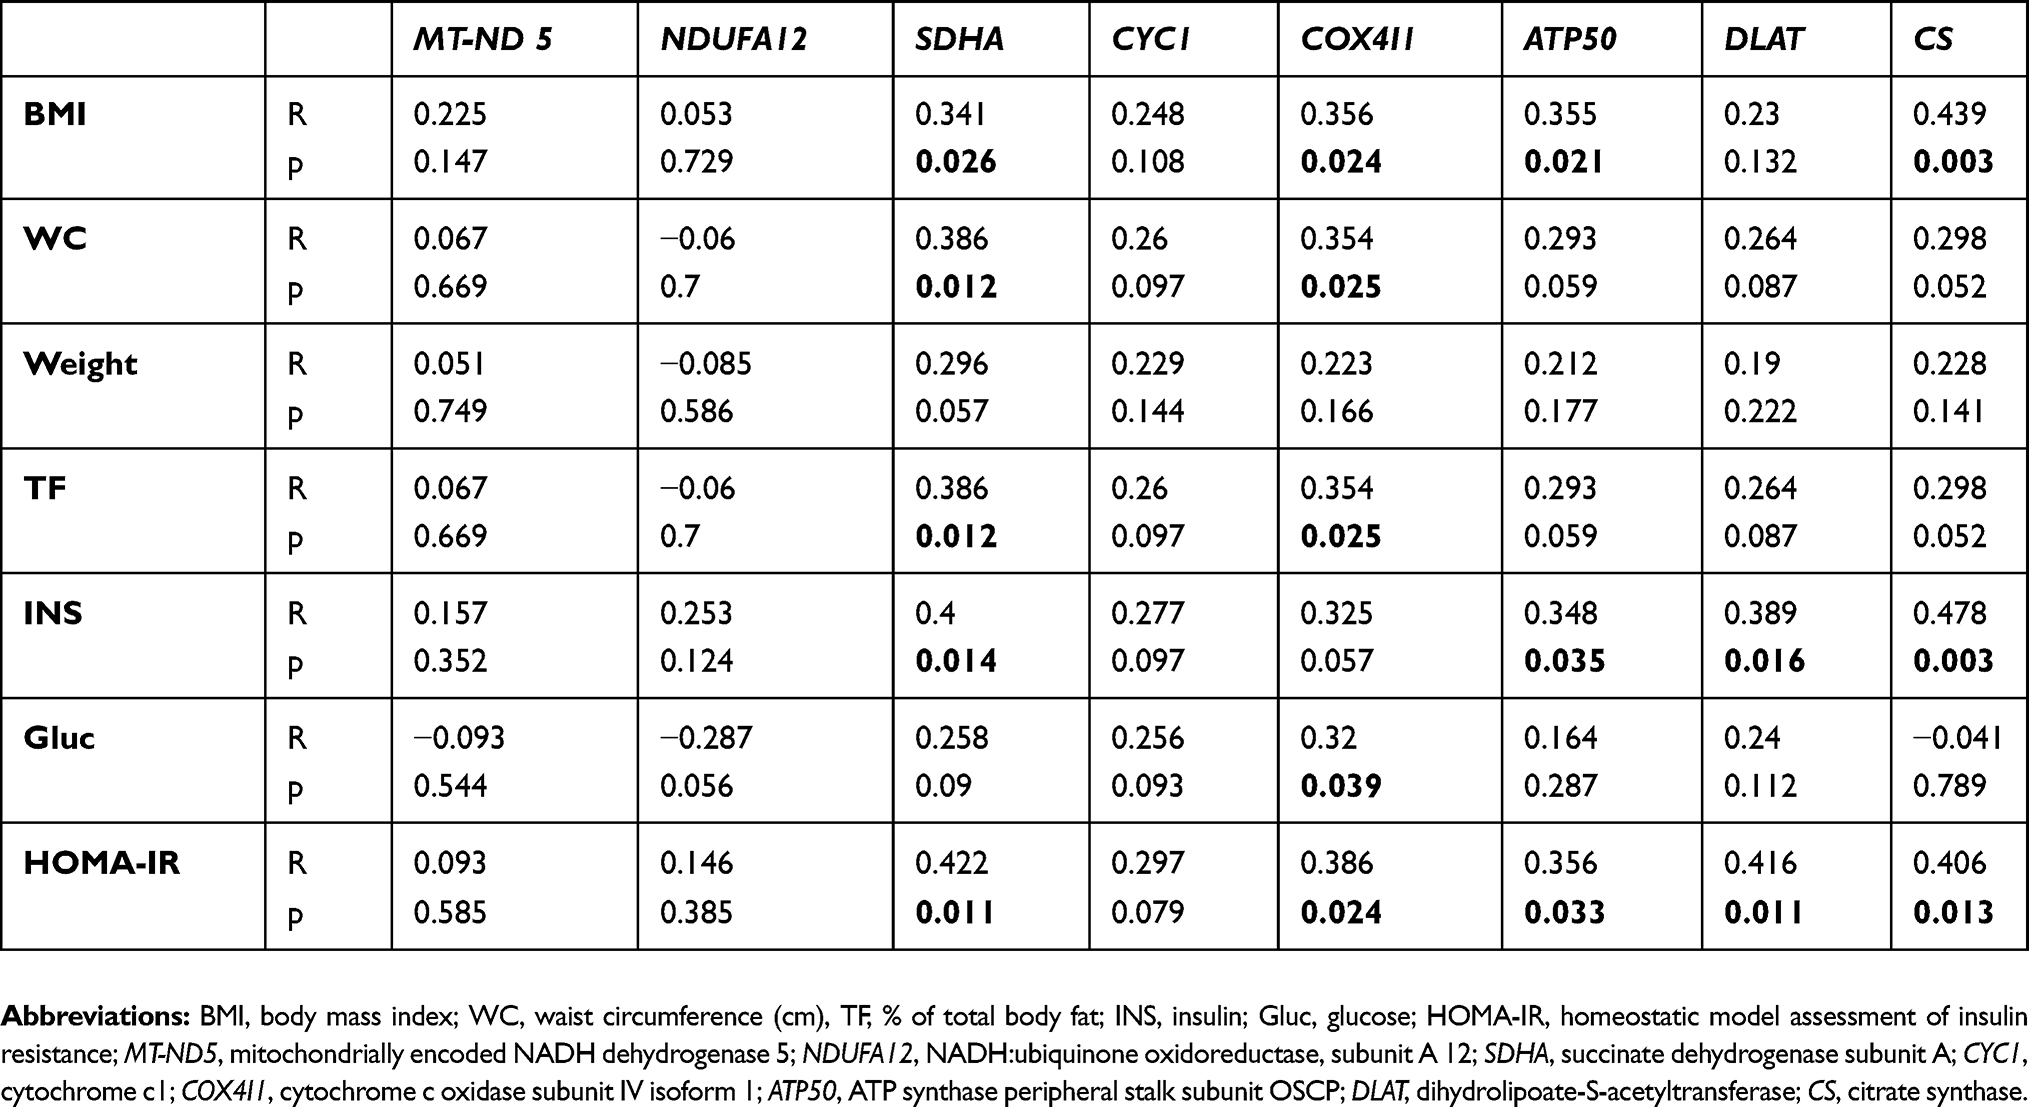 |
Table 3 Relationships of mRNA expression of selected genes for mitochondrial proteins in peripheral monocytes with other anthropometric, hormonal, and biochemical parameters calculated in a combined population of the group of patients with Cushing’s syndrome and the control group (n=46) |
Activity of mitochondrial enzymatic complexes
In addition to mRNA expression, the activity of enzymes and enzymatic complexes involved in the mitochondrial respiratory chain in platelets was measured. Only the activity of enzymatic complex 1 (NQR) was increased in patients with active Cushing’s syndrome when compared to the control group (p<0.05). The enzyme activity of complex 1 (NQR) normalized after successful treatment. The enzyme activity of SQR (complex II) was lower in patients with Cushing’s syndrome after successful treatment compared to the control group (Figure 3). When studying the relationship between enzyme activity and selected anthropometric, hormonal and biochemical parameters in the combined population of patients with Cushing’s syndrome both active and after successful treatment and control subjects, the only significant relationship found was the inverse relationship between COX activity and both body weight (p˂0.05) and fasting glucose (p˂0.05).
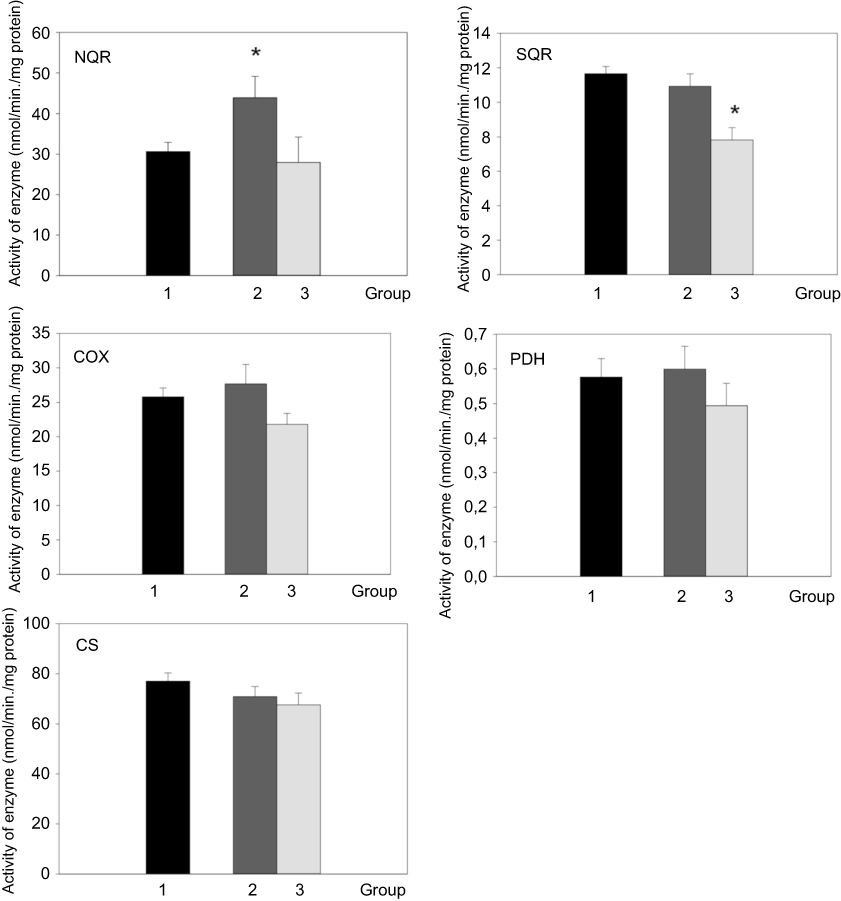 |
Figure 3 Activity of respiratory chain complexes, pyruvate dehydrogenase and citrate synthase in blood cells of control group (1, black bar), patients with active Cushing’s syndrome (2, dark gray bar) and Cushing’s syndrome after successful treatment (3, light gray bar). *p<0.05 vs control group. Abbreviations: NQR, NADH - coenzyme Q10 reductase; SQR, succinate-coenzyme Q10 reductase; COX, cytochrome c oxidase; PDH, pyruvate dehydrogenase complex; CS, citrate synthase. |
Discussion
The most important finding of our study is that patients with active Cushing’s syndrome had decreased mRNA expression of the genes MT-ND5, NDUFA12, SDHA, CYC1 and COX4I1 coding subunits of mitochondrial respiratory chain complexes, DLAT and citrate synthase in SCAT and that the decreased gene expression persisted even after successful treatment although the expression of genes MT-ND5, NDUFA12, and COX4I1 was decreased insignificantly. On the contrary, the changes of mitochondrial gene expression in circulating monocytes showed different patterns suggesting differential modulation of mitochondrial function and activity in different tissues.
Mitochondrial dysfunction is a typical feature of obesity, type 2 diabetes and metabolic syndrome.35 The changes in mitochondrial biogenesis significantly modulate adipocyte differentiation and function.36,37 During differentiation, newly developed small adipocytes preserve peak levels of metabolic activity and increased substrate consumption along with a marked increase in the mitochondrial content and higher β-oxidation.38 Preadipocyte differentiation is associated with an increase of mtDNA copy number and related induction of factors important for mitochondrial genome replication and transcription, such as the nuclear-encoded mitochondrial transcription factor A (TFAM).38,39 On the contrary, adipocyte hypertrophy present in obesity and type 2 diabetes is associated with reduction in mitochondrial mass and loss of metabolic adaptability, as well as downregulation of the expression of different components of the oxidative phosphorylation (OXPHOS) system in white adipose tissue which correlate with the level of obesity.39–41
In our study, we proved that the expression of all analyzed genes coding selected OXPHOS subunits is reduced in adipose tissue in patients with active Cushing’s syndrome as well as CS, which is considered a marker of mitochondrial mass. The mRNA expression of most of the mitochondrial genes in SCAT correlated inversely with anthropometric parameters (BMI, waist circumference, % of total body fat, weight) and HOMA-IR. The results are comparable to the results of our previously published work evaluating mitochondrial function in subjects with simple obesity and type 2 diabetes mellitus.33 Therefore, the impairment of mitochondrial function may be explained by the obesity accompanying the Cushing’s syndrome. Nevertheless, it is important to take into consideration the possible impact of hypercortisolism. It is known that glucocorticoids affect mitochondrial metabolism via both genomic and non-genomic mechanism and regulate energy metabolism by inducing nuclear and mitochondrial OXPHOS gene transcription and OXPHOS biosynthesis.42–44 Moreover, depending on the type of the target cell, glucocorticoids can act as survival or proapoptotic factors, in part due to tissue specificity of the mitochondria.45,46 One of the mechanisms in the regulation of mitochondrial functions by glucocorticoids is GR-Bcl-2 complex formation and/or translocation with Bcl-2 into mitochondria.29 In an experimental study, long-term glucocorticoid treatment resulted in decreased GR and Bcl-2 levels and a significant reduction in mitochondrial oxidation in primary cortical neurons.31
Interestingly, the impaired gene expression of SDHA, CYC1, DLAT and CS in SCAT in our study persisted even after successful treatment of Cushing’s syndrome, as did increased BMI, % of total body fat, waist circumference and serum lipids. Persistence of obesity, low-grade inflammation and higher risk of cardiovascular morbidity were previously demonstrated in patients with Cushing’s syndrome after long-term remission.20,22,47 Thus, obesity associated with low-grade inflammation probably perpetuates mitochondrial dysfunction in patients after successful treatment of Cushing’s syndrome.38,40,48
An intriguing observation in our study was that the gene expression of SDHA, CYC1, COX4I1, ATP50 and CS in peripheral monocytes of patients with active Cushing’s syndrome was increased with a tendency to decrease toward normal levels after the successful treatment. The mRNA expression of genes SDHA, COX411, ATP50 and CS positively correlated with BMI and HOMA-IR index. The gene expression of complex I subunits (MT-ND5 and NDUFA12) in patients with active Cushing’s syndrome was decreased, albeit insignificantly. Our previous study showed that simple obesity and type 2 diabetes mellitus were associated with decreased gene expression of complex I enzymes (MT-ND5 and NDUFA12) in PM while other differences in mRNA expression were not found.33 It has been reported that subunits COX I and COXIV of respiratory chain complex IV are upregulated in peripheral blood monocytes in chronic renal disease patients; however, complex IV activity is decreased.49 In mouse models of atherosclerosis, mitochondrial DNA damage of monocytes and decreased complex I and IV activity were identified.50 Mitochondrial dysfunction of peripheral monocytes was demonstrated in patients with early stage heart failure.51
In patients with Cushing’s syndrome after successful treatment, mRNA expression of studied genes follows a similar pattern as in patients with simple obesity and T2DM, ie, the decreased gene expression of complex I subunits (MT-ND5 and NDUFA 12) and CS. We can conclude that chronic hypercortisolism affects the mitochondrial function of peripheral monocytes. When an excess of glucocorticoids passes, the mitochondrial dysfunction of PM follows a similar pattern as in patients with simple obesity and T2DM probably due to persisting low grade-inflammation. However, even under the same conditions, the mitochondrial function of PM and SCAT is influenced differently. Similarly, a different pattern of the expression of genes involved in inflammatory pathways has been found in SCAT and PM after laparoscopic sleeve gastrectomy.52
When assessing the activity of respiratory chain enzymes in platelets of patients with active Cushing’s syndrome, we have found an increased enzyme activity of complex I (NQR), while the activity of the remaining respiratory enzymes did not change. The enzyme activity of SQR (complex II) was lower in patients with Cushing’s syndrome after successful treatment compared to the control group. Increased enzyme activity of respiratory chain complexes I and II was observed in a group of females with anorexia nervosa (AN) in comparison with a healthy control group. The relative activity of complex I was considerably increased.53 AN is accompanied by hypercortisolism and moreover, despite abnormally low BMI, significantly elevated inflammatory cytokines, especially TNF α, IL-1β and IL-6 were demonstrated.54 The patients with active Cushing’s syndrome and AN have some similar laboratory and hormonal features and the activity of respiratory chain enzymes in platelets is affected in a similar fashion, ie, increased enzyme activity of complex I (NQR). In our previous study, we documented the increased enzyme activity of complex I (NQR) and decreased enzyme activity of complex IV in platelets of patients with simple obesity and T2DM.33 This finding was unexpected as mitochondrial dysfunction in platelets has been documented in several pathologies including sepsis, type 2 diabetes, Alzheimer’s disease and Parkinson’s disease.55–58
The limitation of the study is that mRNA expression of selected genes for mitochondrial proteins was only analyzed in SCAT and PM of patients with Cushing’s syndrome and healthy lean subjects matched according to sex and age. mRNA expression of several genes in SCAT and PM correlated to BMI; therefore, the correlation with BMI-matched control subject would have been beneficial in order to assess the impact of obesity on the mitochondrial function.
Conclusion
Our data suggest that mitochondrial biogenesis can be modulated differently in different target tissues in patients with Cushing’s syndrome. Mitochondrial function in subcutaneous adipose tissue in patients with Cushing’s syndrome, both active and after successful treatment, is impaired. These changes could contribute to the metabolic abnormalities associated with this debilitating disorder.
Acknowledgments
This study was supported by the Ministry of Health of the Czech Republic – Conceptual Development of Research Organization (“Institute for Clinical and Experimental Medicine” (IKEM), IN 00023001 and RVO-VFN64165) and by institutional research support PROGRES Q26/LF1 and UNCE 204064 from the Charles University, the Czech Republic.
Disclosure
The authors report no conflicts of interest in this work.
References
1. Newell-Price J, Bertagna X, Grossman AB, Nieman LK. Cushing’s syndrome. Lancet. 2006;367:1605–1617. doi:10.1016/S0140-6736(06)68699-6
2. Etxabe J, Vazquez JA. Morbidity and mortality in Cushing’s disease: an epidemiological approach. Clin Endocrinol. 1994;40:479–484. doi:10.1111/j.1365-2265.1994.tb02486.x
3. Pivonello R, Faggiano A, Lombardi G, Colao A. The metabolic syndrome and cardiovascular risk in Cushing’s syndrome. Endocrinol Metab Clin North Am. 2005;34(2):327–339. doi:10.1016/j.ecl.2005.01.010
4. Krsek M, Silha JV, Jezkova J, et al. Adipokine levels in Cushing’s syndrome; elevated resistin levels in female patients with Cushing’s syndrome. Clin Endocrinol. 2004;60(3):350–357. doi:10.1111/j.1365-2265.2003.01987.x
5. Fleseriu M, Biller BM, Findling JW. for SEISMIC study investigators. Mifepristone, a glucocorticoid receptor antagonist, produces clinical and metabolic benefits in patients with Cushing’s syndrome. J Clin Endocrinol Metab. 2012;97(6):2039–2049. doi:10.1210/jc.2011-3350
6. van Raalte DH, Ouwens DM, Diamant M. Novel insights into glucocorticoid-mediated diabetogenic effects: towards expansion of therapeutic options? Eur J Clin Invest. 2009;39(2):81–93. doi:10.1111/j.1365-2362.2008.02067.x
7. Beaudry JL, Riddell MC. Effects of glucocorticoids and exercise on pancreatic β-cell function and diabetes development. Diabetes Metab Res Rev. 2012;28(7):560–573. doi:10.1002/dmrr.2310
8. Valassi E, Crespo I, Santos A, Webb SM. Clinical consequences of Cushing’s syndrome. Pituitary. 2012;15(3):319–329. doi:10.1007/s11102-012-0394-8
9. Cruz-Topete D, Cidlowski JA. One hormone, two actions: anti and pro-inflammatory effects of glucocorticoids. Neuroimmunomodulation. 2015;22(1–2):20–32. doi:10.1159/000362724
10. Wajchenberg BL, Bosco A, Martins Marone M, Levin R, Rocha M, Lerario AC. Estimation of body fat and lean tissue distribution by dual energy X-ray absorbimetry and abdominal body fat evalution by computed tomography in Cushing’s disease. J Clin Endocrinol Metab. 1995;80:2791–2794. doi:10.1210/jcem.80.9.7673425
11. Rockall AG, Sohaib SA, Evans D, et al. Computed tomography assessment of fat distribution in male and female patients with Cushing’s syndrome. Eur J Endocrinol. 2003;149:561–567.
12. Leal-Cerro A, Considine RV, Peino R, et al. Serum immunoreactive-leptin levels are increased in patients with Cushing’s syndrome. Horm Metab Res. 1996;28:711–713. doi:10.1055/s-2007-979884
13. Masuzaki H, Ogawa Y, Hosoda K, et al. Glucocorticoid regulation of leptin synthesis and secretion in humans: elevated plasma leptin levels in Cushing’s syndrome. J Clin Endocrinol Metab. 1997;82:2542–2547. doi:10.1210/jcem.82.8.4128
14. Widjaja A, Schurmeyer TH, Von Zur Muhlen A, Brabant G. Determinants of serum leptin levels in Cushing’s syndrome. J Clin Endocrinol Metab. 1998;83:600–603. doi:10.1210/jcem.83.2.4566
15. Aranda G, Lopez C, Fernandez-Ruiz R, et al. Circulatory immune cells in cushing syndrome: bystanders or active contributors to athero metabolic injury? A study of adhesion and activation of cell surface markers. Int J Endocrinol. 2017. doi:10.1155/2017/2912763
16. Hristov M, Weber C. Differential role of monocyte subset in atherosclerosis. Thromb Haemost. 2011;106(5):757–762. doi:10.1160/TH11-07-0500
17. Mosig S, Renner K, Krause S, et al. Different functions of monocytes subset in familiar hypercholesterolemia: potential function of CD 14+, CD16+ monocytes in detoxification of oxidized LDL. Faseb J. 2009;23(3):866–874. doi:10.1096/fj.08-118240
18. Belge K, Dayyani F, Horelt A, et al. The proinflammatory CD 14+, CD16+ DR++ are a major source of TNF. J Immunol. 2002;168(7):3536–3542. doi:10.4049/jimmunol.168.7.3536
19. Liu B, Dhanda A, Hirani S, et al. CD 14++, CD16+ monocytes are enriched by glucocorticoid treatment and are functionally attenuated in driving effector T cell responses. J Immunol. 2015;194(11):5150–5160. doi:10.4049/jimmunol.1402409
20. Barahona MJ, Sucunza N, Resmini E, et al. Persistent body fat mas and inflammatory marker increases after long-term cure of Cushing’s syndrome. J Clin Endocrinol Metab. 2009;94(9):3365–3371. doi:10.1210/jc.2009-0766
21. Ueland T, Kristo C, Godang K, Aukrust P, Bollerslev J. Interleukin −1 receptor antagonist is associated with fat distribution in endogenous Cushing’s syndrome: a longitudinal study. J Clin Endocrinol Metab. 2003;88:1492–1496. doi:10.1210/jc.2002-021030
22. Shah N, Ruiz HH, Zafar U, Post KD, Buettner C, Geer EB. Proinflammatory cytokines remain elevated despite long-term remission in Cushing’s disease: a prospective study. Clin Endocrinol. 2017;86(1):68–74. doi:10.1111/cen.2017.86.issue-1
23. Duchen MR. Mitochondria in health and disease: perspectives on a new mitochondrial biology. Mol Aspects Med. 2004;25(4):365–451. doi:10.1016/j.mam.2004.03.001
24. Cadenas E, Davies KJA. Mitochondrial free radical generation, oxidative stress, and aging. Free Radic Biol Med. 2000;29(3,4):222–230.
25. Indo HP, Yen HC, Nakanishi I, et al. A mitochondrial superoxide theory for oxidative stress diseases and aging. J Clin Biochem Nutr. 2015;56(1):1–7. doi:10.3164/jcbn.14-42
26. Ashrafian H, Frenneaux MP, Opie LH. Metabolic mechanism in heart failure. Circulation. 2007;116(4):434–448. doi:10.1161/CIRCULATIONAHA.107.702795
27. Nisoli E, Clementi E, Carruba MO, Moncada S. Defective mitochondrial biogenesis: a hallmark of the high cardiovascular risk in the metabolic syndrome? Circ Res. 2007;100(6):795–806. doi:10.1161/01.RES.0000259591.97107.6c
28. Wiederkehr A, Wollheim CB. Minireview: implication of mitochondria in insulin secretion and action. Endocrinology. 2006;147(6):2643–2649. doi:10.1210/en.2006-0057
29. Du J, McEwen B, Mani HK. Glucocorticoid receptors modulate mitochondrial function. Commun Integr Biol. 2009;2(4):350–352. doi:10.4161/cib.2.4.8554
30. Weber K, Brück P, Mikes Z, Küpper JH, Klingenspor M, Wiesner RJ. Glucocorticoid hormone stimulates mitochondrial biogenesis specifically in skeletal muscle. Endocrinology. 2002;143(1):177–184. doi:10.1210/endo.143.1.8600
31. Du J, Wang Y, Hunter R, et al. Dynamic regulation of mitochondrial function by glucocorticoids. Proc Nati Acad Sci U S A. 2009;106(9):3543–3548. doi:10.1073/pnas.0812671106
32. Dolezalova R, Lacinova Z, Dolinkova M, et al. Changes of endocrine function of adipose tissue in anorexia nervosa: comparison of circulating levels versus subcutaneous mRNA expression. Clin Endocrinol. 2007;67(5):674–678. doi:10.1111/j.1365-2265.2007.02944.x
33. Urbanová M, Mráz M, Ďurovcová V, et al. The effect of very-low-calorie diet on mitochondrial dysfunction in subcutaneous adipose tissue and peripheral monocyte of obese subjects with type 2 diabetes mellitus. Physiol Res. 2017;66(5):811–822.
34. Mraz M, Lacinova Z, Drapalova J, et al. The effect of very-low-calorie diet on mRNA expression of inflammation-related genes in subcutaneous adipose tissue and peripheral monocytes of obese patients with type 2 diabetes mellitus. J Clin Endocrinol Metab. 2011;96(4):E606–E613. doi:10.1210/jc.2010-1858
35. Romano AD, Greco E, Vendemiale G, Serviddio G. Bioenergetics and mitochondrial dysfunction in aging: recent insights for e therapeutic approach. Curr Pharm Des. 2014;20(18):2978–2992.
36. Villarroya J, Giralt M, Villarroyva F. Mitochondrial DNA: an up-and-coming actor in white adipose tissue pathophysiology. Obesity. 2009;17(10):1814–1820. doi:10.1038/oby.2009.152
37. Kusminski CM, Scherer PE. Mitochondrial dysfunction in white adipose tissue. Trends Endocrinol Metab. 2012;23(9):435–443. doi:10.1016/j.tem.2012.06.004
38. Bogacka I, Ukropcova B, Mc Neil M, Gmible J, Smith SR. Structural and functional consequences of mitochondrial biogenesis in human adipocytes in vitro. J Clin Endocrinol Metab. 2005;90(12):6650–6656. doi:10.1210/jc.2005-1024
39. Kaaman M, Sparks LM, van Harmelen V, et al. Strong association between mitochondrial DNA copy number and lipogenesis in human white adipose tissue. Diabetologia. 2007;50:2526–2533. doi:10.1007/s00125-007-0818-6
40. Wilson-Fritch L, Burkart A, Bell G, et al. Mitochondrial biogenesis and remodeling during adipogenesis and in response to the insulin sensitizer rosiglitazone. Mol Cell Biol. 2003;23(3):1085–1094. doi:10.1128/mcb.23.15.5376-5387.2003
41. De Pauw A, Tejerina S, Raes M, Keijer J, Arnould T. Mitochondrial (dys) function in adipocyte (de) differentiation and systematic metabolic alterations. Am J Path. 2009;175(3):927–939. doi:10.2353/ajpath.2009.090372
42. Demoniacos C, Djordjevic MR, Tsawdaroglou N, Sekeris CE. The mitochondrion as a primary site of action of glucocorticoids: the interaction of the glucocorticoids receptor with mitochondrial DNA sequences showing partial similarity to the nuclear glucocorticoid responsive elements. J Steroid Biochem Mol Biol. 1995;55(1):43–55.
43. Scheller K, Seibel P, Sekeris CE. Glucocorticoid and thyroid hormone receptors in mitochondria of animal cells. Int Rev Cytol. 2003;222:1–61.
44. Psara A-M, Sekeris CE. Glucocorticoid receptors and other nuclear transcription factors in mitochondria and possible functions. Biochim Biophys Acta. 2009;1787(5):431–436. doi:10.1016/j.bbabio.2008.11.011
45. Mootha VK, Bunkenborg J, Olsen JV, et al. Integrated analysis of protein composition, tissue diversity, and gene regulation in mouse mitochondria. Cell. 2003;115(5):629–640. doi:10.1016/s0092-8674(03)00926-7
46. Johnson DT, Harris RA, French S, et al. Tissue heterogeneity of the mammalian mitochondrial proteome. Am J Physiol Cell Physiol. 2007;292(2):C689–C697. doi:10.1152/ajpcell.00108.2006
47. Colao A, Pivonelo R, Spiezia S, et al. Persistence of increased cardiovascular risk in patients with Cushing’s disease after five years of successful cure. J Clin Endocrinol Metab. 1999;84(8):2664–2672.
48. Lu RH, Ji H, Chang ZG, Su SS, Yang GS. Mitochondrial development and the influence of its dysfunction during rat adipocyte differentiation. Mol Biol Rep. 2010;37(5):2173–2182. doi:10.1007/s11033-009-9695-z
49. Granata S, Zaza G, Simone S, et al. Mitochondrial dysregulation and oxidative stress in patients with chronic kidney disease. BMC Genomics. 2009;10:388. doi:10.1186/1471-2164-10-388
50. Yu E, Calvert PA, Mercer JR, et al. Mitochondrial DNA damage can promote atherosclerosis independently of reactive oxygen species through effects on smooth muscle cells and monocytes and correlates with higher-risk plaques in humans. Circulation. 2013;128(7):702–712. doi:10.1161/CIRCULATIONAHA.113.002271
51. Li P, Wang B, Sun F, et al. Mitochondrial respiratory dysfunction of blood mononuclear cells links with cardiac disturbance in patients with early- stage heart failure. Sci Rep. 2015;5:10229. doi:10.1038/srep10229
52. Trachta P, Dostálová I, Haluzíková D, et al. Laparoscopic sleeve gastrectomy ameliorates mRNA expression of inflammation-related genes in subcutaneous adipose tissue but not in peripheral monocytes of obese patients. Mol Cell Endocrinol. 2014;383(1–2):96–102. doi:10.1016/j.mce.2013.11.013
53. Böhm M, Papezova H, Hansikova H, Wenchich L, Zeman J. Activities of respiratory chain complexes in isolated platelets in females with anorexia nervosa. Int J Eat Disorders. 2007;40(7):659–663. doi:10.1002/eat.20403
54. Solmi M, Veronese N, Favaro A, et al. Inflammatory cytokines and anorexia nervosa – a meta-analysis of cross-sectional and longitudinal studies. Psychoneuroendocrinology. 2015;51:237–252. doi:10.1016/j.psyneuen.2014.09.031
55. Burkhardt C, Kelly JP, Lim YH, Filley CM, Parker WD
56. Guo X, Wu J, Du J, Ran J, Xu J. Platelets of Type 2 diabetic patients are characterized by high ATP content and low mitochondrial membrane potential. Platelets. 2009;20(8):588–593. doi:10.3109/09537100903288422
57. Bosetti F, Brizzi F, Barogi S, et al. Cytochrome c oxidase and mitochondrial F1F0-ATPase (ATP synthase) activities in platelets and brain from patients with Alzheimer’s disease. Neurobiol Aging. 2002;23(3):371–376. doi:10.1016/S0197-4580(01)00314-1
58. Krige D, Carroll MT, Cooper JM, Marsden CD, Schapira AH. Platelet mitochondrial function in Parkinson’s disease. The royal kings and queens parkinson disease research group. Ann Neurol. 1992;32(6):782–788. doi:10.1002/ana.410320612
 © 2019 The Author(s). This work is published and licensed by Dove Medical Press Limited. The
full terms of this license are available at https://www.dovepress.com/terms
and incorporate the Creative Commons Attribution
- Non Commercial (unported, 3.0) License.
By accessing the work you hereby accept the Terms. Non-commercial uses of the work are permitted
without any further permission from Dove Medical Press Limited, provided the work is properly
attributed. For permission for commercial use of this work, please see paragraphs 4.2 and 5 of our Terms.
© 2019 The Author(s). This work is published and licensed by Dove Medical Press Limited. The
full terms of this license are available at https://www.dovepress.com/terms
and incorporate the Creative Commons Attribution
- Non Commercial (unported, 3.0) License.
By accessing the work you hereby accept the Terms. Non-commercial uses of the work are permitted
without any further permission from Dove Medical Press Limited, provided the work is properly
attributed. For permission for commercial use of this work, please see paragraphs 4.2 and 5 of our Terms.