Back to Journals » Diabetes, Metabolic Syndrome and Obesity » Volume 15
The Relationship Between Triglyceride Glucose Index and Vitamin D in Type 2 Diabetes Mellitus
Authors Jia Y, Song T, Li Z, Zhou L, Chen S
Received 18 November 2021
Accepted for publication 4 February 2022
Published 19 February 2022 Volume 2022:15 Pages 511—525
DOI https://doi.org/10.2147/DMSO.S348845
Checked for plagiarism Yes
Review by Single anonymous peer review
Peer reviewer comments 2
Editor who approved publication: Prof. Dr. Juei-Tang Cheng
Yujiao Jia,1,2 Tiantian Song,3 Zelin Li,1,2 Linling Zhou,1,2 Shuchun Chen1,2,4
1Graduate School of Hebei Medical University, Shijiazhuang, Hebei, People’s Republic of China; 2Department of Endocrinology, Hebei General Hospital, Shijiazhuang, Hebei, People’s Republic of China; 3Shijiazhuang Second Hospital, Shijiazhuang, Hebei, People’s Republic of China; 4Hebei Key Laboratory of Metabolic Diseases, Shijiazhuang, Hebei, People’s Republic of China
Correspondence: Shuchun Chen, Department of Endocrinology, Hebei General Hospital, 348 Heping West Road, Shijiazhuang, Hebei, 050051, People’s Republic of China, Tel/Fax +86 31185988406, Email [email protected]
Purpose: The study aimed to investigate the relationship between 25-hydroxyvitamin D [25(OH) D] and triglyceride glucose index (TyG) levels in male and female patients with type 2 diabetes mellitus (T2DM).
Patients and Methods: This cross-sectional study recruited 592 patients with type 2 diabetes. The subjects were divided into the non-vitamin D deficiency group [25(OH)D≥ 20ng/mL] and the vitamin D deficiency group [25(OH)D< 20ng/mL]. The triglyceride glucose (TyG) index is calculated using the following formula, ln[fasting triglycerides (mg/dL)*fasting blood glucose (mg/dL)/2]. Participants were divided into high TyG group and low TyG group, with the median of TyG as the boundary. All participants were divided into male and female groups and normal Body mass index (BMI) and high BMI groups, and then divided into high TyG group and low TyG group.
Results: We found that TyG levels are independently and negatively correlated with vitamin D levels in male patients with T2DM. In the female group, there was no significant correlation between TyG and vitamin D levels, regardless of an adjusted or unadjusted confounding factor. Subgroup analysis showed that the correlation between TyG and the risk of vitamin D deficiency in the normal BMI group was significantly stronger than that in the high BMI group.
Conclusion: This study indicates that vitamin D deficiency is related to high TyG level in patients with T2DM for males, and this relationship is not significant for female patients. The risk of vitamin D deficiency is significantly correlated with high TyG level in normal BMI group. However, there was no statistically significant difference between TyG level and the risk of vitamin D deficiency in the high BMI group. Difference between TyG level and the risk of vitamin D deficiency.
Keywords: diabetes mellitus, type 2 diabetes, vitamin D, triglyceride glucose index
Introduction
Vitamin D is a steroid and occurs mainly in two forms, vitamin D2 (ergocalciferol) and vitamin D3 (cholecalciferol). Vitamin D2 is synthesized by plants, fungi, and yeast from ergosterol via UVB, while vitamin D3 is produced by ultraviolet B radiation (UVB, 290–320 nm) in the skin, converted from 7-dehydrocholesterol to cholecalciferol or provided by food.1 In recent decades, with the discovery of vitamin D receptor (VDR) in many tissues, the effects of vitamin D unrelated to regulation of calcium metabolism has become more obvious, and its biological function has been increasingly recognized. Studies have shown that vitamin D can regulate cell proliferation, differentiation, and immune regulation,2 further regulating calcium balance and improving bone health in the body. In addition, several preclinical and clinical studies have reported that vitamin D deficiency is involved in the pathogenesis of many diseases, such as cancer, diabetes, hypertension, cardiovascular, autoimmune and skin diseases.3 From another perspective, vitamin D deficiency becomes a worldwide health problem linked to the development of many diseases, such as diabetes and cardiovascular diseases.
The molecular mechanism of vitamin D is involved in insulin secretion and signal transduction, affecting blood glucose control and insulin sensitivity.4 From another perspective, vitamin D is associated with glucose homeostasis in type 2 diabetes mellitus (T2DM) patients, and vitamin D levels were negatively related to diabetic complications.5 Studies further approved that vitamin D is independently associated with insulin resistance (IR) in patients with T2DM,6,7 which may imply that vitamin D is related to the triglyceride-glucose (TyG) index in patients with T2DM.
The TyG index, calculated by the formula ln[fasting triglycerides (mg/dL)*fasting blood glucose (mg/dL)/2], is a new marker that measures IR in patients with diabetes.8 Therefore, the TyG index could be obtained by calculations. It is essential to find a biomarker that can predict the prognosis and provide treatment guidelines for patients with T2DM.9 Previous studies have shown that the TyG index may have the most vital predictive value in Metabolic syndrome (MetS) development over a 5-year period.10 However, there is currently no data about the relationship between TyG and vitamin D in T2DM patients. Given the importance of vitamin D, this study aims to explore (1) the relationship between TyG and vitamin D in patients with T2DM, and how does this relationship varies in males and females; (2) whether TyG is an independent factor for vitamin D levels.
Materials and Methods
Study Population
The study was a hospital-based cross-sectional study conducted in the Department of Endocrinology, Hebei General Hospital, from December 2018 to December 2019. The total number of participants was 592. All participants were diabetic patients who met WHO diagnostic criteria for diabetes in 1999. Participants did not include patients with type 1 diabetes or complications of acute diabetes, pregnant women, patients with hepatic or renal insufficiency or malignancy or thyroid disease or hyperparathyroidism, and patients taking medications that may affect vitamin D level. The Ethics Committee approved the protocol of this study of Hebei General Hospital, and it was following the Declaration of Helsinki. Enrolled participants have signed informed consent forms, and the objectives were explained. We keep participants’ information confidential (Figure 1).
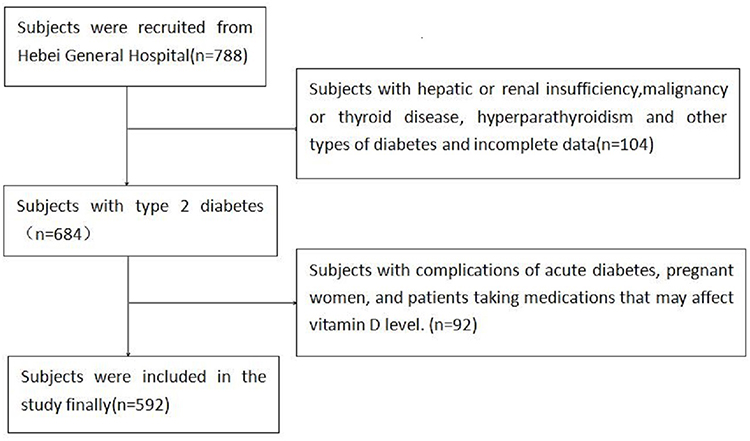 |
Figure 1 Flow diagram of recruitment. |
Information and Data Collection
All participants completed a questionnaire to collect basic information, including gender, age, menopausal status, medical history, smoking history, and alcohol consumption history. Systolic blood pressure (SBP), diastolic blood pressure (DBP) were measured twice by professionals, and the average value was recorded. Body mass index (BMI) was calculated twice by measuring height and weight, and the average values were calculated. All participants fasted overnight, and the blood was drawn in the next morning. All blood biomarkers were tested in the same laboratory. The study measured the levels of fasting blood glucose (FBG), glycosylated hemoglobin (HbA1c), 25-hydroxyvitamin D, albumin, total cholesterol (TC), triglyceride (TG), high-density lipoprotein cholesterol (HDL), low-density lipoprotein cholesterol (LDL), alanine aminotransferase (ALT), aspartate aminotransferase (AST), urea nitrogen (BUN), creatinine (Scr) and uric acid (UA). 25-Hydroxyvitamin D3 was measured by electrochemiluminescence method by laboratory physicians in the Department of Nuclear Medicine, Hebei General Hospital. The TyG index was calculated using the formula ln [fasting TGs (mg/dL)×FBG (mg/dL)/2].11
Statistical Analysis
The study adopted a cross-sectional method and used Statistical Product and Service Solutions 24.0 (SPSS 24) to analyze data. The measurement data were tested for normality. The data that conformed to the normal distribution were expressed as the mean ± standard error, and the data that did not conform to the normal distribution were expressed as the median (interquartile range), as percentages for categorical variables. Comparisons between the two groups were carried out using the Student’s t-test or Mann–Whitney U-test. χ2 test was employed to compare categorical variables. After comparisons, several factors were selected on the basis of P<0.1 and the clinical background. The study used Ordinal regression analysis to examine the relationship between 25(OH)D and the TyG index. Different models (model 1, 2, 3, and 4) had adjustment for different confounding factors. The results are shown as odds ratios (ORs) and 95% confidence intervals (CIs). Statistical significance was defined by a P-value <0.05.
Results
Clinical Characteristics of T2DM Participants with and without Vitamin D Deficiency
Participants include 374 men and 218 women, aged 58.4±4 years, with a median T2DM disease duration of 10 years (interquartile range 3–16 years). 68.3% (404/591) of patients with T2DM were identified with vitamin D deficiency. Table 1 shows the group participant characteristics (non‐vitamin D deficiency and vitamin D deficiency). Compared with the patients without vitamin D deficiency, the proportion of men in the vitamin D deficiency group was relatively low (P<0.05). The levels of creatinine and albumin was significantly decreased in the vitamin D deficiency group compared with the non‐vitamin D deficiency group (P<0.05, respectively), whereas the HAb1c, fasting blood glucose levels, systolic blood pressure and uric acid were significantly increased (P<0.05). Similarly, the insulin resistance in patients with vitamin D deficiency was more severe, revealing by the TyG index (P=0.009) (Figure 2); however, there was no significant difference in age, BMI, and DM duration between groups. In addition, the application of metformin, GLP-1, insulin, and lowering drugs in the vitamin D deficiency group was equivalent to that in non-vitamin D deficiency.
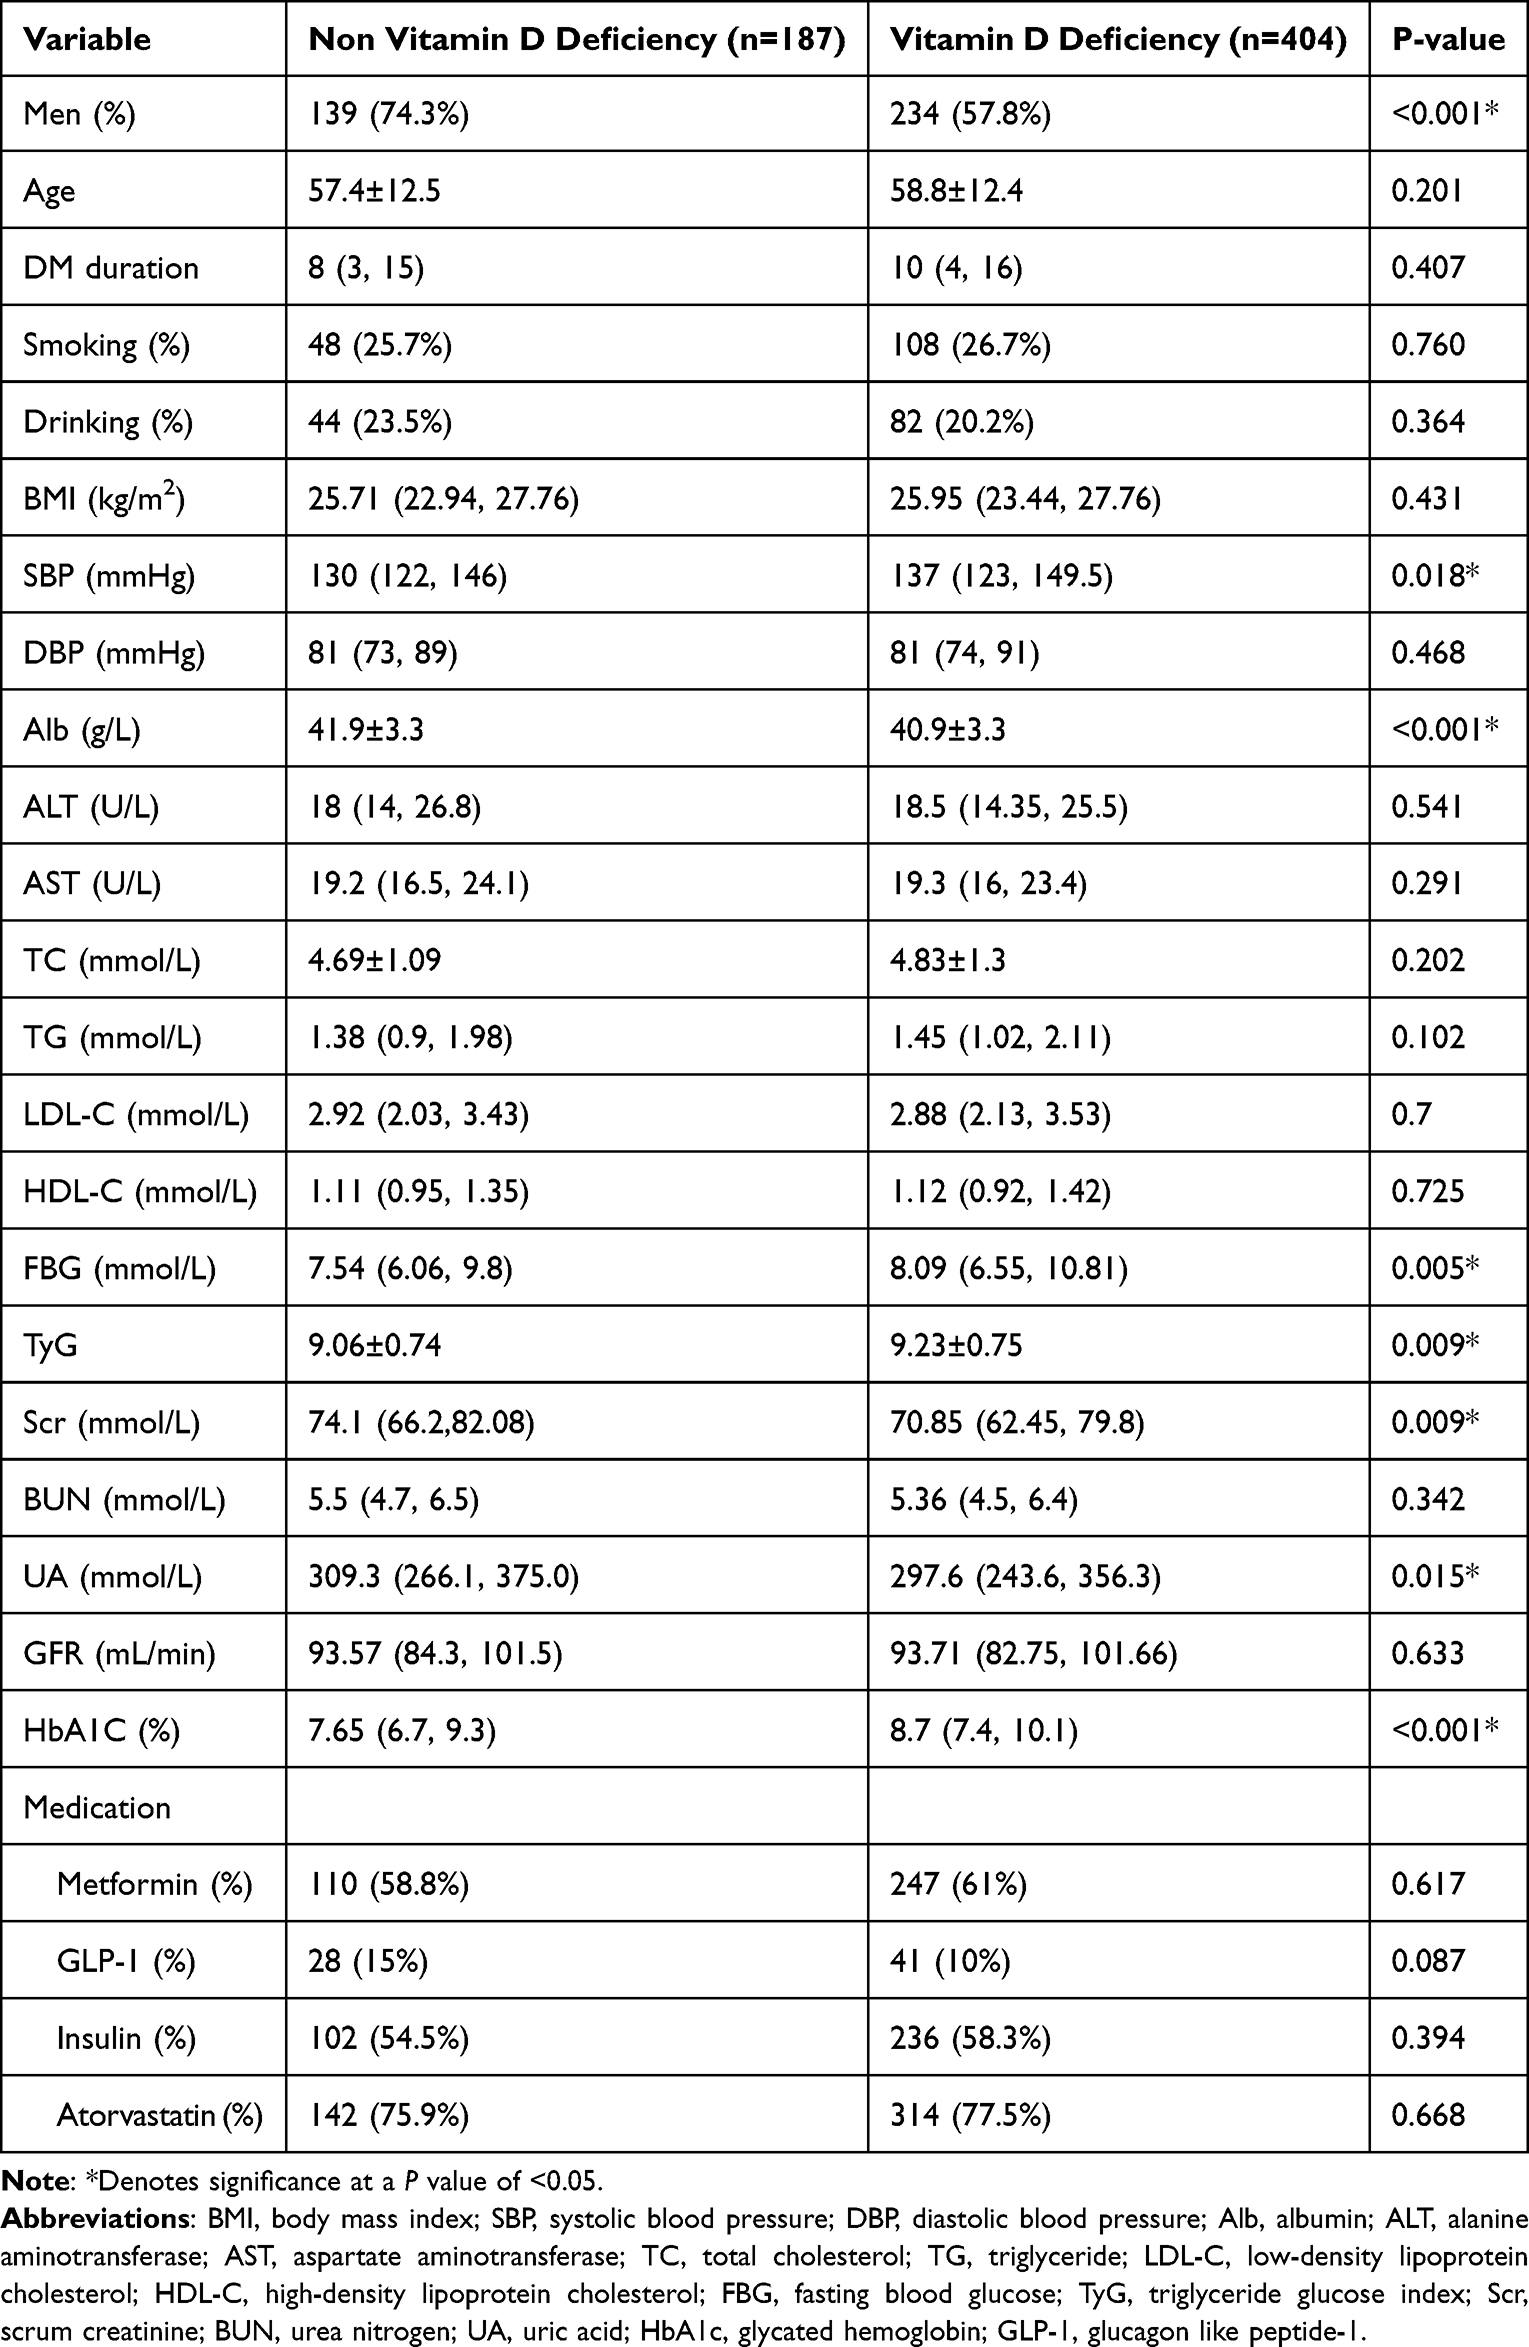 |
Table 1 Clinical Characteristics of All Patients with T2DM with and without Vitamin D Deficiency |
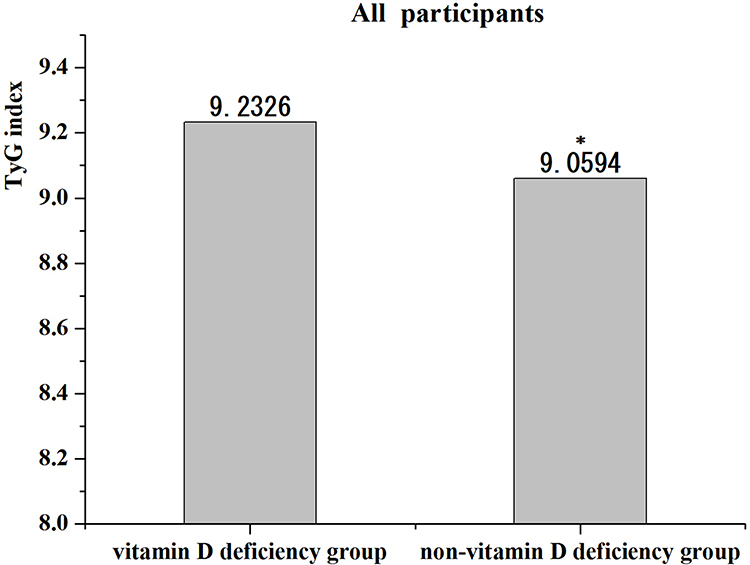 |
Figure 2 Comparisons of TyG index in Non- vitamin D deficiency group and Vitamin D deficiency group in all participants. *Denotes significance at a P value of <0.05. |
Clinical Characteristics of Participants with T2DM in the Low-TyG Group and High-TyG Group
Patients in the low TyG group were older than those in the high TyG group (P=0.008). Compared with patients with low TyG levels, patients with high TyG levels had significantly higher BMI (P<0.001), smoking rate (P=0.003), systolic blood pressure (P=0.039), and diastolic blood pressure (P<0.001). However, there was no significant difference in sex ratio, duration of diabetes, and drinking rate between the two groups. The prevalence of vitamin D deficiency in the high TyG group was higher than that in the low TyG group (P<0.017), and the level of vitamin D in the high TyG group decreased significantly (P<0.018). The albumin, alanine aminotransferase, triglyceride, total cholesterol, low-density lipoprotein, FBG, HAb1c, and glomerular filtration rate were significantly increased for the high TyG group compared to low TyG group (P<0.05), while the levels of high-density lipoprotein and vitamin D were significantly decreased (P<0.001) (Table 2). There is no significant difference in the use of statins between the two groups. Figure 3 shows the difference in the prevalence of vitamin D deficiency and the 25(OH)D level between the high TyG group and the low TyG group.
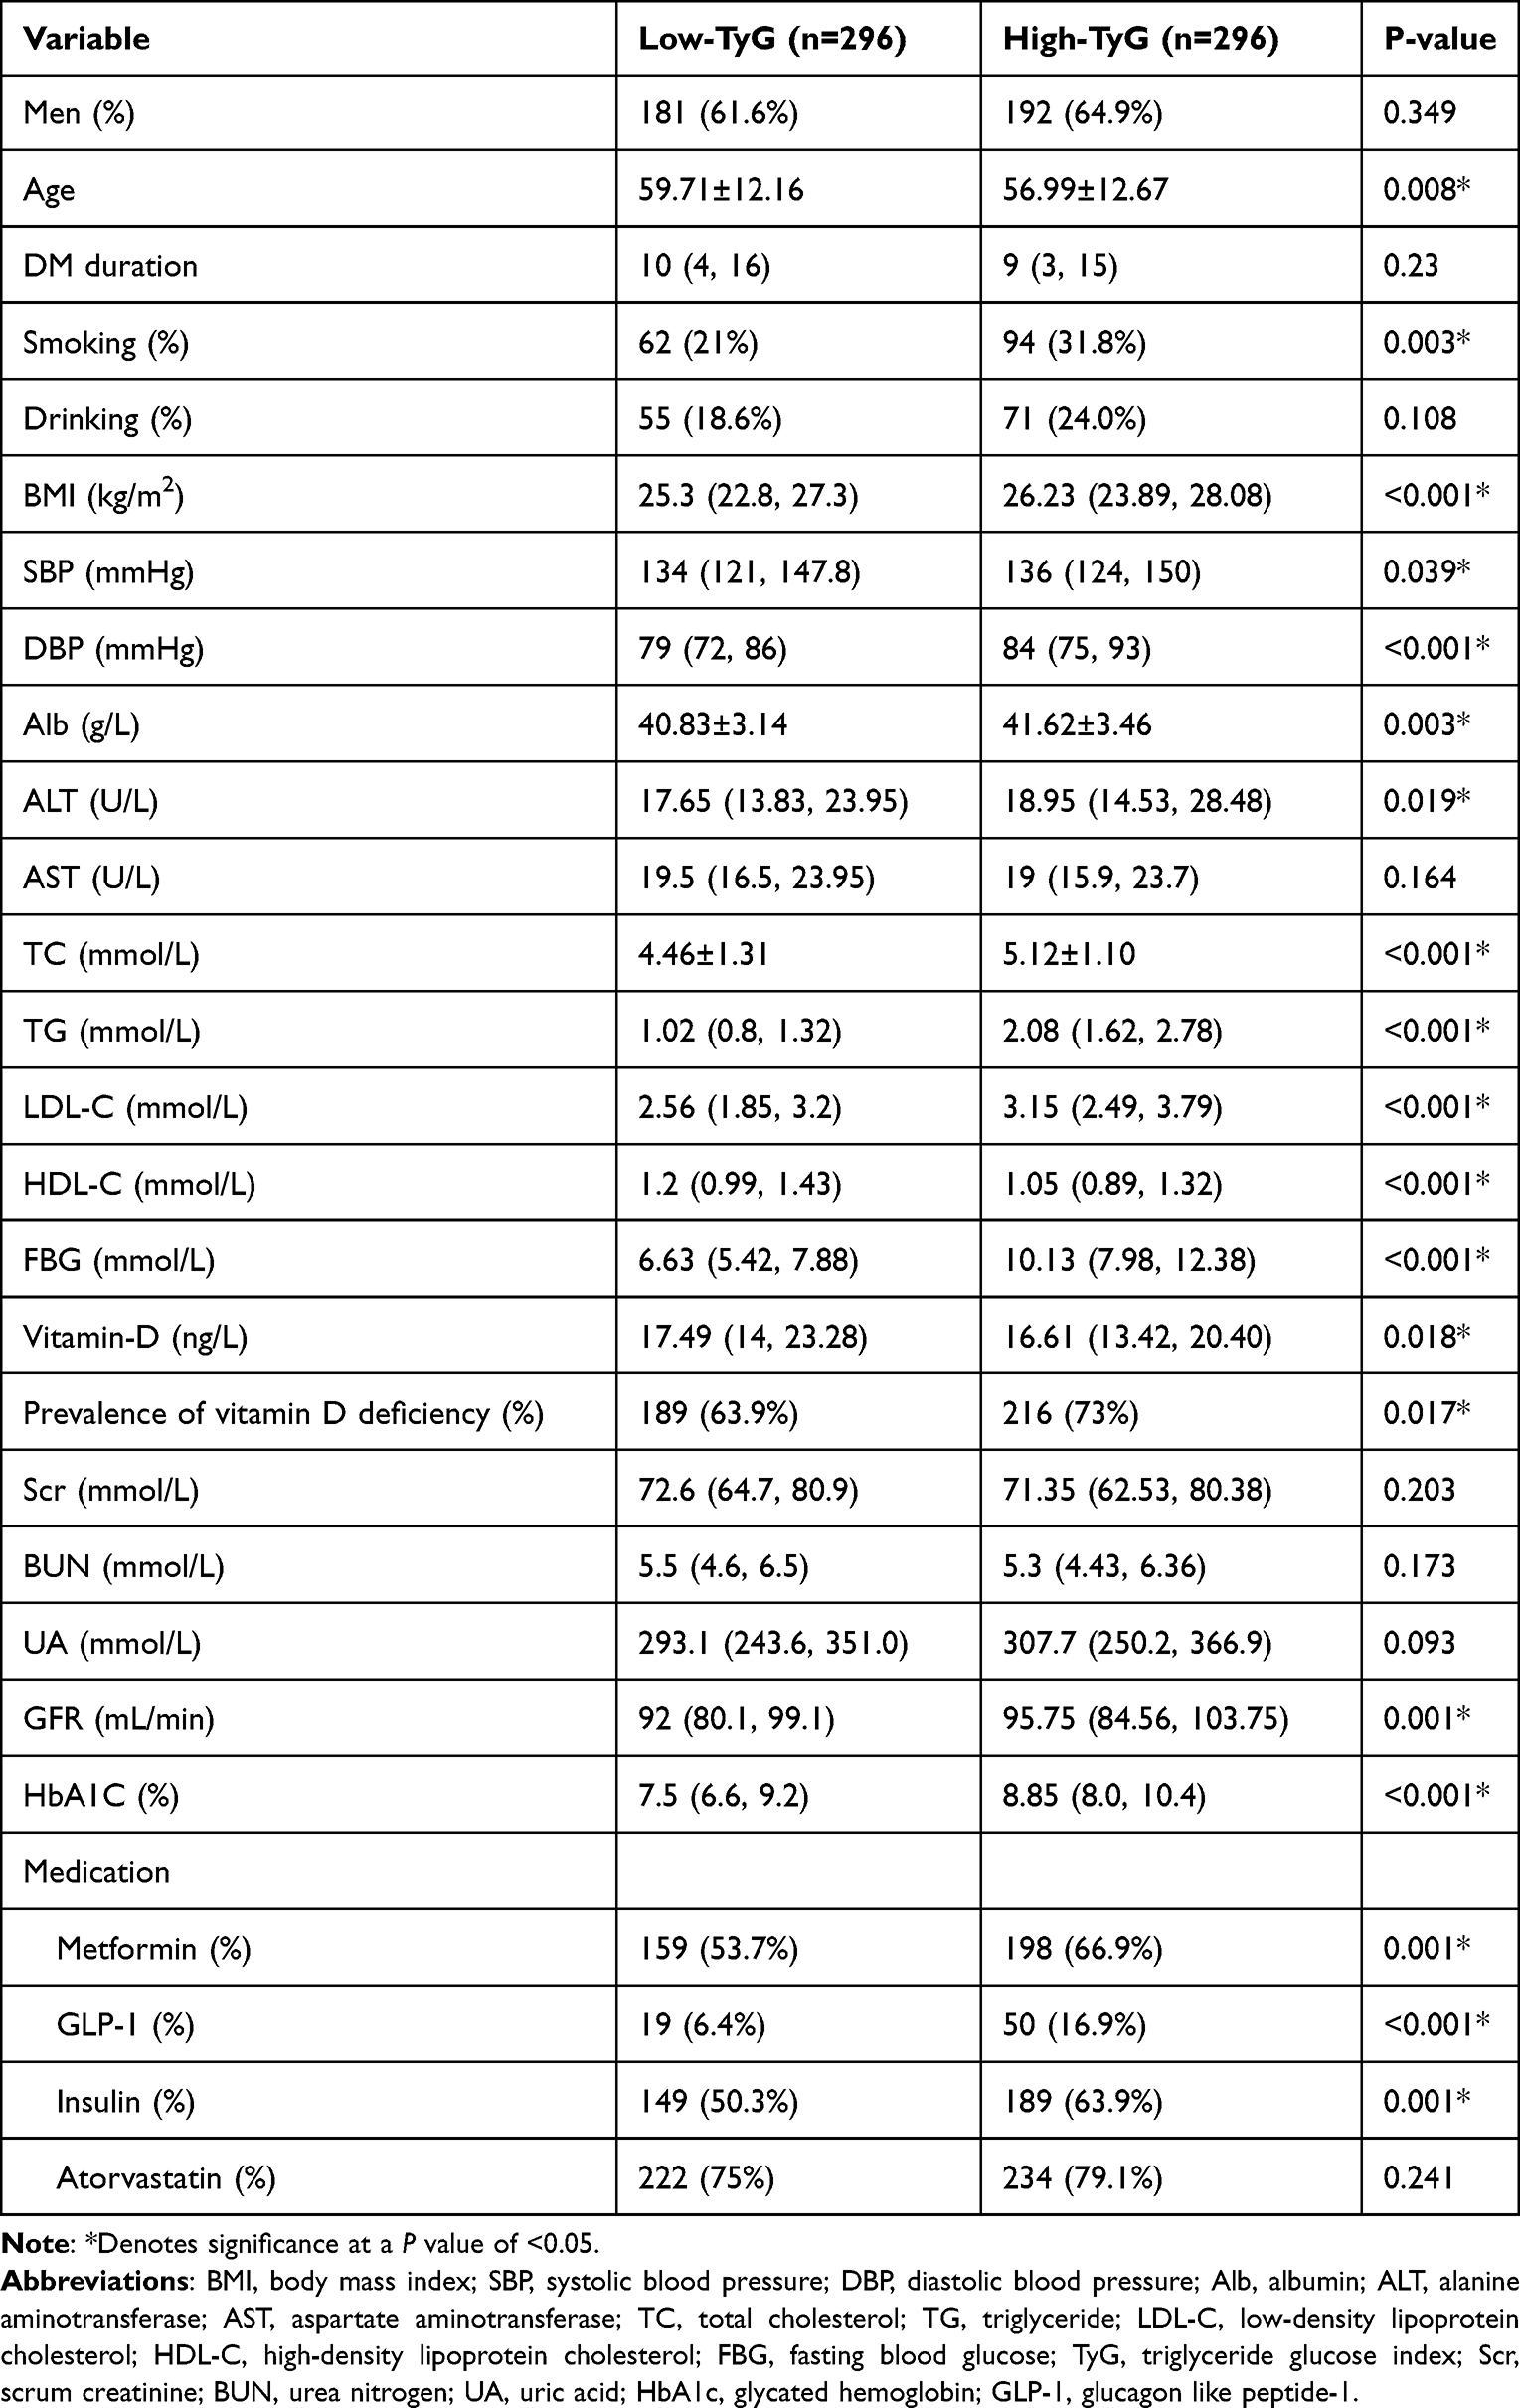 |
Table 2 Clinical Characteristics of All Patients with T2DM in the Low-TyG Group and High-TyG Group |
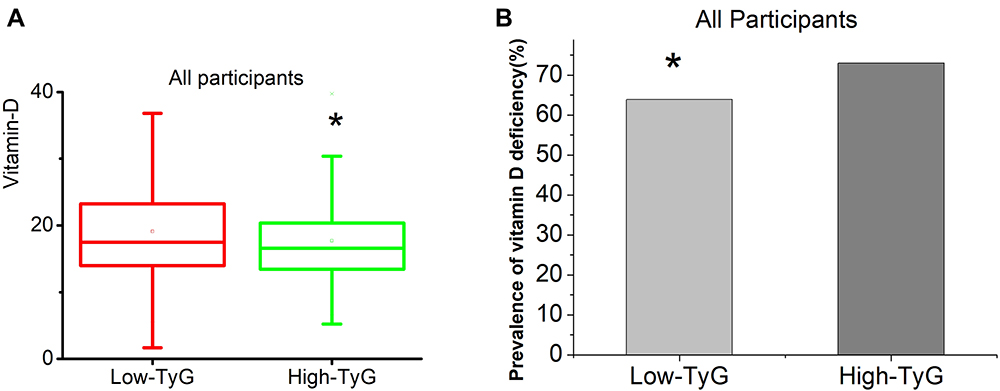 |
Figure 3 Comparisons of 25(OH)D levels and prevalence of vitamin D deficiency in the High TyG group and Low TyG group for all participants. (A) Comparisons of 25 (OH)D levels in the High TyG group and Low TyG group for all participants. (B) Comparisons of the prevalence of vitamin D deficiency in the High TyG group and Low TyG group for all participants. *Denotes significance at a P value of <0.05. |
The Difference of TyG Levels in Female Participants and Male Participants
As shown in Figure 4, the TyG index of the non-vitamin D deficiency group is significantly lower than that of the vitamin D deficiency group for male T2DM (P=0.021). However, for female T2DM, the TyG index of the non-vitamin D deficiency group is not statistically significantly lower than that of the vitamin D deficiency group.
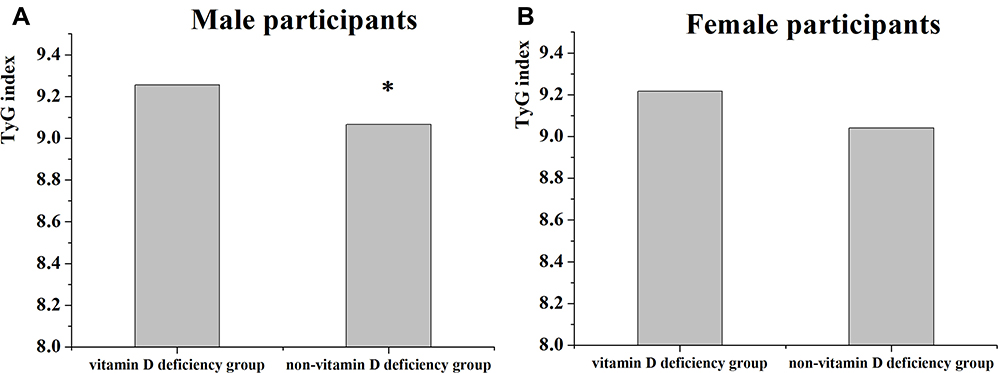 |
Figure 4 Comparisons of TyG in Non vitamin D deficiency group and Vitamin D deficiency group. (A) Comparisons of TyG in Non- vitamin D deficiency group and Vitamin D deficiency group in male participants. (B) Comparisons of TyG in Non- vitamin D deficiency group and Vitamin D deficiency group in female participants. *Denotes significance at a P value of <0.05. |
The Difference of Vitamin D Levels and Prevalence of Vitamin D Deficiency in Female and Male Participants
As shown in Figure 5, compared with the low TyG group, the vitamin D level in the high TyG group decreased significantly for male patients with T2DM (P=0.006), while the prevalence of vitamin D deficiency increased significantly (P=0.017). However, for female patients with T2DM, the level of vitamin D in the high TyG group decreased, and the prevalence of vitamin D deficiency increased compared to the low TyG group. There was no statistical difference between the two groups.
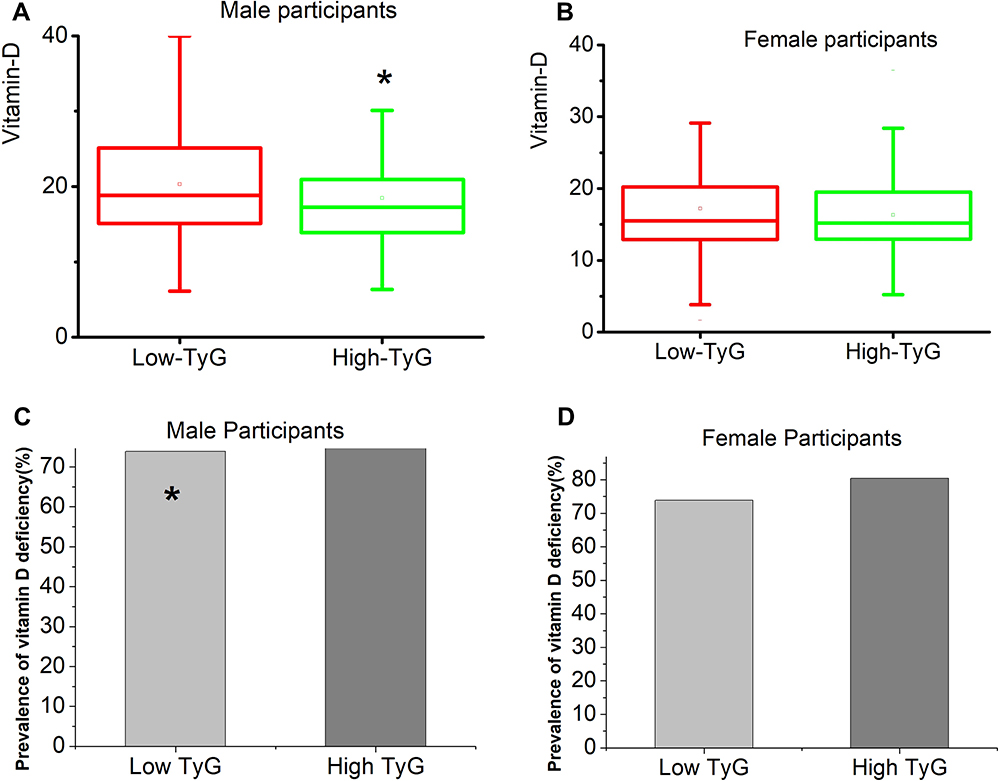 |
Figure 5 Comparisons of 25(OH)D levels and prevalence of vitamin D deficiency in the High TyG group and Low TyG group for male and female participants (A). Comparisons of 25 (OH)D levels in the High TyG group and Low TyG group in the male participants. (B) Comparisons of 25 (OH)D levels in the High TyG group and Low TyG group in the female participants. (C) Comparisons of the prevalence of vitamin D deficiency in the High TyG group and Low TyG group in the male participants. (D) Comparisons of the prevalence of vitamin D deficiency in the High TyG group and Low TyG group in the female participants. *Denotes significance at a P value of <0.05. |
The Difference of Vitamin D Levels and TyG Index in Normal-BMI Participants and High-BMI Participants
As Figure 6 shows, among all participants, the TyG index level of the normal BMI group was significantly lower than that of the high BMI group (P=0.006). Among participants with normal BMI, vitamin D levels in the high TyG group were substantially lower than those in the low TyG group (P=0.029). However, for high BMI participants, although the vitamin D level of the high TyG group was lower than that of the low TyG group, the difference was not statistically significant.
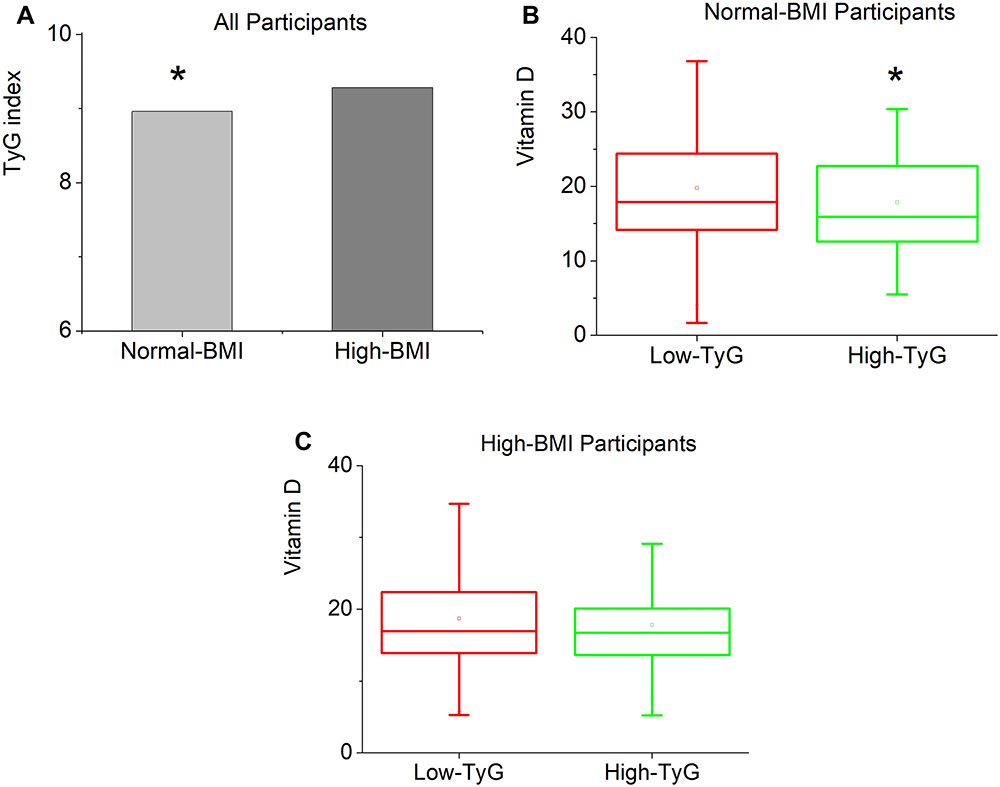 |
Figure 6 (A) Comparisons of TyG index levels in the Normal-BMI group and High-BMI group in all participants. (B) Comparisons of vitamin D levels in the High TyG group and Low TyG group in Normal-BMI participants. (C) Comparisons of vitamin D levels in the High TyG group and Low TyG group in High-BMI participants. *Denotes significance at a P value of <0.05. |
Correlation Between Vitamin D and TyG Levels in Patients with T2DM
As Table 3 and Figure 7 show, vitamin D was negatively correlated with TyG for all study subjects (r = −0.13, P = 0.002), and it was negatively correlated with TyG in male patients with T2DM as well (r = −0.188, P < 0.001). However, there was no correlation between them for females with T2DM (r =−0.06, P = 0.377).
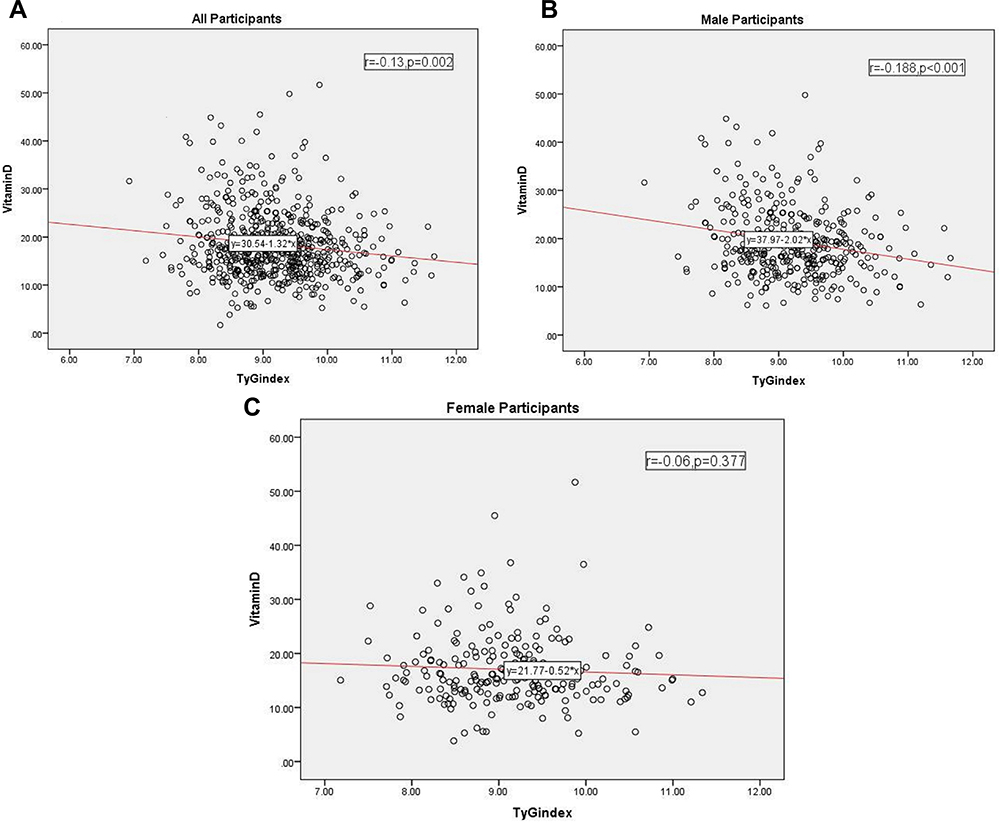 |
Figure 7 The correlation between vitamin D and TyG index levels. (A) The correlation between vitamin D and TyG index levels in all participants. (B) The correlation between vitamin D and TyG index levels in male participants. (C) The correlation between vitamin D and TyG index levels in female participants. |
Multivariate Linear Correlation Analysis of Vitamin D and TyG Levels for Patients with T2DM
As Table 4 shows, for all participants, TyG was negatively correlated with vitamin D in the crude Model 1 (P=0.002), Model 2 (adjusted for albumin, HbA1C, and gender) (P<0.001), Model 3 (adjusted for albumin, HbA1C, gender, age, DM duration, and uric acid) (P<0.001) and Model 4 (adjusted for albumin, HbA1C, gender, age, DM duration, uric acid, BMI, SBP, Scr, BUN, and eGFR) (P<0.001) (Table 4).
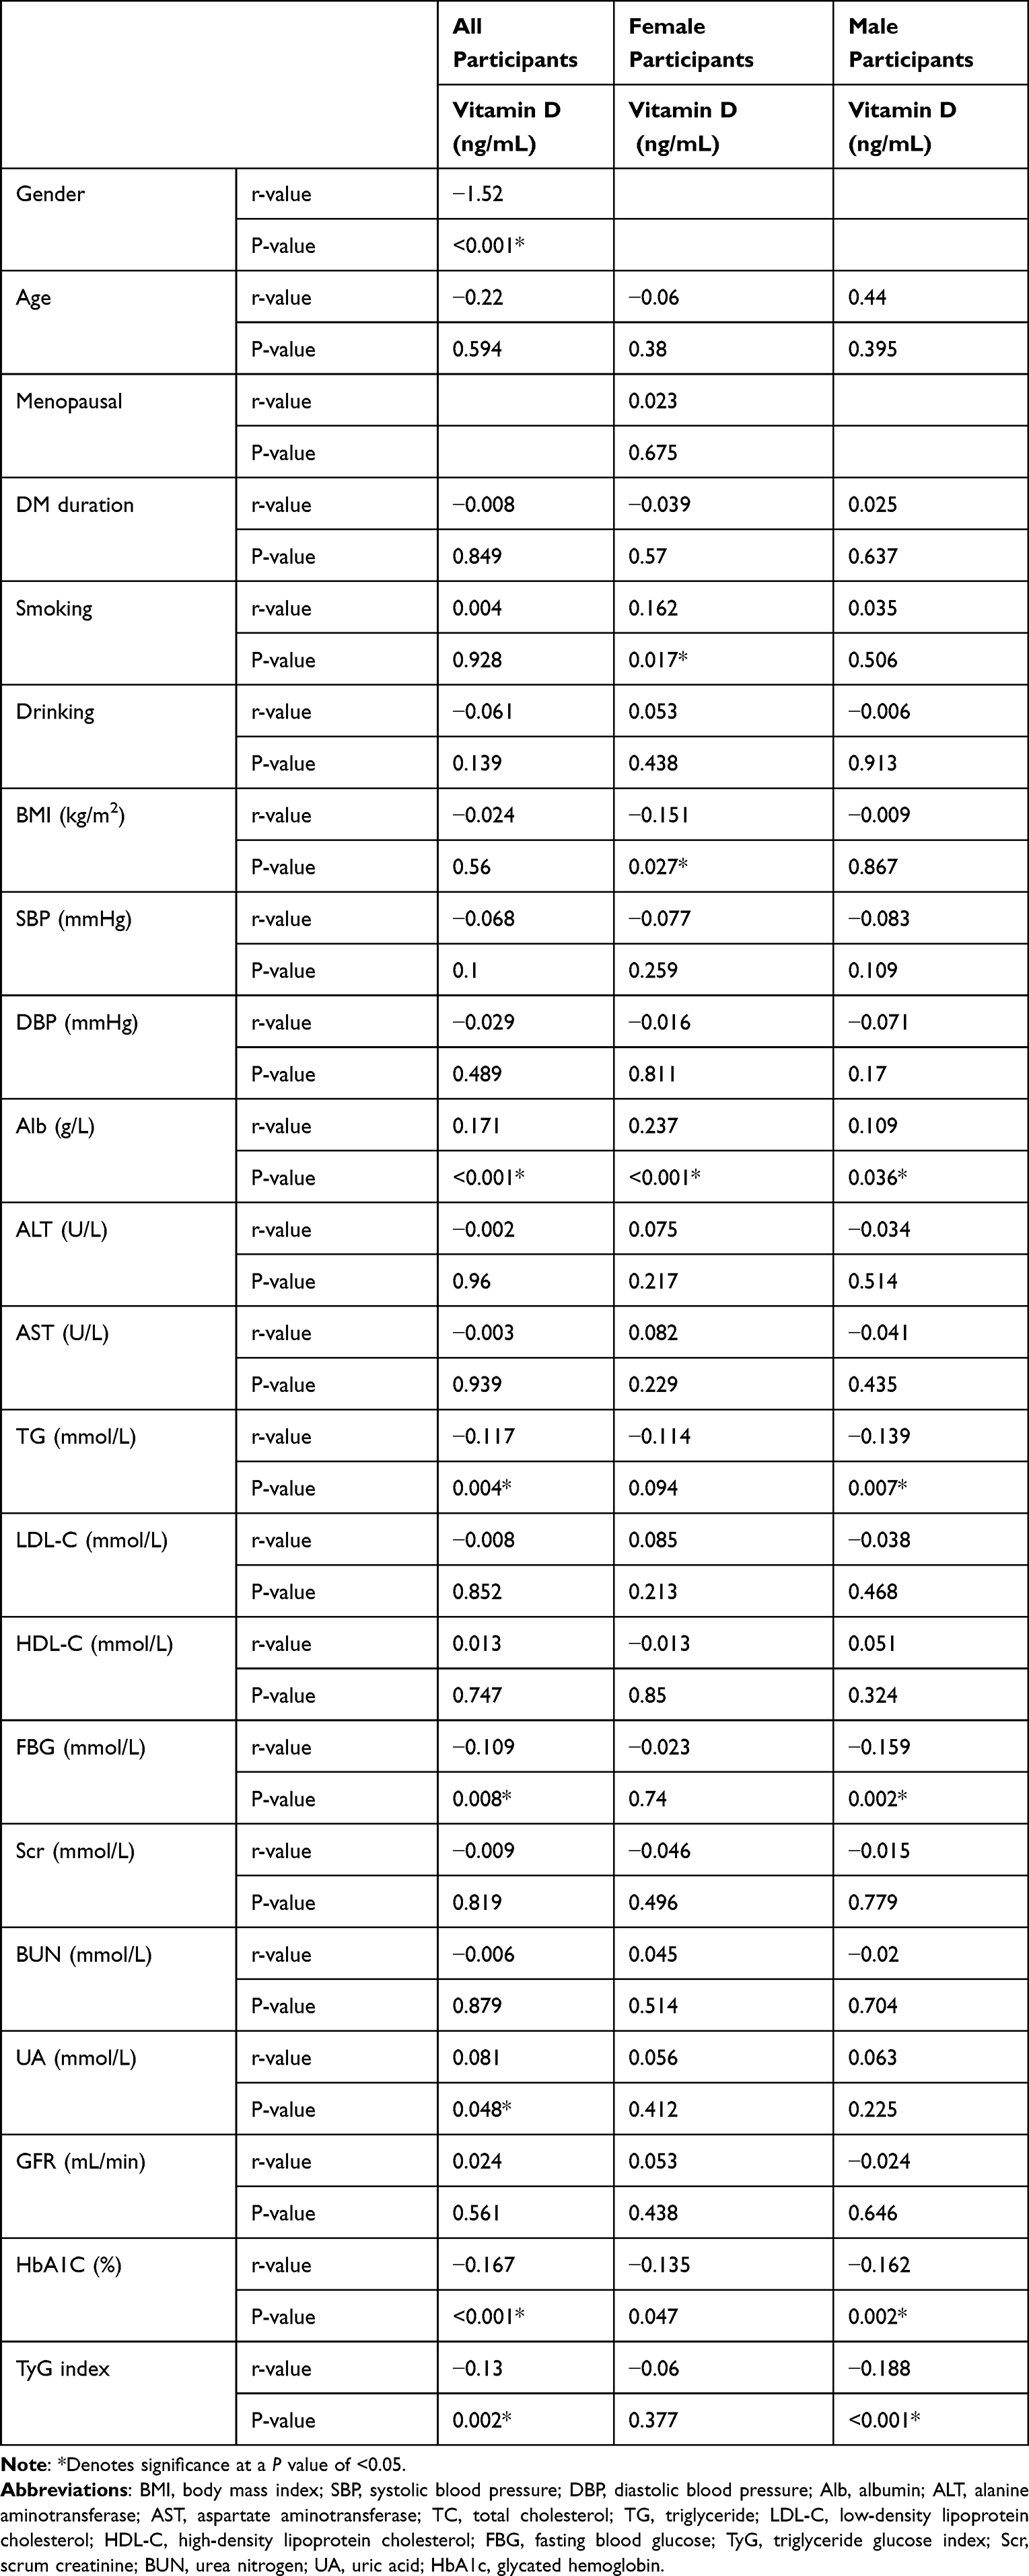 |
Table 3 Correlation Between Vitamin D and Other Factors in Patients with T2DM |
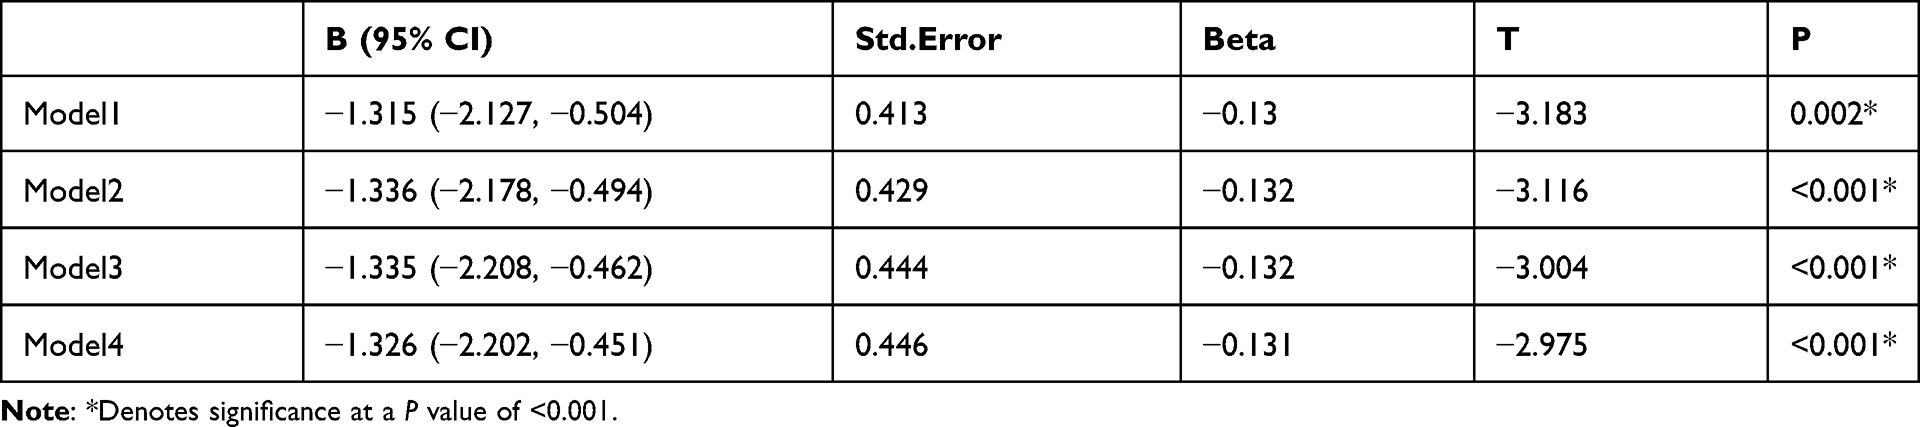 |
Table 4 Correlation Between Vitamin D and TyG in All Patients with T2DM |
As Table 5 shows, TyG was negatively correlated with vitamin D levels for male patients with T2DM, regardless of whether the model is adjusted or not (Model 1: P<0.001; Model 2: P<0.001; Model 3: P<0.001; Model 4: P<0.001) (Table 5).
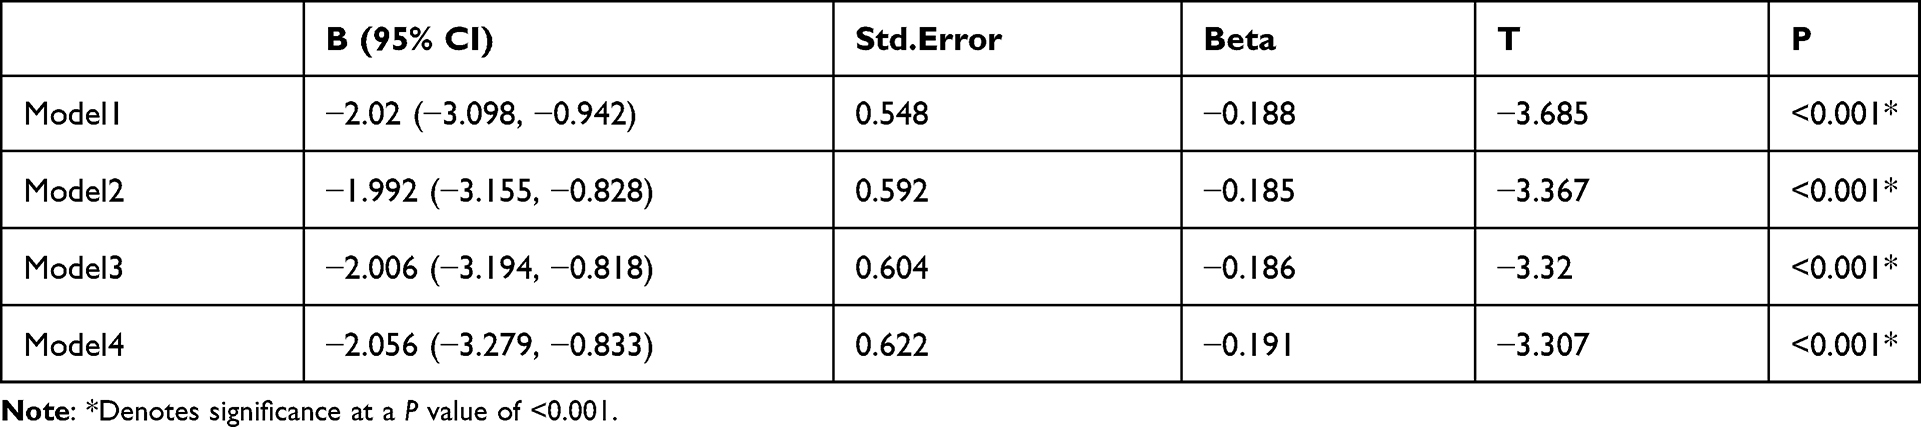 |
Table 5 Correlation Between Vitamin D and TyG in Male Patients with T2DM |
As Table 6 shows, TyG had no statistical correlation with vitamin D levels for female patients with T2DM, regardless of whether the model is adjusted or not (Model 1: (P=0.377); Model 2 (adjusted for albumin, HbA1C): P=0.521; Model 3 (adjusted for albumin, HbA1C, age, DM duration, menopausal status and uric acid): P=0.513; Model 4 (adjusted for albumin, HbA1C, age, DM duration, menopausal status, uric acid, BMI, SBP, Scr, BUN, and eGFR): P=0.693) (Table 6).
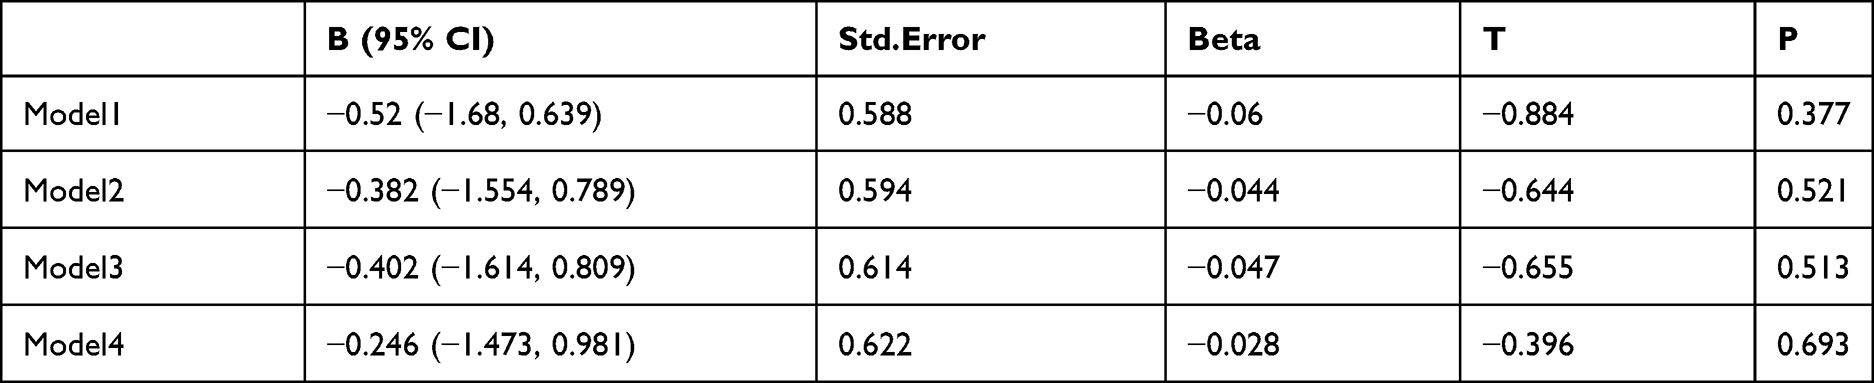 |
Table 6 Correlation Between Vitamin D and TyG in Female Patients with T2DM |
Discussion
Although there is plenty of sunshine exposure in Asia, about 50% of the population still suffers from vitamin D deficiency. The prevalence of vitamin D deficiency is attributed to weather, clothing, lifestyle, dietary intake, age, gender, susceptibility to metabolic syndrome, and genetic inheritance. All these factors can affect the bioavailability of vitamin D.12 Vitamin D is a pleiotropic steroid hormone that can exert various effects by binding to its specific receptor, the Vitamin D receptor (VDR). VDRs are present in over 38 tissues: kidney, osteoblasts, T and B lymphocytes, keratinocytes, small intestine, prostate, gonads, bone, pancreatic islets, hair follicle, ovary, placenta, uterus, and colon. The wide distribution of VDRs makes vitamin D involved in modulating different physiological functions such as cell differentiation and proliferation, angiogenesis inhibition, insulin production stimulation, and renin production. Therefore, besides regulating bone metabolism by regulating calcium and phosphorus homeostasis, vitamin D also regulates cell proliferation, differentiation, apoptosis, immune function, inflammation, and vascular and metabolic properties (such as insulin secretion and insulin sensitivity).13 The link between vitamin D deficiency and other non-classical outcomes besides skeletal diseases has attracted increasing attention in the past few years. It is closely related to various diseases and conditions, such as diabetes, obesity, thyroid dysfunction, infection, autoimmune diseases, cancer, vascular diseases, and skeletal muscle system diseases.14
Recently, many studies have shown that vitamin D is involved in diabetes. Many human trials have shown that vitamin D levels are inversely related to significant hyperglycemia. In addition to the prevalence, in most longitudinal observational trials, it was found that patients with reduced vitamin D levels had a higher incidence of T2DM.15 The discovery of VDR and vitamin D-binding protein in pancreatic tissue and the expression of the enzyme 1-α hydroxylase supports the scientific evidence on the role of vitamin D in the T2DM treatment. In particular, an action on VDR mediated by the existence of Vitamin D-dependent calcium-binding proteins in pancreatic tissues. Another action is on the improvement of insulin action by regulating the expression of the insulin receptor gene in skeletal muscle tissue.16 The association between 25(OH)D and T2DM may be related to the effects of 25(OH)D on the regulation of glucose associated with increased HbA1c levels. Because both 1-a-hydroxylase and vitamin D receptors are found in pancreatic beta cells, 25(OH)D has essential functions in the synthesis and release of insulin.17 Moreover, vitamin D deficiency is independently associated with the high risk of diabetic peripheral neuropathy (DPN) and diabetic nephropathy (DN) in patients with T2DM. It can be a potential predictor of the occurrence and severity of DPN and DN,18 and it might be responsible for elevated cancer risk development in T2DM patients. Vitamin D alleviates insulin resistance, hyperglycemia, oxidative stress, and inflammation reduces diabetes-driven cancer risk factors. Moreover, vitamin D strengthens the DNA repair process and regulates apoptosis and autophagy of cancer cells as well as signaling pathways involved in tumorigenesis, ie, tumor growth factor β (TGFβ), insulin-like growth factor (IGF), and Wnt-β-Catenin.19 Various evidence indicates that vitamin D deficiency can promote the progression of T2DM and its complications by enhancing insulin resistance.
Insulin resistance (IR) can decrease tissue’s sensitivity to insulin and is a predisposing factor for hyperglycemia, hypertension and dyslipidemia. It is also the primary pathophysiological mechanism of T2DM. The clamp method, which is the accepted gold standard for direct measurement of IR, is impractical in clinical settings as it requires sophisticated equipment. Therefore, many other surrogate methods have explored the indirect measurement method of IR. One of the most widely used techniques is the homeostatic model assessment of IR (HOME-IR). HOME-IR is calculated based on the measurement of fasting glucose and insulin levels. However, insulin levels show a wide range of intra-subject and inter-subject variability, and insulin levels are not standardized. Therefore, attempts have been made to identify several other parameters as a measure of IR. Research indicated that TyG index is better than HOME-IR in predicting atherosclerosis in T2DM patients, which further confirms that TyG index may be used as a low-cost and simple non-invasive biomarker to assess the prevalence of atherosclerosis in T2DM patients.20 In recent years, there have been more studies on the TyG index predicting the incidence of T2DM.21 A high TyG index is associated with the presence of retinopathy and nephropathy in individuals with diabetes and can be used for monitoring metabolic status in clinical settings.22,23 In addition, a high TyG index is associated with an increased risk of microalbuminuria, and TyG can effectively identify individuals at risk of non-alcoholic fatty liver disease (NAFLD) since it is highly sensitive to the detection of NAFLD subjects, and can be suitable as a diagnostic standard for Chinese adults with NAFLD.24,25 Previous studies have confirmed that vitamin D is independently related to IR in patients with T2DM, but the study applied HOME-IR to reflect insulin resistance.6,26 This article uses a new indicator, the TyG index, to reflect insulin resistance, which may be helpful for future clinical applications. The TyG index is calculated from blood sugar and triglycerides. Both are routine inspections. It can be checked even in very essential hospitals, so it is very convenient. This study found higher prevalence of vitamin D deficiency in patients with high TyG, and the TyG levels were inversely correlated with vitamin D.
In our study, all the research subjects were divided into vitamin D deficiency group, and vitamin D deficiency group, and relevant clinical data were collected. In the vitamin D deficiency group, we found that women accounted for a greater proportion. Previous studies have shown that This difference may be related to women’s less outdoor exercise and lower hormone levels. In addition, the systolic blood pressure of the vitamin D deficiency group was higher than that of the non-vitamin D deficiency group, but the albumin content was lower. The interaction mechanism between them is still unclear, and previous studies have not explained the relationship between them, which may be related to confounding factors such as gender and age. We also found that compared with the non-vitamin D deficiency group, the vitamin D deficiency group had lower creatinine and uric acid levels, but higher fasting blood glucose and glycosylated hemoglobin levels, consistent with previous studies. The TyG index is divided into two groups based on the median. We found differences in vitamin D levels and the incidence of vitamin D deficiency between the two groups of patients. The TyG levels in patients with T2DM were negatively correlated with vitamin D levels. In the female group, regardless of adjusted or unadjusted confounding factors, there was no correlation between TyG and vitamin D levels.
Further studies need to be conducted to investigate whether the sample population can affect this result. The age in the high TyG index group is lower than that of the low TyG index group. For patients with T2DM, as age increases, the course of diabetes prolongs, and insulin function declines, which means insulin resistance is relatively weakened. In addition, the TyG index is negatively correlated with BMI, which is consistent with previous studies. The higher the BMI index, the more pronounced the insulin resistance. Compared with the low TyG group, the smoking rate, diastolic blood pressure, albumin, and glomerular filtration rate (GFR) are higher in the high TyG group. Regarding the relationship between TyG and smoking rate and diastolic blood pressure, this can be related to the age and gender and other confounding factors. Still, the relationship between TyG and albumin, GFR needs to be further studied to clarify the mechanism. Subgroup analysis showed that the correlation between TyG and the risk of vitamin D deficiency in the normal BMI group was significantly stronger than that in the high BMI group. Therefore, BMI can be an essential factor affecting the efficacy of TyG in identifying individuals at risk for vitamin D deficiency. We analyzed the correlation between vitamin D and the collected clinical data and discovered that vitamin D is correlated with gender, albumin, TG, FBG, UA, and HbA1C. Gender, age, course of diabetes, BMI, albumin, HbA1C, UA, SBP, BUN, GFR were selected as confounding factors since they may affect the results. The result shows a correlation between vitamin D and TyG in the entire study population and the male population, while there is no correlation between female patients.
The study has several advantages. First, all potential confounding factors were adjusted, and 25 (OH)D were independently related to TyG. Second, the formula for calculating TyG is relatively simple. The indicators used in this formula are routine indicators in our clinical work and do not require additional laboratory inspections. The index test is non-invasive and has a certain guiding significance for clinical work.
We identified three limitations of this study. First of all, we cannot assess direct causality since it adopts a cross-sectional observational study design and the sample size is small. Second, we only excluded patients with high and low triglycerides, and eliminated confounding factors in applying lipid-lowering drugs. However, we cannot adjust the intake of alcohol, fruits, juices, and other simple sugars, which can affect the blood and the level of triglycerides. Third, future research on Vitamin D levels should consider more factors, such as outdoor activities, seasons, and diet.
Conclusion
In summary, this study found that high TyG is a risk factor for vitamin D deficiency in Type 2 diabetes, In addition, there is an independent negative correlation between TyG and vitamin D levels in patients with T2DM, and this correlation is different between women and men with T2DM. It is also different between low body weight and high body weight. Proper supplementation of vitamin D in these patients may improve insulin sensitivity.
Disclosure
The authors report no conflicts of interest in this work.
References
1. Ahmed LHM, Butler AE, Dargham SR, et al. Vitamin D3 metabolite ratio as an indicator of vitamin D status and its association with diabetes complications. BMC Endocr Disord. 2020;20(1):161. doi:10.1186/s12902-020-00641-1
2. Yang M, Liu J, Zhou X, et al. Correlation analysis between serum vitamin D levels and lower extremity macrovascular complications in individuals with type 2 diabetes mellitus. J Diabetes Res. 2019;2019:4251829. doi:10.1155/2019/4251829
3. Nam SW, ChiI J, Jeon HJ, et al. The associations between vitamin D receptor BsmI and ApaI polymorphisms and obesity in Korean patients with type 2 diabetes mellitus. Diabetes Metab Syndr Obes. 2021;14:557–564. doi:10.2147/DMSO.S293032
4. Tran Huu TT, Tran HD, Tran TN, et al. Relationship between vitamin D status and the relevant parameters of glucose in patients with type 2 diabetes. Diabetes Metab Syndr Obes. 2021;14:2489–2494. doi:10.2147/DMSO.S314416
5. Xiao Y, Wei L, Xiong X, et al. Association between vitamin D status and diabetic complications in patients with type 2 diabetes mellitus: a cross-sectional study in Hunan China. Front Endocrinol (Lausanne). 2020;11:564738. doi:10.3389/fendo.2020.564738
6. Zhao H, Tang Y, Zheng C, et al. Vitamin D status is independently associated with insulin resistance in patients with type 2 diabetes mellitus. Risk Manag Healthc Policy. 2021;14:1393–1399. doi:10.2147/RMHP.S299963
7. Neelankal John A, Jiang F-X. An overview of type 2 diabetes and importance of vitamin D3-vitamin D receptor interaction in pancreatic β-cells. J Diabetes Complications. 2018;32(4):429–443. doi:10.1016/j.jdiacomp.2017.12.002
8. Guo W, Zhao L, Mo F, et al. The prognostic value of the triglyceride glucose index in patients with chronic heart failure and type 2 diabetes: a retrospective cohort study. Diabetes Res Clin Pract. 2021;177:108786. doi:10.1016/j.diabres.2021.108786
9. Xuan X, Hamaguahi M, Cao Q, et al. U-shaped association between the triglyceride-glucose index and the risk of incident diabetes in people with normal glycemic level: a population-base longitudinal cohort study. Clin Nutr. 2021;40(4):1555–1561. doi:10.1016/j.clnu.2021.02.037
10. Lin HY, Zhang XJ, Liu YM, et al. Comparison of the triglyceride glucose index and blood leukocyte indices as predictors of metabolic syndrome in healthy Chinese population. Sci Rep. 2021;11(1):10036. doi:10.1038/s41598-021-89494-9
11. Zhang Y, Ding X, Hua B, et al. Predictive effect of triglyceride glucose index on clinical events in patients with type 2 diabetes mellitus and acute myocardial infarction: results from an observational cohort study in China. Cardiovasc Diabetol. 2021;20(1):43. doi:10.1186/s12933-021-01236-3
12. Zakaria WNA, Mohd Yunus N, Yaacob NM, et al. Association between vitamin D receptor polymorphisms (BsmI and FokI) and glycemic control among patients with type 2 diabetes. Int J Environ Res Public Health. 2021;18(4):1595. doi:10.3390/ijerph18041595
13. Dai J, Yu M, Chen H, et al. Association between serum 25-OH-vitamin D and diabetic foot ulcer in patients with type 2 diabetes. Front Nutr. 2020;7:109. doi:10.3389/fnut.2020.00109
14. Senyigit A. The association between 25-hydroxy vitamin D deficiency and diabetic complications in patients with type 2 diabetes mellitus. Diabetes Metab Syndr. 2019;13(2):1381–1386. doi:10.1016/j.dsx.2019.01.043
15. Wang Z, Zhao L, He S. Triglyceride-glucose index as predictor for future type 2 diabetes mellitus in a Chinese population in southwest China: a 15-year prospective study. Endocrine. 2021;72(1):124–131. doi:10.1007/s12020-020-02589-7
16. Torres Dominguez EA, Meza Penafiel A, Gomez Pedraza A, et al. Molecular mechanisms from insulin-mimetic effect of vitamin D: treatment alternative in Type 2 diabetes mellitus. Food Funct. 2021;12(15):6682–6690. doi:10.1039/D0FO03230A
17. Li Z, Wang F, Jia Y, et al. The relationship between hemoglobin glycation variation index and vitamin D in type 2 diabetes mellitus. Diabetes Metab Syndr Obes. 2021;14:1937–1948. doi:10.2147/DMSO.S310672
18. Zhao WJ, Xia XY, Yin J. Relationship of serum vitamin D levels with diabetic microvascular complications in patients with type 2 diabetes mellitus. Chin Med J (Engl). 2021;134(7):814–820. doi:10.1097/CM9.0000000000001364
19. Gabryanczyk A, Klimczak S, Szymczak-Pajor I, et al. Is vitamin D deficiency related to increased cancer risk in patients with type 2 diabetes mellitus? Int J Mol Sci. 2021;22(12):6444. doi:10.3390/ijms22126444
20. Wang S, Shi J, Peng Y, et al. Stronger association of triglyceride glucose index than the HOMA-IR with arterial stiffness in patients with type 2 diabetes: a real-world single-centre study. Cardiovasc Diabetol. 2021;20(1):82. doi:10.1186/s12933-021-01274-x
21. Chiu H, Tsai HJ, Huang JC, et al. Associations between triglyceride-glucose index and micro- and macro-angiopathies in type 2 diabetes mellitus. Nutrients. 2020;12(2):328. doi:10.3390/nu12020328
22. Zhang S, Du T, Zhang J, et al. The triglyceride and glucose index (TyG) is an effective biomarker to identify nonalcoholic fatty liver disease. Lipids Health Dis. 2017;16(1):15. doi:10.1186/s12944-017-0409-6
23. Srinivasan S, Singh P, Kulothungan V, et al. Relationship between triglyceride glucose index, retinopathy and nephropathy in Type 2 diabetes. Endocrinol Diabetes Metab. 2021;4(1):e00151. doi:10.1002/edm2.151
24. Yao L, Wang X, Zhong Y, et al. The triglyceride–glucose index is associated with diabetic retinopathy in Chinese patients with type 2 diabetes: a hospital-based, nested, case–control study. Diabetes Metab Syndr Obes. 2021;14:1547–1555. doi:10.2147/DMSO.S294408
25. Liu L, Xia R, Song X, et al. Association between the triglyceride-glucose index and diabetic nephropathy in patients with type 2 diabetes: a cross-sectional study. J Diabetes Investig. 2021;12(4):557–565. doi:10.1111/jdi.13371
26. Zhao H, Zhen Y, Wang Z, et al. The relationship between vitamin D deficiency and glycated hemoglobin levels in patients with type 2 diabetes mellitus. Diabetes Metab Syndr Obes. 2020;13:3899–3907. doi:10.2147/DMSO.S275673
 © 2022 The Author(s). This work is published and licensed by Dove Medical Press Limited. The
full terms of this license are available at https://www.dovepress.com/terms
and incorporate the Creative Commons Attribution
- Non Commercial (unported, 3.0) License.
By accessing the work you hereby accept the Terms. Non-commercial uses of the work are permitted
without any further permission from Dove Medical Press Limited, provided the work is properly
attributed. For permission for commercial use of this work, please see paragraphs 4.2 and 5 of our Terms.
© 2022 The Author(s). This work is published and licensed by Dove Medical Press Limited. The
full terms of this license are available at https://www.dovepress.com/terms
and incorporate the Creative Commons Attribution
- Non Commercial (unported, 3.0) License.
By accessing the work you hereby accept the Terms. Non-commercial uses of the work are permitted
without any further permission from Dove Medical Press Limited, provided the work is properly
attributed. For permission for commercial use of this work, please see paragraphs 4.2 and 5 of our Terms.