Back to Journals » Diabetes, Metabolic Syndrome and Obesity » Volume 12
The Relationship Between The Electromyographic Activity Of Rectus And Oblique Abdominal Muscles And Bioimpedance Body Composition Analysis - A Pilot Observational Study
Authors Ptaszkowski K ![]() , Wlodarczyk P
, Wlodarczyk P ![]() , Paprocka-Borowicz M
, Paprocka-Borowicz M ![]()
Received 16 May 2019
Accepted for publication 3 September 2019
Published 7 October 2019 Volume 2019:12 Pages 2033—2040
DOI https://doi.org/10.2147/DMSO.S215982
Checked for plagiarism Yes
Review by Single anonymous peer review
Peer reviewer comments 2
Editor who approved publication: Prof. Dr. Antonio Brunetti
Kuba Ptaszkowski, Paulina Wlodarczyk, Malgorzata Paprocka-Borowicz
Department of Clinical Biomechanics and Physiotherapy in Motor System Disorders, Wroclaw Medical University, Wroclaw 51-355, Poland
Correspondence: Kuba Ptaszkowski
Department of Clinical Biomechanics and Physiotherapy in Motor System Disorders, Wroclaw Medical University, Wybrzeże L. Pasteura 1, Wroclaw 51-355, Poland
Tel +487117840183
Fax +48717840182
Email [email protected]
Purpose: Measurements using surface electromyography (sEMG) may be more complicated when the different thickness of the subcutaneous tissue layer is observed, therefore it is important to show the influence of fat tissue on the results of sEMG measurements. The main aim of the study was to assess the relationship between the sEMG RMS value of rectus and external oblique muscles of the abdomen and the composition of the body, which was assessed using bioelectrical impedance analysis.
Patients and methods: The target group was made up of healthy people aged 20-30-year-old. The study visit protocol of the participants was as follows: a medical history, instructions on the purpose of measurements and examination procedures, obtaining consent for participation in the research, an analysis of the body weight composition by the electrical bioimpedance method, a fat tissue thickness measurement using body fat calipers, preparation of the subject for sEMG measurements (sEMG RMS value of rectus and external oblique abdominal muscles).
Results: Twenty-nine people were qualified for the study according to the inclusion and exclusion criteria. sEMG amplitudes decreased when the person had a higher fat content and had less water in the body. These results were related to the rectus abdominal muscle (mainly its upper part) during the active contraction of this muscle. In addition, it was observed that when actively bent their torsos forward people with a higher BMI and with a greater thickness of fat tissue had a lower sEMG RMS value of the rectus abdominal muscle.
Conclusion: In order to conduct reliable examinations using sEMG, parameters concerning the amount of fat tissue, the thickness of fat tissue, BMI and amount of water in the body should be taken into account.
Keywords: surface electromyography, body mass index, bioelectrical impedance, abdominal fat, skinfold thickness
Introduction
Surface electromyography (sEMG) is now a common auxiliary tool used in scientific research or clinical work.1–4 Interpretation of sEMG results depends mostly on the shape and amplitude of the signal from a given muscle. Therefore, it is important that factors influencing the signal can be quantified and considered in the interpretation. Sometimes, in the case of sEMG, locating the source of the signal becomes problematic. Not all active muscle fibers are subject to testing, but those fibers that are located nearby may affect the measurement results.1–8 Measurements using sEMG may be even more complicated when the different thickness of the subcutaneous tissue layer is observed.1,9–12
The main aim of the study was to assess the relationship between the sEMG value of rectus and external oblique muscles of the abdomen and the composition of the body, which was assessed using bioelectrical impedance analysis (BIA). A correlation between the electromyographic results and the body mass index (BMI) and fat thickness was evaluated secondarily.
Materials And Methods
A prospective, cross-sectional observational study received the approval from the Bioethical Commission at the Wroclaw Medical University (number of opinions of the Bioethics Committee: KB −152/2017). The study was a part of research project number ST.E060.16.059 (Ministry of Science and Higher Education in Poland). The research was carried out in the Department of Clinical Biomechanics and Physiotherapy in Motor System Disorders (Wroclaw Medical University) from October 2016 to December 2017.
The target group was made up of healthy people aged 20-30-year-old. The exclusion criteria were as follows: a lack of consent for participation in the study; contraindications for electromyographic examination or BIA (among others: neurological diseases or musculoskeletal disorders, pharmacological treatment at present, infection, open wound, rash, pregnancy, a pacemaker, metal implants) a surgery or injury in the last 12 months; malaise on the day of the study; cancer or epilepsy; and difficulty in contacting the subject.
The study visit protocol of the participants was as follows: a medical history (personal questionnaire), instructions on the purpose of measurements and examination procedures, obtaining consent for participation in the research, an analysis of the body weight composition by the electrical bioimpedance method, a determination of the indicator BMI, a fat tissue thickness measurement using body fat calipers, preparation of the subject for sEMG measurements (sEMG RMS value of rectus and external oblique abdominal muscles).
The following apparatus was used for the study: the body weight scale and segmental analyzer for determination of the body composition, the body fat calipers, and the surface electromyography. The analysis of the body weight composition by the electrical bioimpedance method was carried out using the Tanita BC545N scale (TANITA, USA) with complete body analysis, and the test is carried out in a standing position. The subjects stood barefoot on the weight scale and on the visible electrodes, thus evenly spreading their weight. Then, each subject pulled the movable arm of the device, which was located at the front of the scale, and remained in place with their upper limbs straightened, while the electrodes were still placed on their body. Such a position allowed a free flow of current throughout the body and guaranteed a more accurate measurement. During the measurement, the person was instructed to stand motionless because, according to the literature, displacement of the electrodes by up to 1 cm, due to a change in body position, can cause a change in the current flow of up to 2%, which may have produced unreliable results. After acquisition of the signal, the subject exited the scale. The following parameters were used in the study: body water (%), body fat (%), muscle mass (kg), weight (kg) and BMI (kg/m2).
Next, the measurement of the thickness of the fat tissue was carried out using the Accu-Measure body fat calipers. The participants were instructed to grab as much of the tissue fold as possible over the right ilium, at the level of the umbilicus. The results are given in millimeters.
The researcher then conducted the study participants through the preparation procedure for the proper bioelectric measurement. The subjects were instructed to lie back on a couch and expose their abdomens. Then, the skin was prepared for the application of electrodes via the removal of hair from the surface of the skin and the cleansing of the skin with a disinfectant. Afterwards, electrodes were glued to the prepared skin. Starting with the placement of the reference electrode on the right anterior superior iliac spine, the researcher then proceeded to arrange the remaining electrodes. The bioelectric activity of selected muscles was evaluated using disposable surface, self-adhesive, silver-silver chloride electrodes (Ag/AgCl; size: 30 mm; Sorimex, Poland). The electromyographic examination included the following muscles: the rectus abdominis muscle (RA) in the upper and lower parts of the abdomen (RA upper part - RA UP, RA lower part - RA LP) and the external abdominal muscles (EO). Measurements were made on both the right and left sides. RA electrodes were positioned on the upper and lower part of the muscle, above and below the umbilicus, parallel to each other. The surface electrodes for OEA muscle was positioned over the anterolateral abdominal wall below the rib cage. The reference electrode was located on the anterior superior iliac spine.13–15 The electromyographic signal was analyzed with standard post-hoc processing. It was cleaned and smoothened using the root square mean (RMS) value. The bioelectrical activity of the examined muscles was expressed in microvolts (μV).5,6,16–18
To measure the sEMG RMS value of the RA and EO, each tested person was initially instructed to relax and recall all of the activities that the person would have to perform during the examination. The measurements were carried out in three positions: P1, P2, and P3.
The first position (P1) involved each subject lying down, during which the resting activity of the muscles was measured. This measurement lasted for 10 seconds. The second position (P2), also in the lying down position, allowed for the measurement of functional muscle activity during isometric work. Each subject was instructed to perform a forward flexion of the torso while the researcher applied resistance in the area of the shoulder joints. This measurement lasted for 10 seconds and during this time, the muscles were in a state of isometric contraction (Figure 1).
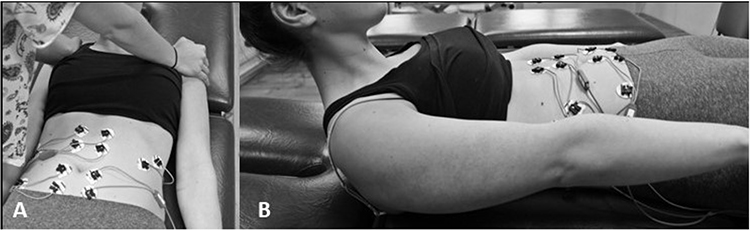 |
Figure 1 Second (P2) and third (P3) positions during the study (A–the second position P2 isometric contraction; B–the third position P3 functional sEMG measurement). |
In the third position (P3), each examined person lied on their back and bent their torsos forward three times, after which they moved their shoulders away from the couch. Each participant had 10 seconds to do this. The result was the average of the three contractions (Figure 1).
The sample size was assessed on the bases of pilot studies carried out in our Department. The study compared the differences of sEMG RMS of RA between two groups (a group with normal BMI and group with BMI results indicating obesity or overweight). Prior data indicated that the difference of sEMG RMS of RA between groups is normally distributed with a standard deviation of 2.6 µV. If the true difference in the mean of sEMG RMS of RA between groups is 3.4 µV than to be able to reject the null hypothesis, 13 subjects will be needed in each group (total 26 participants plus 10% of participants who may drop out from research). Power analysis was set at 0.8. The Type I error probability associated with this test of this null hypothesis was 0.05.
Statistical analysis was performed using Statistica 13 (TIBCO Software Inc.; USA). For continuous variables, arithmetic means, medians, standard deviations, and ranges of variation (extreme values) were calculated. For qualitative variables, the frequency of their occurrence (percentage) was calculated. All the tested quantitative variables were analyzed with the Shapiro-Wilk test to determine the type of distribution. The dependence between the selected alternatives was determined using the Spearman rank correlation test. An alpha level of 0.05 was assumed for all comparisons.
Results
Thirty-seven people participated in the study. Twenty-nine people were qualified for the study according to the inclusion and exclusion criteria. Eight people were excluded based on the following criteria: five people reported a surgery in the last 12 months, two people experienced malaise on the day of the study, and one person did not agree to the test. The study group consisted of twenty women (68.97%) and nine men (31.03%). The characteristics of the group are shown in Table 1.
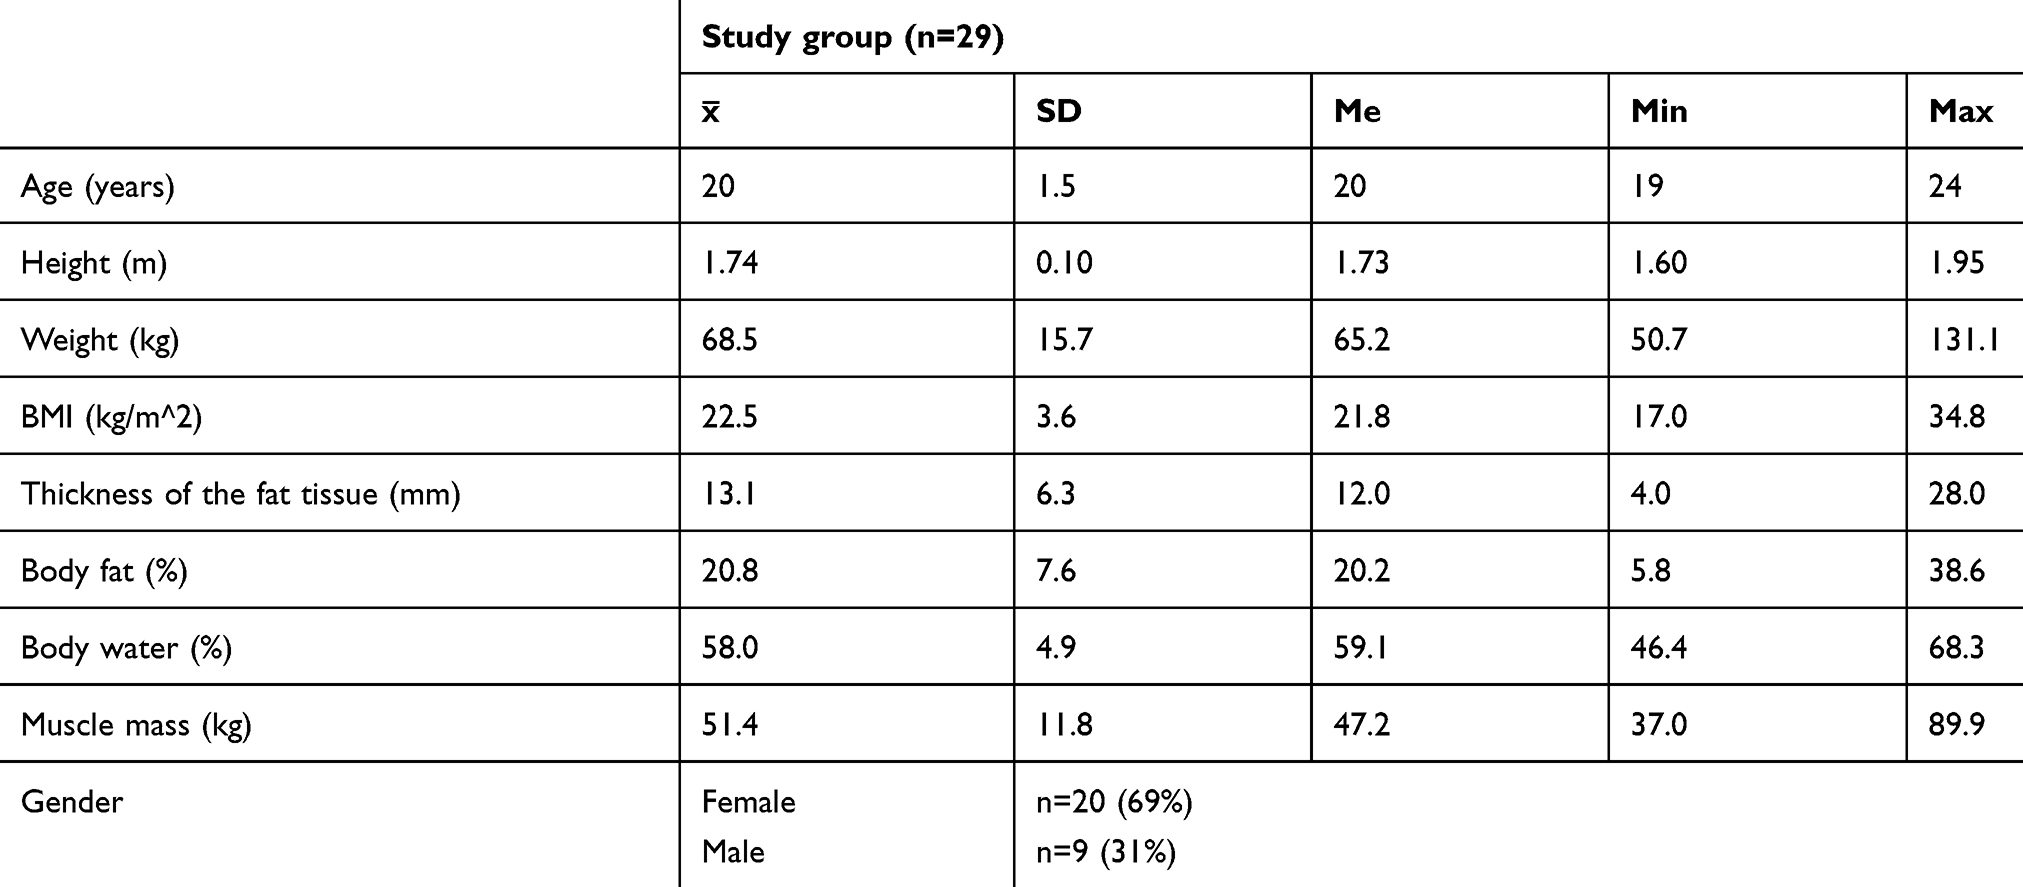 |
Table 1 Characteristics Of The Study Group |
The results of the electromyographic evaluation of the examined muscles in the three positions are presented in Table 2. These results were used to assess the linear relationship with variables such as body fat (%), body water (%), muscle mass (kg), BMI (kg/m2), and fatty tissue thickness (mm).
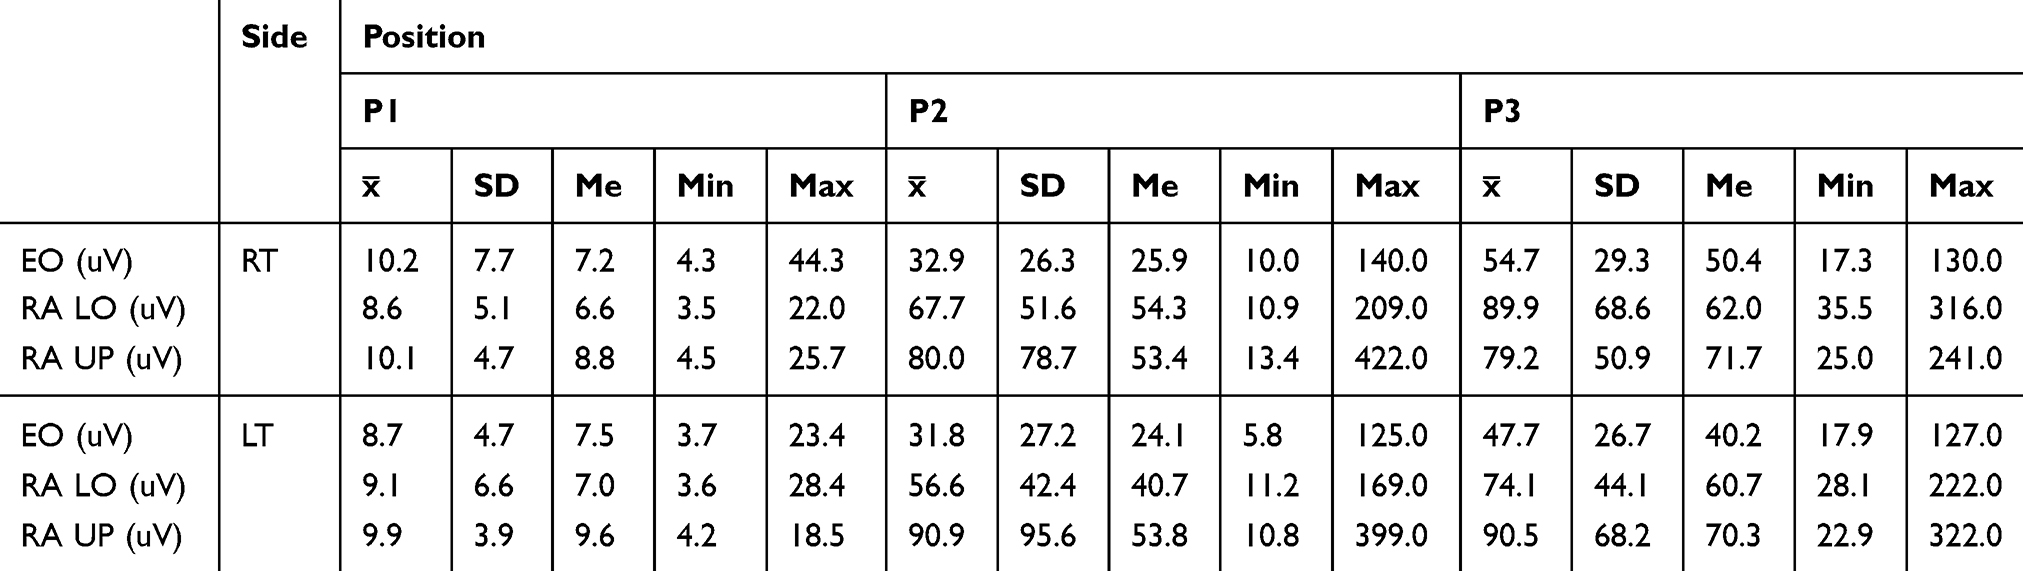 |
Table 2 Measurement Of sEMG (μV) Of The Examined Muscles In P1, P2, And P3 |
The relationship between the percentage of body fat, body water, muscle mass and the bioelectrical activity of the selected muscles is shown in Table 3. In P1, statistically significant positive correlations between the percentage of body fat and the sEMG RMS value of the EO muscles on the right side, as well as the RA LO muscles on the right side, were observed. Additionally, there was a negative correlation observed between the percentage of body fat and the sEMG RMS value of the RA UP muscles on the left side. In P2, there were statistically significant negative correlations between the percentage of body fat and the RA UP muscles on the right and the left side. In P3, there were statistically significant negative correlations between the percentage of body fat and the RA LO muscles on the right and the left side, and with the RA UP muscles on the right and the left side (Table 3).
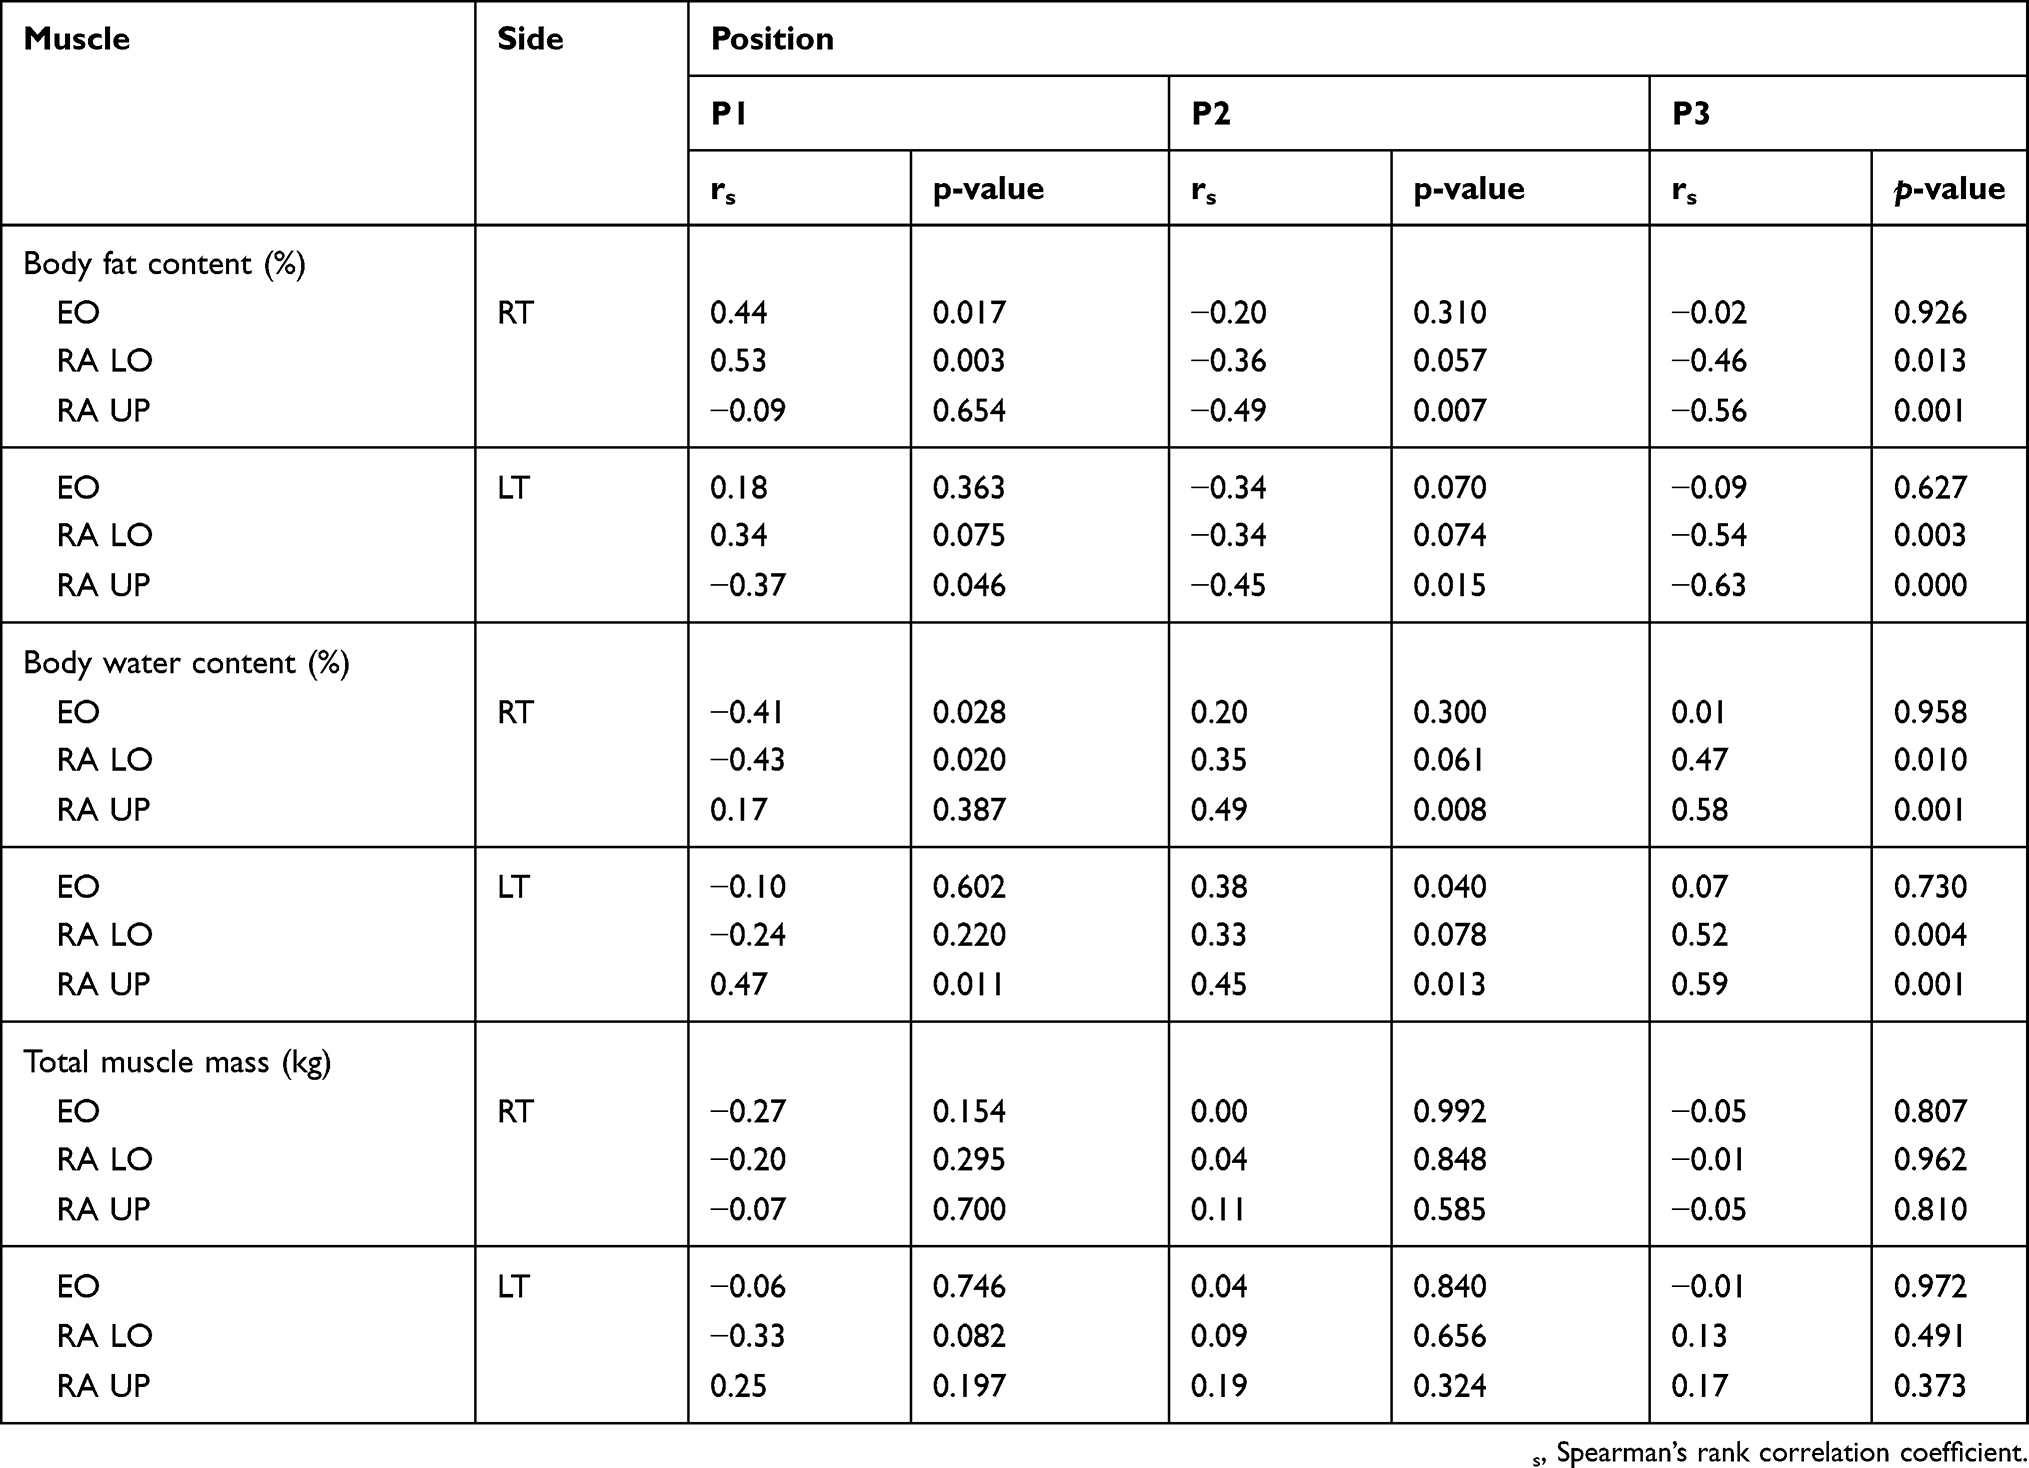 |
Table 3 Correlation Between Body Weight Composition Parameters (Body Fat Content, Body Water Content, Total Muscle Muss) And Bioelectric Activity (μV) RA Muscles And EO Muscles In Three Positions (P1, P2, P3) |
In P1, statistically significant negative correlations between the percentage of body water and the sEMG RMS value of the RA LO muscles on the right and the left side were observed. Additionally, a positive correlation was observed between the percentage of body water and the sEMG RMS value of the RA UP muscles on the left side (Table 3). In P2 and P3, statistically significant positive correlations were observed between almost all of the results of sEMG RMS value of the RA muscles (Table 3).
No statistically significant correlations between muscle mass and the sEMG RMS value of the selected abdominal muscles were observed (Table 3).
Table 4 shows the relationships between the BMI index and the bioelectrical activity of RA muscles and EO muscles in three positions (P1, P2, P3). In P1, a statistically significant positive correlation between BMI and the sEMG RMS value of the RA LO muscles on the right side was observed. In P3, negative, statistically significant correlations were observed between BMI and the sEMG RMS value of the RA LO muscles on the right side, the sEMG RMS value of the RA UP muscles on the right side, and the sEMG RMS value of the RA LO muscles on the left side. There was no statistically significant correlation observed between BMI and bioelectric muscle activity in P2 (Table 4).
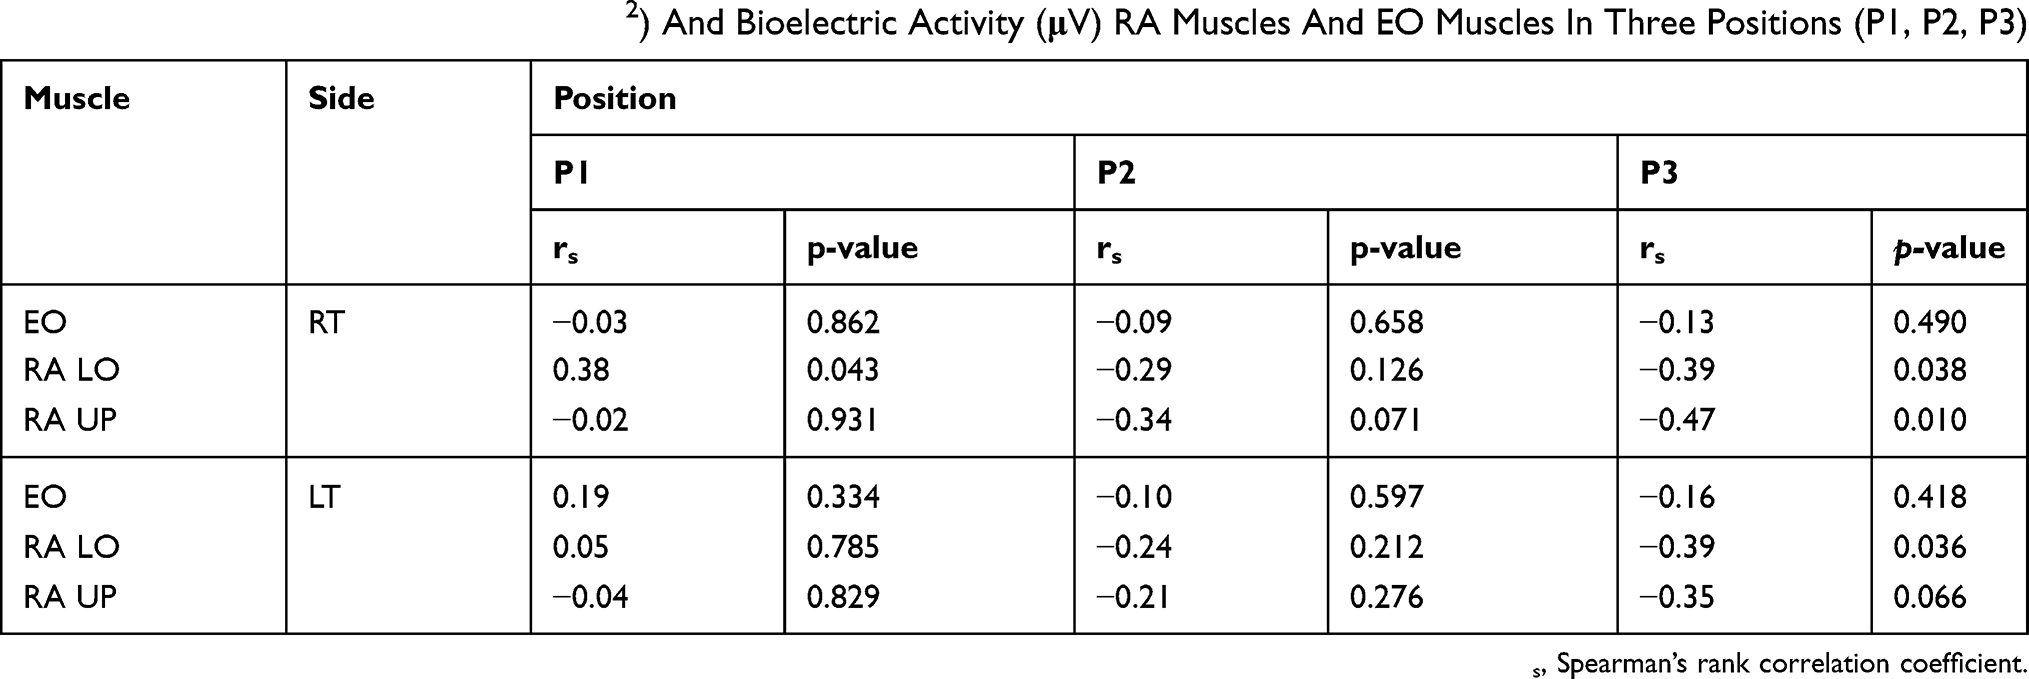 |
Table 4 Correlation Between BMI (m/kg2) And Bioelectric Activity (μV) RA Muscles And EO Muscles In Three Positions (P1, P2, P3) |
There were no statistically significant correlations observed between the measurement of fat tissue thickness and the sEMG RMS value of selected muscles in P1. In P2, a statistically significant, negative correlation was observed between the measurement of fat tissue thickness and the sEMG RMS value of the RA UP muscles on the right side. In P3, statistically significant, negative correlations were observed between the measurement of fat tissue thickness and the sEMG RMS value of the following muscles: the RA LO muscles on the right and left side, and the RA UP muscles on the right and left side (Table 5).
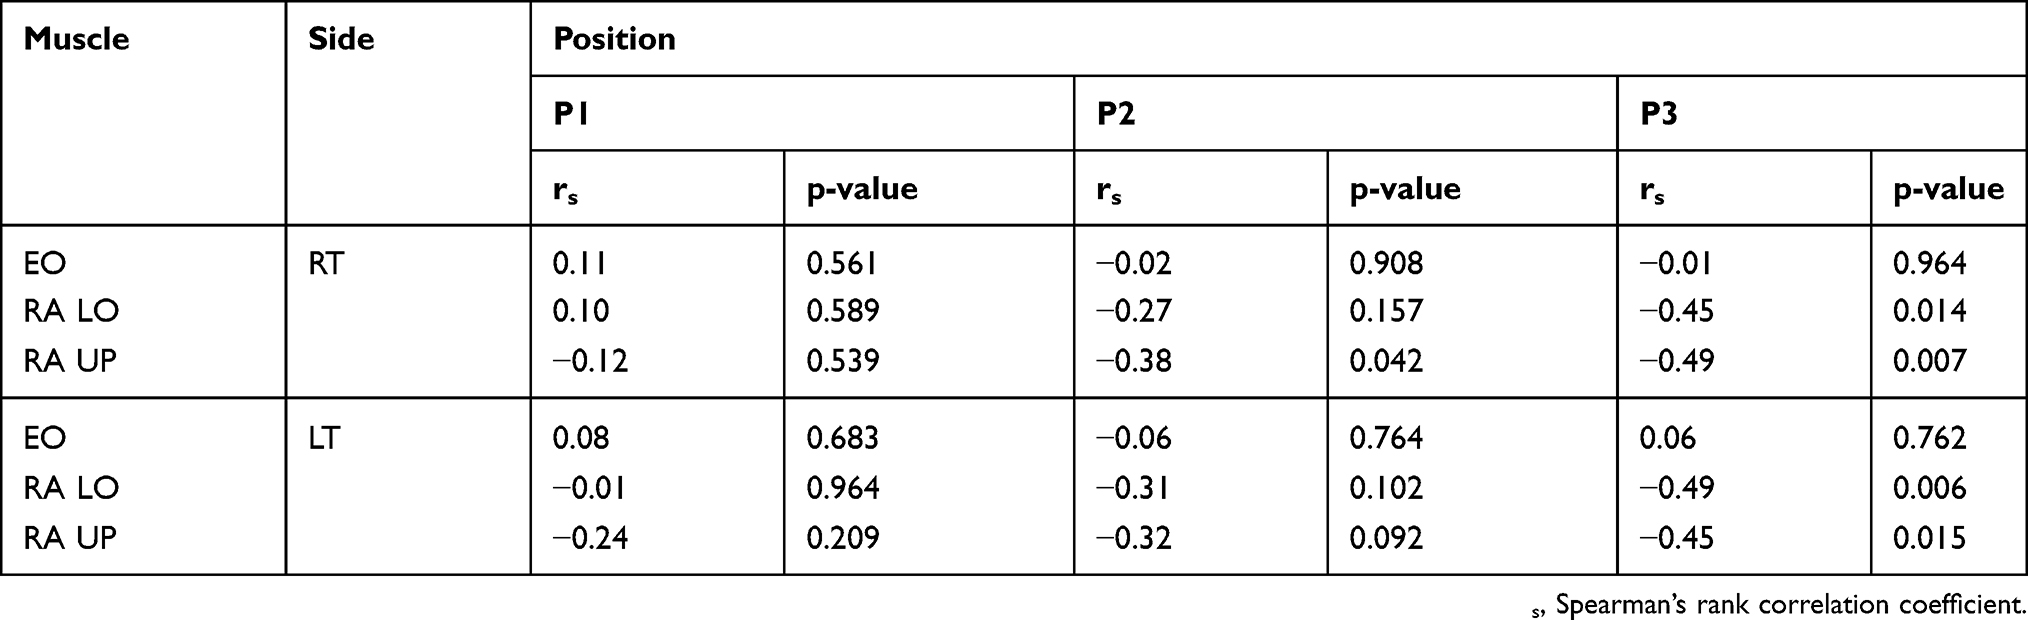 |
Table 5 Correlation Between Fat Tissue Thickness (mm) And Bioelectric Activity (μV) RA Muscles And EO Muscles In Three Positions (P1, P2, P3) |
Discussion
The main reason for the above tests was to address the lack of a clearly defined influence of fat tissue on measurements using sEMG. In the literature,2,9–12,19–22 we attempted to investigate this impact, but the past results were ambiguous.
In this study, sEMG amplitudes decreased when the person had a higher fat content and had less water in the body. These results were related to the rectus abdominal muscle (mainly its upper part) during the active contraction of this muscle. In addition, it was observed that when actively performing the forward slope, people with a higher BMI and with a greater thickness of fat tissue had a lower sEMG RMS value of the rectus abdominal muscle. Interestingly, no unequivocal association was observed between the resting assessment of the examined muscles and either the content of the fat tissue or the amount of water. There were no correlations observed between the sEMG RMS value and muscle mass. Additionally, poor correlations were observed between the assessed variables and the sEMG RMS value of the oblique abdominal muscles, which may have resulted from the incomplete activation of these muscles during the movements performed during the study. Partial confirmation of these obtained results can be found in the work of De la Barrera and Milner.12 Through the study, they were able to conclusively show that the selectivity of the sEMG electrodes increases as the thickness of the tissue layer between the skin surface and the muscle fibers decreases. The tests were performed during voluntary contraction of the biceps muscle. The researchers stressed that through these studies, the sEMG signals could not be interpreted in the same manner for all subjects. Parameters such as the skinfold thickness at the recording site and the orientation of the electrodes on the active muscle fibers must be taken into account.12
In a study by Bartuzi et al,21 the researchers obtained results similar to the results obtained by our research team, especially as they apply to the rectus abdominal muscle. These researchers also evaluated the palmaris longus muscle; however, in this case, the results were inconclusive. The results of Bartuzi’s study suggested that the sEMG signal is sensitive to a fatty tissue layer, but the impact of the fatty tissue layer on the sEMG signal is dependent on the muscles examined. In addition, the researchers drew attention to the need to continue research, in order to determine the exact impact of fat tissue on the sEMG record.21
Nordander et al10 summarized the results of their research by concluding that a large part of the inter-individual variance in sEMG amplitudes can be explained by the amounts and properties of the subcutaneous tissue that separates the muscle and the electrode. This can be measured either by BMI or, as argued above, more reliably by skinfold calipers. These results are consistent with our results. It seems that this information should be used to create a normalization method that will allow the variability resulting from body fat thickness to be taken into account.10
It is worth noting that the sEMG record is possible in obese people, as confirmed by Minetto et al.9 The researchers noticed that the detection of sEMG signals from the quadriceps muscle is also possible in severely obese people (who have an increased thickness of subcutaneous adipose tissue). In addition, they confirmed the assumptions that were also known in this study; specifically, that a lower degree of thickness of the subcutaneous tissue results in a higher assessment of amplitude and mean frequency of the sEMG signal. Furthermore, the researchers did not find any differences in myoelectrical muscle fatigue after periodic, voluntary, and persistent contractions between obese patients and lean patients.9 This last conclusion can be compared with the results obtained in our work, which relate to the assessment of the dependence of the amount of body fat and the resting activity of the examined muscles. There was no clear relationship between these variables.
There is a lack of data in the literature that draws attention to the influence of the amount of water in the body on the assessment of muscle sEMG activity. In this study, a linear relationship is observed and concerns the active work of the rectus abdominal muscle. Only in a portion of the publication can you find information that the patient should not perform intense physical exercise and should regularly replenish fluids before the sEMG examination.
The main limitations of this study are related to the examination of a small part of the population. However, it is worth emphasizing that these subjects are pilot studies. Additionally, despite the small sample size, we can observe some statistically significant correlations that emphasize the validity of conducting these tests. The small sample size also contributed to the fact that a multivariate regression analysis was not performed because of the possible bias (a high number of variables and a small sample size). Additionally, future research should also take into account the standardization of maximum voluntary contraction (MVC), even though it is a method that also has some limitations. For example, the participants must be able to perform a valid trial, the test exercise must correctly “catch” the muscle, and the selected muscle length must represent dynamic movements.
The results presented in this paper and presented by other researchers indicate that in order to conduct reliable examinations using sEMG, parameters concerning the amount of fat tissue, the thickness of fat tissue, BMI and amount of water in the body should be taken into account. When taken into account, these parameters will result in a better reliability of the data and a better choice of subject populations in studies involving the use of sEMG.
Conclusion
An increased fat content in the body and a reduced amount of water contributed to a lower recording of the bioelectrical activity of the rectus abdominal muscle during its functional activity. In addition, a similar relationship was observed with the BMI parameters and fat thickness. These parameters should be considered when performing a study using sEMG measurements and at the stage of determining the target group. Research should be continued, with future changes to account for a larger number of people and an additional, objective assessment of the thickness of body fat.
Ethics Statement
The authors confirm that all participants provided written informed consent, and this study was conducted in accordance with the Declaration of Helsinki.
Acknowledgments
There were no other contributors to the article other than the authors. A certified English language service was provided by an academic, highly qualified, native English speaker to ensure a proper language quality including syntax, spelling and grammar issues.
This study was conducted with a research grant for young scientists founded from statutory sources of the Ministry of Science and Higher Education in Poland (no ST.E060.16.059).
Disclosure
The authors report no conflicts of interest in this work.
References
1. Hamilton RM, Method M, Rogan MJ, Walsh M, White L, Thomas S. Developing a pelvic tilt device for pelvic examinations: a performance improvement project. J Emerg Nurs JEN Off Publ Emerg Dep Nurses Assoc. 2009;35(1):40–42. doi:10.1016/j.jen.2007.11.001
2. Solnik S, DeVita P, Grzegorczyk K, Koziatek A, Bober T. EMG frequency during isometric, submaximal activity: a statistical model for biceps brachii. Acta Bioeng Biomech. 2010;12(3):21–28.
3. Soderberg GL, Cook TM. Electromyography in biomechanics. Phys Ther. 1984;64(12):1813–1820. doi:10.1093/ptj/64.12.1813
4. Merletti R, Rainoldi A, Farina D. Surface electromyography for noninvasive characterization of muscle. Exerc Sport Sci Rev. 2001;29(1):20–25.
5. De Luca CJ. The use of surface electromyography in biomechanics. J Appl Biomech. 1997;13:135–163. doi:10.1123/jab.13.2.135
6. De Luca CJ. Physiology and mathematics of myoelectric signals. IEEE Trans Biomed Eng. 1979;26(6):313–325.
7. Merletti R, Farina D, Gazzoni M, Schieroni MP. Effect of age on muscle functions investigated with surface electromyography. Muscle Nerve. 2002;25(1):65–76.
8. Merletti R, Botter A, Troiano A, Merlo E, Minetto MA. Technology and instrumentation for detection and conditioning of the surface electromyographic signal: state of the art. Clin Biomech Bristol Avon. 2009;24(2):122–134. doi:10.1016/j.clinbiomech.2008.08.006
9. Minetto MA, Botter A, Šprager S, et al. Feasibility study of detecting surface electromyograms in severely obese patients. J Electromyogr Kinesiol Off J Int Soc Electrophysiol Kinesiol. 2013;23(2):285–295. doi:10.1016/j.jelekin.2012.09.008
10. Nordander C, Willner J, Hansson G-A, et al. Influence of the subcutaneous fat layer, as measured by ultrasound, skinfold calipers and BMI, on the EMG amplitude. Eur J Appl Physiol. 2003;89(6):514–519. doi:10.1007/s00421-003-0819-1
11. Kuiken TA, Lowery MM, Stoykov NS. The effect of subcutaneous fat on myoelectric signal amplitude and cross-talk. Prosthet Orthot Int. 2003;27(1):48–54. doi:10.3109/03093640309167976
12. De la Barrera EJ, Milner TE. The effects of skinfold thickness on the selectivity of surface EMG. Electroencephalogr Clin Neurophysiol. 1994;93(2):91–99. doi:10.1016/0168-5597(94)90071-x
13. Ng JK, Kippers V, Richardson CA. Muscle fibre orientation of abdominal muscles and suggested surface EMG electrode positions. Electromyogr Clin Neurophysiol. 1998;38(1):51–58.
14. Madill SJ, McLean L. Relationship between abdominal and pelvic floor muscle activation and intravaginal pressure during pelvic floor muscle contractions in healthy continent women. Neurourol Urodyn. 2006;25(7):722–730. doi:10.1002/nau.20285
15. Barbero M, Merletti R, Rainoldi A. Atlas of Muscle Innervation Zones: Understanding Surface Electromyography and Its Applications. Mailand: Springer-Verlag; 2012. Available from: https://www.springer.com/gp/book/9788847024625.
16. Hermens HJ, Freriks B, Disselhorst-Klug C, Rau G. Development of recommendations for SEMG sensors and sensor placement procedures. J Electromyogr Kinesiol Off J Int Soc Electrophysiol Kinesiol. 2000;10(5):361–374. doi:10.1016/S1050-6411(00)00027-4
17. Zwarts MJ, Stegeman DF. Multichannel surface EMG: basic aspects and clinical utility. Muscle Nerve. 2003;28(1):1–17. doi:10.1002/mus.10358
18. Marras WS, Davis KG. A non-MVC EMG normalization technique for the trunk musculature: part 1. Method development. J Electromyogr Kinesiol. 2001;11(1):1–9. doi:10.1016/S1050-6411(00)00039-0
19. Carr JC, Beck TW, Ye X, Wages NP. Intensity-dependent EMG response for the biceps brachii during sustained maximal and submaximal isometric contractions. Eur J Appl Physiol. 2016;116(9):1747–1755. doi:10.1007/s00421-016-3435-6
20. Cooper MA, Herda TJ, Vardiman JP, Gallagher PM, Fry AC. Relationships between skinfold thickness and electromyographic and mechanomyographic amplitude recorded during voluntary and non-voluntary muscle actions. J Electromyogr Kinesiol Off J Int Soc Electrophysiol Kinesiol. 2014;24(2):207–213. doi:10.1016/j.jelekin.2013.12.005
21. Bartuzi P, Tokarski T, Roman-Liu D. The effect of the fatty tissue on EMG signal in young women. Acta Bioeng Biomech. 2010;12(2):87–92.
22. Heitmann BL. Evaluation of body fat estimated from body mass index, skinfolds and impedance. A comparative study. Eur J Clin Nutr. 1990;44(11):831–837.
 © 2019 The Author(s). This work is published and licensed by Dove Medical Press Limited. The
full terms of this license are available at https://www.dovepress.com/terms
and incorporate the Creative Commons Attribution
- Non Commercial (unported, 3.0) License.
By accessing the work you hereby accept the Terms. Non-commercial uses of the work are permitted
without any further permission from Dove Medical Press Limited, provided the work is properly
attributed. For permission for commercial use of this work, please see paragraphs 4.2 and 5 of our Terms.
© 2019 The Author(s). This work is published and licensed by Dove Medical Press Limited. The
full terms of this license are available at https://www.dovepress.com/terms
and incorporate the Creative Commons Attribution
- Non Commercial (unported, 3.0) License.
By accessing the work you hereby accept the Terms. Non-commercial uses of the work are permitted
without any further permission from Dove Medical Press Limited, provided the work is properly
attributed. For permission for commercial use of this work, please see paragraphs 4.2 and 5 of our Terms.