Back to Journals » International Journal of General Medicine » Volume 14
The Relationship Between Prognostic Nutritional Index and All-Cause Mortality in Critically Ill Patients: A Retrospective Study
Received 6 May 2021
Accepted for publication 2 July 2021
Published 17 July 2021 Volume 2021:14 Pages 3619—3626
DOI https://doi.org/10.2147/IJGM.S318896
Checked for plagiarism Yes
Review by Single anonymous peer review
Peer reviewer comments 2
Editor who approved publication: Dr Scott Fraser
Yan Lu, Chaoxiang Ren, Jinwen Jiang
Clinical Laboratory, DongYang People’s Hospital, Dongyang, 322100, Zhejiang, People’s Republic of China
Correspondence: Yan Lu
Clinical Laboratory, DongYang People’s Hospital, 60 West Wuning Road, Dongyang, 322100, Zhejiang, People’s Republic of China
Tel +8618367815795
Email [email protected]
Purpose: The effectiveness and prognostic value of the prognostic nutritional index (PNI) in critically ill patients are unknown. Hence, this study aimed to analyze the relationship between the PNI and all-cause mortality in critically ill patients.
Patients and Methods: Patient data were obtained from the Multiparameter Intelligent Monitoring in Intensive Care III database. The relationship between the PNI and in-hospital mortality was analyzed using receiver operating characteristic curve analysis and a logistic regression model. Propensity score matching (PSM) was used to eliminate the bias caused by confounding factors. The Kaplan–Meier curve and Cox regression model were used to test the effect of the PNI on 30-, 90-, 180-, and 365-day mortality.
Results: A low PNI score is an independent risk factor for in-hospital mortality in critically ill patients. A total of 3644 cases were successfully matched using PSM. The PSM group with balanced covariates obtained similar results in the three models, which were statistically significant. The Kaplan–Meier curve and Cox regression model showed that the PNI was negatively correlated with 30-, 90-, 180-, and 365-day all-cause mortality.
Conclusion: The PNI score is an independent risk factor for all-cause mortality in critically ill patients, where a low PNI score is associated with increased mortality.
Keywords: prognostic nutritional index, mortality, critically ill patients, propensity score matching
Introduction
Critically ill patients have rapid disease progression, which is accompanied by severe trauma and multiple infections.1 The condition of patients entering the intensive care unit is heterogeneous. Therefore, obtaining objective and easy-to-obtain risk stratification indicators, which can be widely used in clinical practice, can help clinicians to quickly assess the severity of the patient’s disease and improve patient prognosis.
Although albumin as a nutritional indicator has been questioned,2,3 its relevance to the prognosis of critically ill patients has been discussed.4–6 As an important group of immune cells, lymphocytes have been confirmed to reflect the patient’s immune status. Prognostic Nutrition Index (PNI) is an objective indicator calculated using serum albumin level and lymphocyte count.7 The PNI was originally used for risk assessment of patients after surgery,8 but in the recent years, it has been used as a risk stratification indicator in the assessment of the prognosis of other types of patients.9–12
Currently, the effectiveness and prognostic value of the PNI in critically ill patients require further research. This study aimed to explore the relationship between the PNI and all-cause mortality in critically ill patients.
Materials and Methods
Data Resource
The data for this retrospective study were obtained from the Medical Information Mart for Intensive Care III (MIMIC-III) database.13 The MIMIC-III database, a large single-center database widely used by international researchers for retrospective clinical research,14–16 contains information on more than 50,000 unidentified patients admitted to the intensive care unit (ICU) of Beth Israel Deaconess Medical Center in Boston, MA. According to the data usage agreement, author Yan Lu (certification number: 35953547) is authorized to obtain detailed information, including information on patient care and treatment, from the database without the need for additional ethical review or approval.
Inclusion and Exclusion Criteria
The data in the MIMIC-III database were screened according to the criteria. The inclusion criteria were as follows: lack of personal admission information of the patient was less than 5%; the serum albumin concentration and total lymphocyte counts were measured within 24 hours of ICU admission; and an age ≥18 years. Patients with repeated admissions were excluded, except for the information on the first admission. Patients who died before ICU admission were not included in the study.
Data Extraction
Structured query language17 was used to extract the required data from the MIMIC-III database. The extracted data included sex, age, height, weight, comorbidities, severity score, laboratory parameters, survival status, and survival time. Comorbidities included diabetes, hypertension, coronary heart disease, heart failure, respiratory failure, and malignancy. Severity scores included the Sequential Organ Failure Assessment (SOFA),18 systemic inflammatory response syndrome (SIRS),19 Oxford Acute Severity of Illness Score (OASIS),20 and Simplified Acute Physiology Score II (SAPS II).21 The laboratory parameters were extracted from the first detected value within 24 hours after ICU admission, including total lymphocyte counts, serum albumin, white blood cell (WBC) counts, platelet counts, serum creatinine, blood glucose, and hemoglobin.
Outcomes
The study focused on the all-cause mortality of critically ill patients. The time started when the patient was admitted to the ICU. The primary outcome was in-hospital mortality. The secondary outcomes were 30-, 90-, 180-, and 365-day mortality.
Statistical Analyses
The parameters to be converted were calculated according to the following formulas: PNI=10 × serum albumin value (g/dL) + 5 × number of peripheral blood lymphocytes (×109/L);22 and body mass index (BMI)=weight (kg)/height squared (m2).23
Categorical variables are expressed as frequencies and proportions. Continuous variables are expressed as mean ± standard deviation. The t-test and chi-square test were performed to assess the differences between the groups. The receiver operating characteristic (ROC) curve was used to evaluate the predictive value of the PNI for in-hospital mortality of critically ill patients. PSM was used to eliminate the bias caused by confounding factors.24 The nearest neighbor matching method was used for PSM, with a matching ratio of 1:1 and a maximum allowable error value of 0.02 between the two matched groups. Then, the logistic regression model was used to test whether the PNI is an independent risk factor for in-hospital mortality in critically ill patients. The results are expressed as odds ratios (ORs) with 95% confidence intervals (95% CIs). The Kaplan–Meier curve was used to intuitively estimate the survival rate of the secondary outcome,25 and adjusted and unadjusted Cox regression models were used to test the impact of the PNI on the survival of critically ill patients. Differences were considered statistically significant when the P-value was <0.05.
Results
After screening 58,976 subjects in the MIMIC-III database, 5860 patients met the inclusion criteria. The included patients were divided into two groups according to the median PNI score: those with a PNI score <35.07 (low–PNI score group) and ≥35.07 (high–PNI score group). Patients with a low PNI score had higher average age, lower BMI, and higher severity scores than those with a high PNI score (Table 1). There were significant differences in comorbidities (diabetes, hypertension, coronary heart disease, respiratory failure, and malignancy) and laboratory parameters (platelets, creatinine, glucose, and hemoglobin) between the two groups.
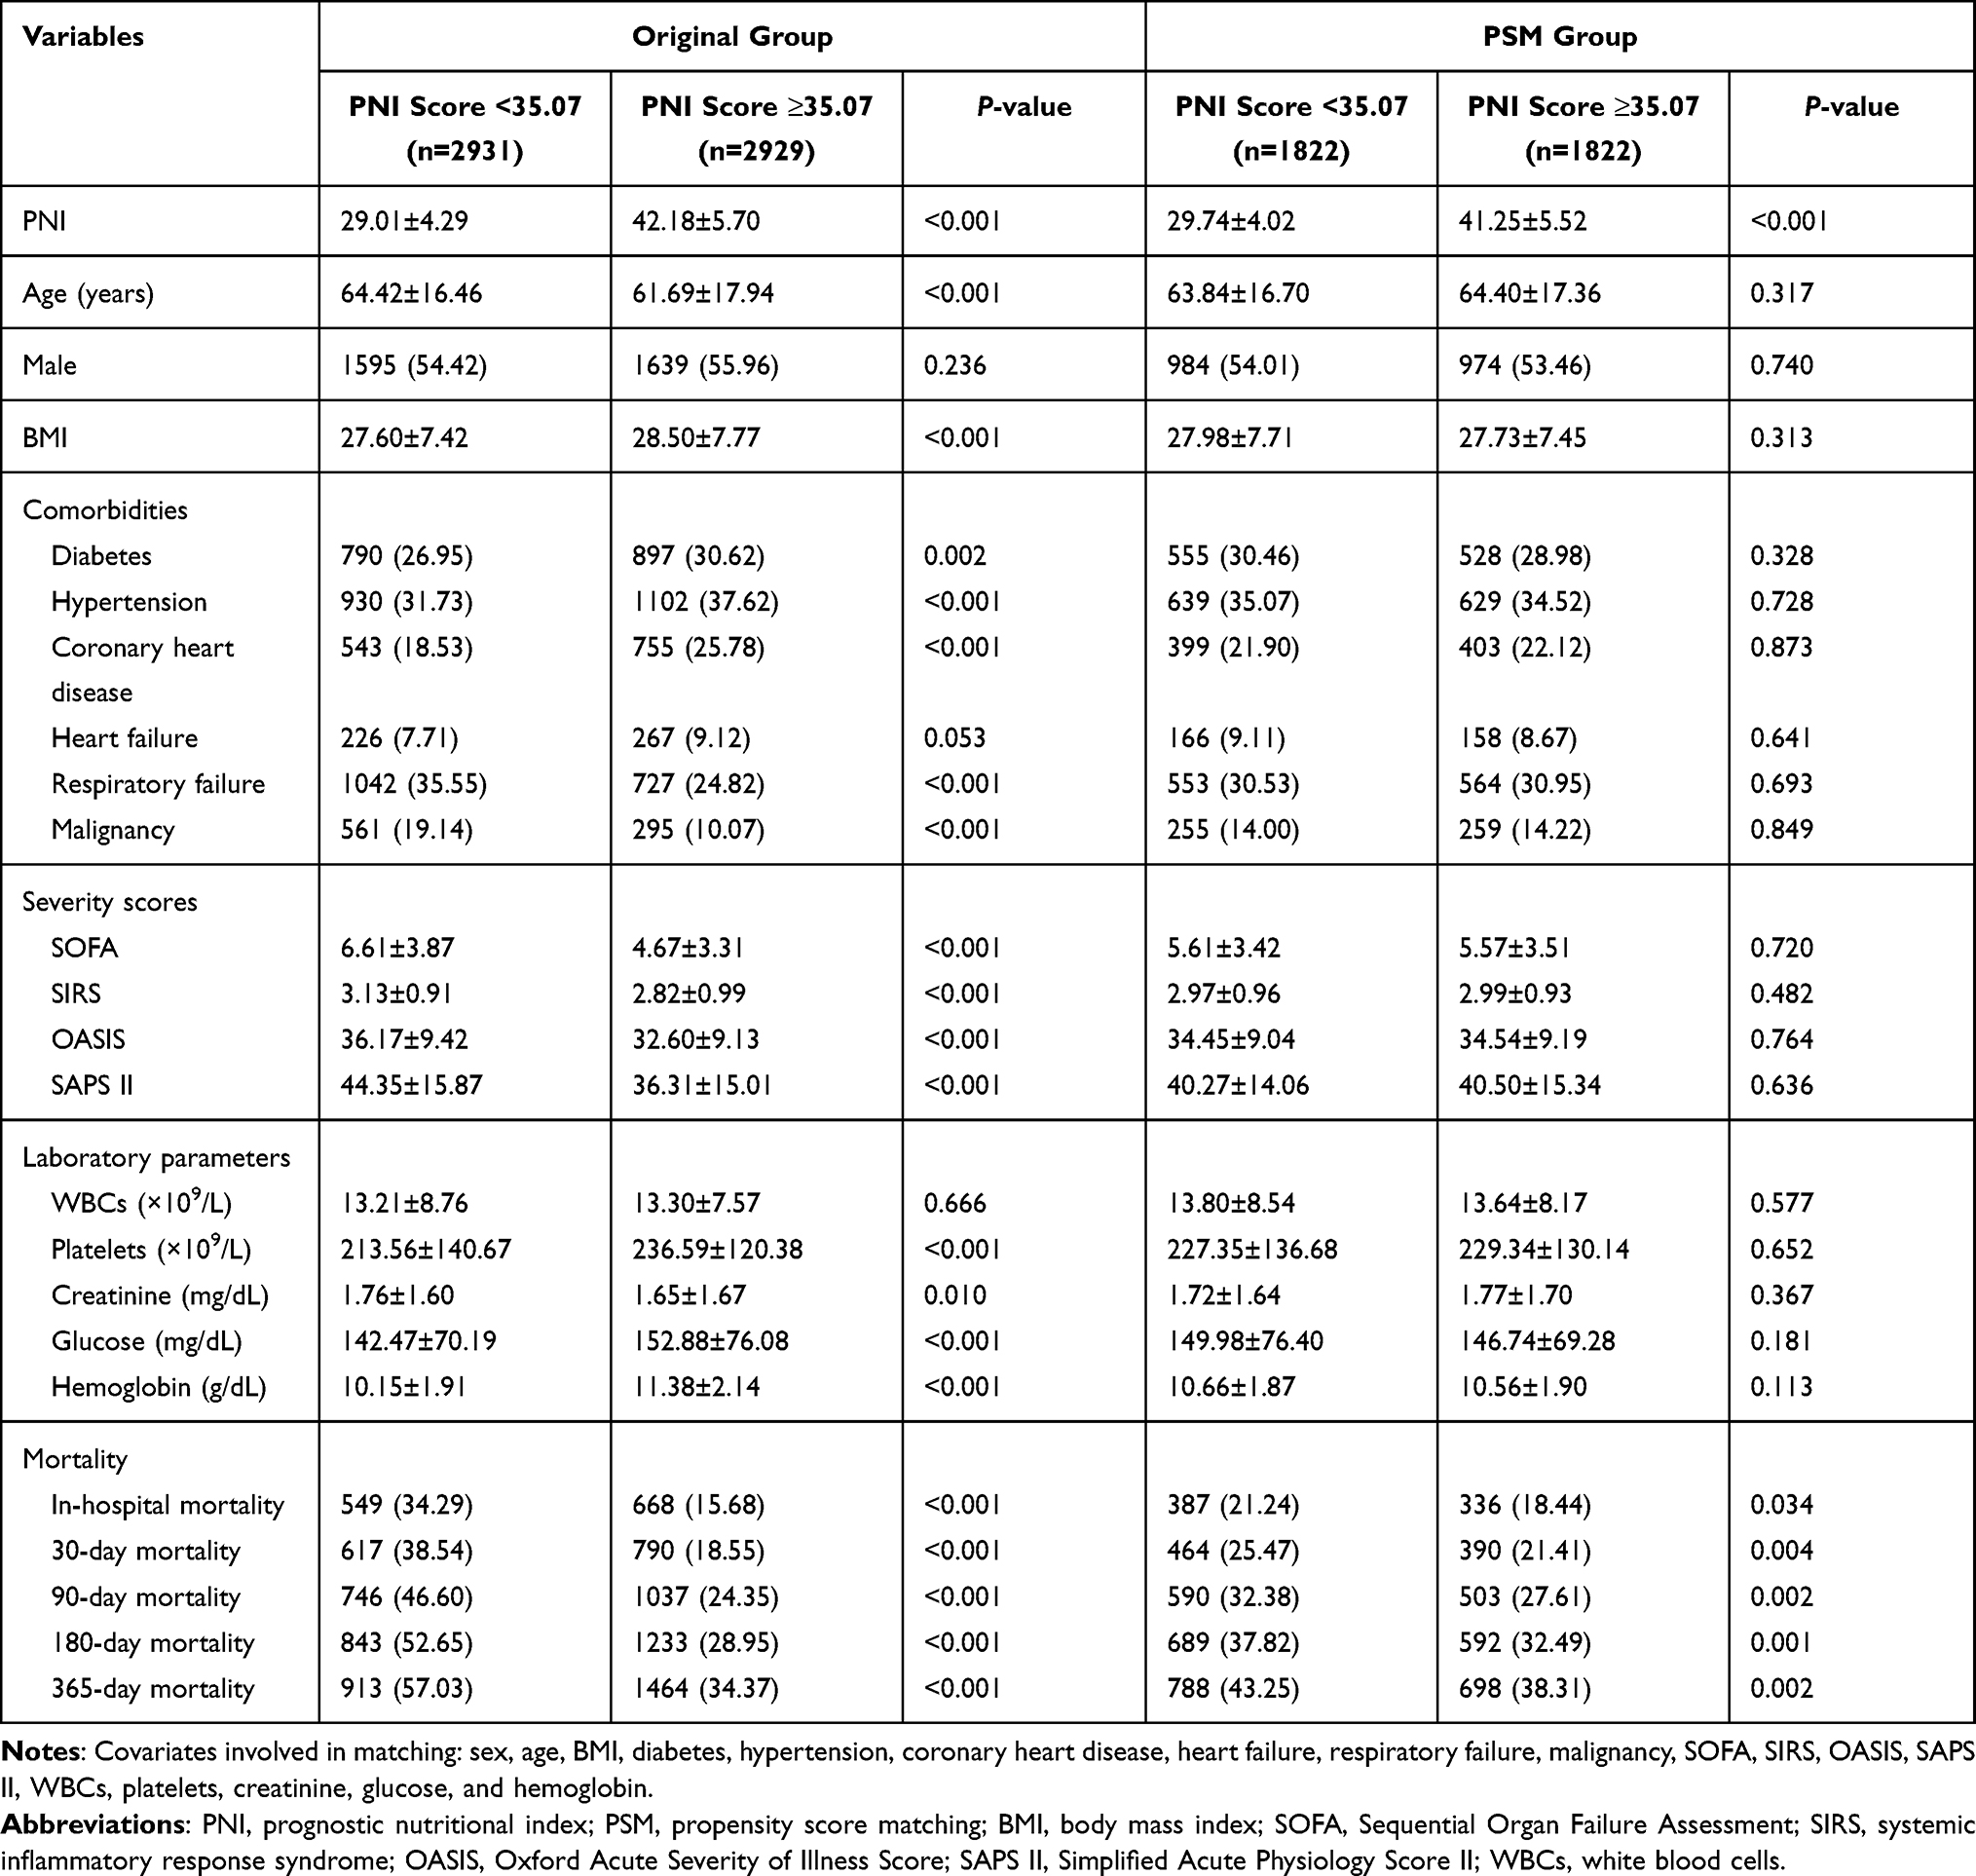 |
Table 1 Correlation of the Prognostic Nutritional Index with Baseline Characteristics |
Association Between the PNI and Primary Outcomes
In this study, the in-hospital mortality rate for critically ill patients was 20.77%. There was a significant difference in in-hospital mortality between patients with a high and low PNI score. ROC curve analysis revealed that PNI has potential predictive value for the prognosis of critically ill patients. (Figure 1).
 |
Figure 1 ROC curve of the PNI in predicting in-hospital mortality of critically ill patients in the original group (n=5860). |
We used PSM to balance the covariates. After the matching was completed, 1822 cases in each of the high– and low–PNI score groups were included in the cohort analysis, which eliminated the interference of the covariates. As shown in Table 1, there significant differences remained in the in-hospital mortality between the high– and low–PNI score groups in the PSM group.
In the original group, we established three models to examine whether a low PNI is an independent risk factor for in-hospital mortality among critically ill patients using logistic regression (Table 2). Model I was unadjusted, and the OR (95% CI) value of the low–PNI score group was 2.292 (2.009–2.616). Model II, which was adjusted for age, sex, and BMI, showed similar results (OR, 2.233; 95% CI, 1.955–2.552). Based on model II, the covariates involved in the adjustment were added to model III, including comorbidities (diabetes, hypertension, coronary heart disease, heart failure, respiratory failure, and malignancy), severity scores (SOFA, SIRS, OASIS, and SAPS II), and laboratory parameters (WBC count, platelet count, serum creatinine, blood glucose, and hemoglobin). The results of model III still showed that a low PNI score was an independent risk factor for in-hospital mortality in critically ill patients. The same three models were applied to the PSM group, and the results were also statistically significant.
 |
Table 2 Association Between the Prognostic Nutritional Index and Primary Outcomes |
Association Between the PNI and Secondary Outcomes
The Kaplan–Meier curve showed a significant difference between the low– and high–PNI score groups for 30-, 90-, 180-, and 365-day all-cause mortality (Figure 2). We used the Cox regression model to estimate the hazard ratios (HRs) (95% CIs) of an unadjusted low–PNI score on 30-, 90-, 180-, and 365-day all-cause mortality. After adjusting for sex, age, BMI, diabetes, hypertension, coronary heart disease, heart failure, respiratory failure, malignancy, SOFA, SIRS, OASIS, SAPS II, WBC count, platelet count, serum creatinine, blood glucose, and hemoglobin, a low PNI score was still an independent risk factor for 30-, 90-, 180-, and 365-day all-cause mortality (Table 3).
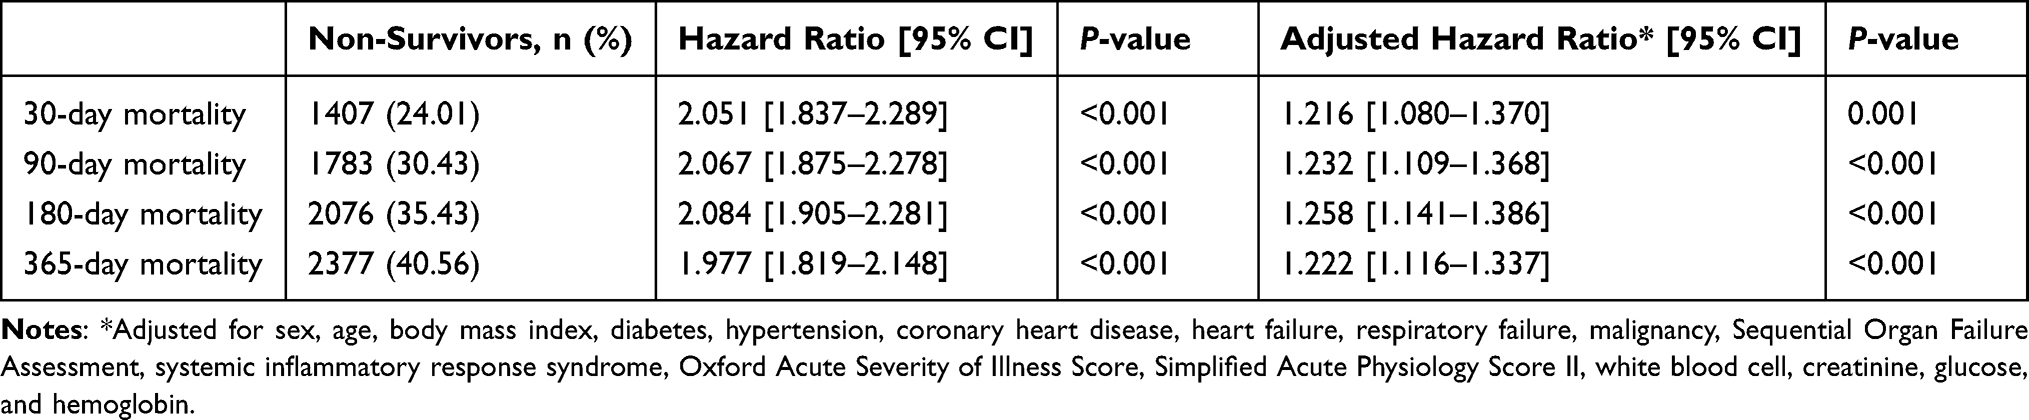 |
Table 3 Association Between the Prognostic Nutritional Index and Secondary Outcomes in the Original Group (n=5860) |
 |
Figure 2 Kaplan–Meier survival curves for 30-, 90-, 180-, and 365-day mortality according to the PNI in the original group (n=5860). (A) 30-day mortality; (B) 90-day mortality; (C) 180-day mortality; (D) 365-day mortality. |
Discussion
The present study investigated the relationship between the PNI and all-cause mortality in critically ill patients. From the baseline characteristics of the enrolled subjects in this study, it can be seen that there are significant differences in age, BMI, severity scores, comorbidities, and laboratory parameters between the high– and low–PNI score groups. After balancing these covariates using PSM, this study still found that the in-hospital, short-term, and long-term mortalities of critically ill patients in the low–PNI score group were higher than those in the high–PNI score group, indicating that the PNI score can independently affect the prognosis of critically ill patients.
To the best of our knowledge, this is the first study on the prognostic value of the prognostic nutritional index in critically ill patients. The possible mechanism of a low PNI score leading to poor survival in critically ill patients remains unclear. Some studies have reported that a potential reason for the association between PNI and patient prognosis is that low serum albumin indicates that the patient is malnourished.26 However, serum albumin has a long half-life and is not a sensitive indicator of acute changes in nutritional status, and its applicability in critically ill patients has not been certified. Therefore, Society of Critical Care Medicine (SCCM) and American Society for Parenteral and Enteral Nutrition (ASPEN) do not recommend albumin as a nutritional evaluation indicator.27 Most evidence proves that changes in serum albumin do not reflect the nutritional status of the patient, but the severity of the disease.28 Albumin is regulated by pro-inflammatory cytokines and is inhibited in the state of systemic inflammation.29 Therefore, it is more sensitive to acute inflammation. Lymphocytes constitute another determining factor of the PNI score and their importance in the human immune system has been confirmed by some studies.30,31 The severity of inflammation often determines the outcome of critically ill patients,32 with the number of lymphocytes being negatively correlated with the progression of inflammation.33 Therefore, the reason PNI is an independent risk factor for the prognosis of critically ill patients is that it reflects the patient’s immune status and disease severity.
The commonly used comprehensive evaluation scales for critically ill patients, such as SAPS II score and SOFA score, require evaluators to have specialized training due to the complexity of calculation and subjectivity of evaluation. Even so, it is difficult to avoid subjective differences between evaluators. The PNI is derived from two routine laboratory tests, serum albumin and lymphocyte count, which are objective and can eliminate errors between evaluators. Clinicians can easily assess the patient’s condition and promptly carry out clinical interventions to reduce the risk of mortality. However, whether exogenous infusion of albumin improves the prognosis of critically ill patients is controversial,34 but it is generally accepted that controlling inflammation can improve the prognosis.35,36 Therefore, increasing the PNI score via managing inflammation may be an effective means of clinical intervention.
This study used a large sample from the MIMIC-III database and minimized bias using PSM. However, there are still some limitations. First, as a single-center retrospective study, there may be unavoidable bias in the results. Second, the balanced covariates in the research are limited and there may be other covariates that could affect the results. Third, this study only included PNI scores obtained within 24 hours of the patient’s first admission to the ICU, which reflects the baseline level. Whether a dynamic change in the PNI score during ICU treatment affects patient prognosis remains unknown. Therefore, the conclusion needs to be verified by a well-designed, prospective, multi-center, randomized controlled study.
Conclusions
The PNI score is an independent risk factor for all-cause mortality in critically ill patients, where a low PNI score is associated with increased mortality. However, further well-designed, prospective, multi-center studies are needed to confirm our results.
Abbreviations
BMI, body mass index; CI, confidence interval; HR, hazard ratio; ICU, intensive care unit; MIMIC-III, Medical Information Mart for Intensive Care III database; OASIS, Oxford Acute Severity of Illness Score; OR, odds ratio; PNI, prognostic nutritional index; PSM, propensity score matching; ROC, receiver operating characteristic; SAPS II, Simplified Acute Physiology Score II; SIRS, systemic inflammatory response syndrome; SOFA, Sequential Organ Failure Assessment; WBC, white blood cell.
Data Sharing Statement
The datasets supporting the conclusions of this article are included in the MIMIC-III database (https://mimic.physionet.org/).
Ethics Approval and Consent to Participate
According to the data usage agreement, author Yan Lu (certification number: 35953547) is authorized to obtain detailed information, including information on patient care and treatment, from the database without the need for additional ethical review or approval.
Author Contributions
All authors made substantial contributions to conception and design, acquisition of data, or analysis and interpretation of data; took part in drafting the article or revising it critically for important intellectual content; agreed to submit to the current journal; gave final approval of the version to be published; and agree to be accountable for all aspects of the work.
Funding
This research did not receive any specific grant from funding agencies in the public, commercial, or not-for-profit sectors.
Disclosure
The authors declare that they have no competing interests.
References
1. Manning J, Cefalu JE. Infection in the critically ill older adult. Crit Care Nurs Clin North Am. 2017;29(1):25–35. doi:10.1016/j.cnc.2016.09.008
2. Huysentruyt K, De Schepper J, Vanbesien J, Vandenplas Y. Albumin and pre-albumin levels do not reflect the nutritional status of female adolescents with restrictive eating disorders. Acta Paediatr. 2016;105(4):e167–169. doi:10.1111/apa.13312
3. Bouillanne O, Hay P, Liabaud B, Duché C, Cynober L, Aussel C. Evidence that albumin is not a suitable marker of body composition-related nutritional status in elderly patients. Nutrition. 2011;27(2):165–169. doi:10.1016/j.nut.2009.12.007
4. Chen D, Bao L, Lu SQ, Xu F. Serum albumin and prealbumin predict the poor outcome of traumatic brain injury. PLoS One. 2014;9(3):e93167. doi:10.1371/journal.pone.0093167
5. Yin M, Si L, Qin W, et al. Predictive value of serum albumin level for the prognosis of severe sepsis without exogenous human albumin administration: a Prospective Cohort Study. J Intensive Care Med. 2018;33(12):687–694. doi:10.1177/0885066616685300
6. Abubakar S, Sabir A, Ndakotsu M, Imam M, Tasiu M. Low admission serum albumin as prognostic determinant of 30-day case fatality and adverse functional outcome following acute ischemic stroke. Pan Afr Med J. 2013;14:53. doi:10.11604/pamj.2013.14.53.1941
7. Correa-Rodríguez M, Pocovi-Gerardino G. The prognostic nutritional index and nutritional risk index are associated with disease activity in patients with systemic lupus erythematosus. Nutrients. 2019;11(3):638. doi:10.3390/nu11030638
8. Onodera T, Goseki N, Kosaki G. [Prognostic nutritional index in gastrointestinal surgery of malnourished cancer patients]. Nihon Geka Gakkai Zasshi. 1984;85(9):1001–1005. (Japanese).
9. Yoo YJ, Kang CM, Choi M, et al. Preoperative prognostic nutritional index as an independent prognostic factor for resected ampulla of Vater cancer. PLoS One. 2020;15(3):e0229597. doi:10.1371/journal.pone.0229597
10. Caputo F, Dadduzio V, Tovoli F, et al. The role of PNI to predict survival in advanced hepatocellular carcinoma treated with Sorafenib. PLoS One. 2020;15(5):e0232449. doi:10.1371/journal.pone.0232449
11. Mirili C, Yılmaz A, Demirkan S, Bilici M, Basol Tekin S. Clinical significance of prognostic nutritional index (PNI) in malignant melanoma. Int J Clin Oncol. 2019;24(10):1301–1310. doi:10.1007/s10147-019-01461-7
12. Bruixola G, Caballero J, Papaccio F, et al. Prognostic Nutritional Index as an independent prognostic factor in locoregionally advanced squamous cell head and neck cancer. ESMO Open. 2018;3(6):e000425. doi:10.1136/esmoopen-2018-000425
13. Johnson AE, Pollard TJ, Shen L, et al. MIMIC-III, a freely accessible critical care database. ScI Data. 2016;3:160035. doi:10.1038/sdata.2016.35
14. Barbieri S, Kemp J, Perez-Concha O, et al. Benchmarking deep learning architectures for predicting readmission to the ICU and describing patients-at-risk. Sci Rep. 2020;10(1):1111. doi:10.1038/s41598-020-58053-z
15. McWilliams CJ, Lawson DJ, Santos-Rodriguez R, et al. Towards a decision support tool for intensive care discharge: machine learning algorithm development using electronic healthcare data from MIMIC-III and Bristol, UK. BMJ Open. 2019;9(3):e025925. doi:10.1136/bmjopen-2018-025925
16. Jia L, Cui S, Yang J, et al. Red blood cell distribution width predicts long-term mortality in critically ill patients with acute kidney injury: a retrospective database study. Sci Rep. 2020;10(1):4563. doi:10.1038/s41598-020-61516-y
17. Jamison DC. Structured Query Language (SQL) fundamentals. Curr Protoc Bioinform. 2003;Chapter 9:
18. Ahtiala M, Soppi E, Saari TI. Sequential organ failure assessment (SOFA) to predict pressure ulcer risk in intensive care patients: a Retrospective Cohort Study. Ostomy Wound Manage. 2018;64(10):32–38.
19. Balk RA. Systemic inflammatory response syndrome (SIRS): where did it come from and is it still relevant today? Virulence. 2014;5(1):20–26. doi:10.4161/viru.27135
20. Chen Q, Zhang L, Ge S, He W, Zeng M. Prognosis predictive value of the Oxford Acute Severity of Illness Score for sepsis: a retrospective cohort study. PeerJ. 2019;7:e7083. doi:10.7717/peerj.7083
21. Allyn J, Ferdynus C, Bohrer M, Dalban C, Valance D, Allou N. Simplified acute physiology score II as predictor of mortality in intensive care units: a decision curve analysis. PLoS One. 2016;11(10):e0164828. doi:10.1371/journal.pone.0164828
22. Shi WK, Zhang XH, Zhang J, et al. Predictive ability of prognostic nutritional index in surgically resected gastrointestinal stromal tumors: a propensity score matching analysis. Jpn J Clin Oncol. 2019;49(9):823–831. doi:10.1093/jjco/hyz078
23. Tafeit E, Cvirn G, Lamprecht M. Using body mass index ignores the intensive training of elite special force personnel. Exp Biol Med. 2019;244(11):873–879. doi:10.1177/1535370219848986
24. Benedetto U, Head SJ, Angelini GD, Blackstone EH. Statistical primer: propensity score matching and its alternatives. Eur J Cardiothorac Surg. 2018;53(6):1112–1117. doi:10.1093/ejcts/ezy167
25. Barakat A, Mittal A, Ricketts D, Rogers BA. Understanding survival analysis: actuarial life tables and the Kaplan-Meier plot. Br J Hosp Med. 2019;80(11):642–646. doi:10.12968/hmed.2019.80.11.642
26. Eckart A, Struja T, Kutz A, et al. Relationship of nutritional status, inflammation, and serum albumin levels during acute illness: a Prospective Study. Am J Med. 2020;133(6):713–722.e717. doi:10.1016/j.amjmed.2019.10.031
27. McClave SA, Taylor BE, Martindale RG, et al. Guidelines for the provision and assessment of nutrition support therapy in the adult critically ill patient: society of Critical Care Medicine (SCCM) and American Society for Parenteral and Enteral Nutrition (A.S.P.E.N.). JPEN J Parenter Enteral Nutr. 2016;40(2):159–211. doi:10.1177/0148607115621863
28. de Mutsert R, Grootendorst DC, Indemans F, Boeschoten EW, Krediet RT, Dekker FW. Association between serum albumin and mortality in dialysis patients is partly explained by inflammation, and not by malnutrition. J Ren Nutr. 2009;19(2):127–135. doi:10.1053/j.jrn.2008.08.003
29. Hirahara N, Tajima Y, Fujii Y, et al. Prognostic nutritional index as a predictor of survival in resectable gastric cancer patients with normal preoperative serum carcinoembryonic antigen levels: a propensity score matching analysis. BMC Cancer. 2018;18(1):285. doi:10.1186/s12885-018-4201-4
30. Majewska M, Szczepanik M. [The role of Toll-like receptors (TLR) in innate and adaptive immune responses and their function in immune response regulation]. Postepy Hig Med Dosw. 2006;60:52–63. (Danish).
31. McCullough KC, Summerfield A. Basic concepts of immune response and defense development. ILAR J. 2005;46(3):230–240. doi:10.1093/ilar.46.3.230
32. Djordjevic D, Rondovic G, Surbatovic M. Neutrophil-to-lymphocyte ratio, monocyte-to-lymphocyte ratio, platelet-to-lymphocyte ratio, and mean platelet volume-to-platelet count ratio as biomarkers in critically ill and injured patients: which ratio to choose to predict outcome and nature of bacteremia? Mediators Inflamm. 2018;2018:3758068. doi:10.1155/2018/3758068
33. Moro-García MA, Mayo JC, Sainz RM, Alonso-Arias R. Influence of Inflammation in the process of T lymphocyte differentiation: proliferative, metabolic, and oxidative changes. Front Immunol. 2018;9:339. doi:10.3389/fimmu.2018.00339
34. Das UN. Albumin infusion for the critically ill--is it beneficial and, if so, why and how? Crit Care. 2015;19(1):156. doi:10.1186/s13054-015-0862-4
35. Armstrong BA, Betzold RD, May AK. Sepsis and septic shock strategies. Surg Clin North Am. 2017;97(6):1339–1379.
36. Lineberry C, Stein DE. Infection, sepsis, and immune function in the older adult receiving critical care. Crit Care Nurs Clin North Am. 2014;26(1):47–60. doi:10.1016/j.ccell.2013.09.009
 © 2021 The Author(s). This work is published and licensed by Dove Medical Press Limited. The
full terms of this license are available at https://www.dovepress.com/terms
and incorporate the Creative Commons Attribution
- Non Commercial (unported, 3.0) License.
By accessing the work you hereby accept the Terms. Non-commercial uses of the work are permitted
without any further permission from Dove Medical Press Limited, provided the work is properly
attributed. For permission for commercial use of this work, please see paragraphs 4.2 and 5 of our Terms.
© 2021 The Author(s). This work is published and licensed by Dove Medical Press Limited. The
full terms of this license are available at https://www.dovepress.com/terms
and incorporate the Creative Commons Attribution
- Non Commercial (unported, 3.0) License.
By accessing the work you hereby accept the Terms. Non-commercial uses of the work are permitted
without any further permission from Dove Medical Press Limited, provided the work is properly
attributed. For permission for commercial use of this work, please see paragraphs 4.2 and 5 of our Terms.