Back to Journals » Clinical, Cosmetic and Investigational Dermatology » Volume 11
The relationship between mitotic rate and depth of invasion in biopsies of malignant melanoma
Authors Ghasemi Basir HR ![]() , Alirezaei P
, Alirezaei P ![]() , Ahovan S, Moradi A
, Ahovan S, Moradi A
Received 30 November 2017
Accepted for publication 17 January 2018
Published 16 March 2018 Volume 2018:11 Pages 125—130
DOI https://doi.org/10.2147/CCID.S158043
Checked for plagiarism Yes
Review by Single anonymous peer review
Peer reviewer comments 2
Editor who approved publication: Dr Jeffrey Weinberg
Hamid Reza Ghasemi Basir,1,2 Pedram Alirezaei,2 Sara Ahovan,3 Abbas Moradi3
1Department of Pathology, School of Medicine, Hamadan University of Medical Sciences, Hamadan, Iran; 2Psoriasis Research Center, Hamadan University of Medical Sciences, Hamadan, Iran; 3School of Medicine, Hamadan University of Medical Sciences, Hamadan, Iran
Background: Malignant melanoma of the skin is a potentially lethal neoplasm that generally originates from atypical melanocytes in the dermal–epidermal junction. When the neoplasm penetrates into the dermis, several variables can affect the extent of its spread, among which depth of invasion has the most important prognostic value. Mitotic rate is another prognostic factor that reflects the biological behavior of the neoplasm.
Objective: This study was designed to evaluate the probable relationship between the depth of invasion of malignant melanoma and its mitotic rate.
Materials and methods: This study was performed on 50 excisional biopsy specimens that had received the diagnosis of malignant melanoma histopathologically. Tumor characteristics including Breslow thickness, Clark level, T-stage, and tumor mitotic rate were recorded.
Results: We observed that at higher Clark levels and higher T-stages, and the mean mitotic rate was significantly increased. Moreover, there was a positive and significant correlation between Breslow thickness and mitotic rate. We demonstrated that one unit increase in mitotic rate was correlated with 0.8 mm increase in Breslow thickness of the tumor.
Conclusion: In malignant melanoma, mitotic activity may probably indicate the depth of tumor invasion. Therefore, in incisional biopsies where depth of invasion cannot be accurately determined, the mitotic activity may be used to estimate Breslow thickness, which is necessary for planning surgical management.
Keywords: melanoma, mitosis, Breslow, invasion, thickness, proliferation
Introduction
Malignant melanoma generally originates from proliferation of atypical melanocytes in the dermal–epidermal junction. Several variables have been related with melanoma prognosis, and Breslow thickness is probably one of the most important prognostic factors.1 Moreover, tumor thickness has been linked to several factors such as its proliferation rate.2 In fact, several studies have proposed that Breslow thickness and the number of mitoses per square millimeter should be considered as important predictors of survival.3–5 Initially a mitotic rate greater than 6/mm2 was described as significant,6 but Azzola et al7 showed that there was no statistically significant differences in patient prognosis when mitotic rate goes beyond 1 mitosis/mm2. Mitotic activity may also be used as a predictor of the ability of thin melanomas to metastasize.8 In recent melanoma staging systems, a single mitosis per square millimeter is considered important, and can upstage thin melanomas from pT1a to pT1b.9 Finally, interobserver agreement for melanoma mitotic rate has been shown to be excellent.10
In planning surgical management for primary cutaneous melanoma, measurement of Breslow thickness is quite necessary; however, this variable is difficult to be accurately measured in incisional biopsies. We hypothesized that in these circumstances mitotic rate may provide useful information about depth of invasion and thus facilitate the rough estimation of Breslow thickness.
The aim of this study was to examine the relationship between mitotic rate and indicators of tumor invasion depth (Breslow thickness, Clark’s level, and T-staging).
Materials and methods
This study was performed on 50 excisional biopsies that had previously received the diagnosis of malignant melanoma histopathologically. The study was approved by Ethics Committee of Hamadan University of Medical Sciences, and written informed consent was obtained from all individuals involved in the study. Of total 62 cases, two were excluded from the study because of having melanoma smaller than 1 mm2. Four were excluded due to inappropriately stained slides in which their paraffin-embedded blocks were not available. Another six patients were also excluded due to involvement of surgical margins in excised samples. Thus, a total of 50 cases remained in the study.
Demographic characteristics of the patients including age and gender, as well as anatomic location of the tumor and its pathologic characteristics (tumor subtype, lymphovascular invasion, and tumor thickness) were recorded. Histopathologic slides of the patients that were prepared with a 4 µm thickness were reviewed at 400× magnification (high-power field [HPF]) using Labomed microscope for evaluation of mitosis. Mitotic rate was evaluated by scanning the histopathologic sections for the region of maximum mitotic activity, which had more cellular atypia (the so-called “hotspot”). Counting the number of mitosis was started from this region and then expanded centrifugally, until an area of 1 mm2 was achieved. Calibration of scope was performed by means of high-resolution etched glass calibration scale to calculate the area of an HPF. The HPF of Labomed microscope is equal to 0.1589 mm2. Seven HPFs were evaluated to record mitotic rate per square millimeter for each sample. Thick or inappropriately stained slides that were not suitable for counting of mitosis were recut using paraffin-embedded blocks. If the total area of the lesion was smaller than 1 mm2, the sample was excluded from the study.
T-stages of TNM classification were defined as T1: <1 mm, T2: 1.01–2.0 mm, T3: 2.01–4.0 mm, and T4: >4 mm.9
Breslow thickness was measured as the distance between the top of granular layer and the deepest extension of the tumor. In ulcerated lesions, the measurement was from the base of the ulcer overlying the deepest portion of tumor invasion. The lesions were classified into five levels based on Breslow thickness: <0.75 mm (Breslow level I), 0.75–1.49 mm (Breslow level II), 1.50–2.25 mm (Breslow level III), 2.26–3.0 mm (Breslow level IV), and >3.0 mm (Breslow level V).11 The lesions were also categorized into five levels based on Clark’s level of invasion: lesions confined to the epidermis (melanoma in situ): level I, invasion of the lesion to papillary dermis: level II, invasion of the lesion to the papillary–reticular dermal interface: level III, invasion of the lesion to the reticular dermis: level IV and invasion of the lesion into subcutaneous fat: level V.12
Two forms of lymphovascular invasion were also recognized: 1) invasions in which tumor cells reside within blood or lymphatic vessels and 2) invasions in which tumor cells present within the vessel walls (next to the endothelium). The presence of either of these forms was recorded as lymphovascular invasion of the tumor.
Results
Of 50 patients included in this study, 56% were male. The mean and standard deviation for patients’ age was 68.64±13.02 years (minimum 16 and maximum 92 years).
The most common type of melanoma was nodular (50%), followed by acral lentiginous melanoma (34%), lentigo maligna melanoma (12%), and superficial spreading melanoma (4%). The most common anatomical location was lower extremity (44%), followed by head (38%), upper extremity (14%), neck (2%), and trunk (2%).
The mean and standard deviation for mitotic rate was 1.47±1.94 mitoses/mm2 (minimum 0 and maximum 4 mitoses/mm2). According to Kolmogorov–Smirnov test, the distribution of mitotic rate data was normal (P>0.05).
The results of one-way analysis of variance (ANOVA) test showed a significant difference between the mean mitosis in different T-stages. As the stage increased, the mitotic rate also increased (Table 1). Furthermore, the results of Tukey’s post hoc test showed a significant difference between means of mitotic rate at different stages of T.
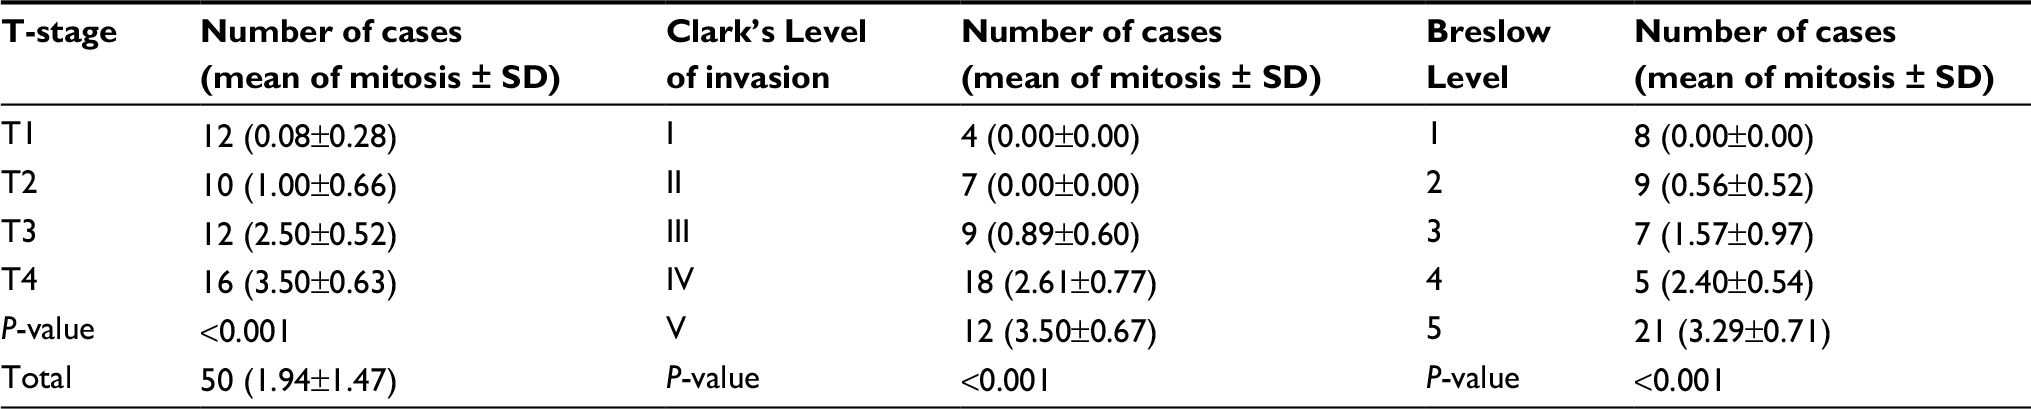 | Table 1 Comparison of average mitotic activity at different stages of T-classification and different levels of Clark and Breslow in patients with malignant melanoma
|
The results of one-way ANOVA test represented statistically significant difference between means of mitosis in different levels of Clark. As Clark’s level increased, the mitotic rate also increased (Table 1). The results of Tukey’s post hoc test also revealed that there is statistically significant difference between mitotic scores of all different Clark’s levels of invasion, with the exception that no significant difference was seen between Clark’s levels I and II as well as between Clark’s levels II and III. In fact, the difference between each level with two levels above itself was statistically significant among five Clark’s levels.
The results of one-way ANOVA test showed a significant difference between mean of mitosis in different Breslow levels. As the level increased, the mitotic score also increased (Table 1). On the basis of the results of Tukey’s test, there was statistically significant difference between mitotic scores of Breslow levels 1 and 2 with levels 3, 4 and 5. A significant difference was also observed between mitotic scores of level 3 with levels 1, 2 and 5. Furthermore, there was a significant difference between mitotic scores of level 4 with levels 1 and 2, and level 5 with levels 1, 2 and 3.
Pearson’s correlation test was used to determine the correlation between mitosis and Breslow thickness. Our results showed that there was a positive and significant correlation between these two variables. One unit increase in mitotic rate was shown to be correlated with 0.8 mm increase in Breslow thickness of the tumor (r=+0.8, P<0.001).
We also categorized mitotic activity into three different levels (0–1 mitosis/mm2, 2–3 mitosis/mm2, and >4 mitosis/mm2). The results of χ2 test showed a statistically significant difference between different levels of mitosis at different T-stages (Table 2). As T-stage increased, the level of mitosis also increased (P<0.001).
 | Table 2 Comparison of different levels of mitosis at different stages of T-classification, different levels of Clark, and different levels of Breslow in patients with malignant melanoma |
The results of χ2 test also revealed a statistically significant difference between different levels of mitosis at different Clark’s levels (Table 2). As Clark’s level of invasion increased, the level of mitosis also increased (P<0.001).
In addition, the results of χ2 test showed a statistically significant difference between different levels of mitosis at different levels of Breslow (Table 2). As Breslow level increased, the level of mitosis also increased (P<0.001).
Of fifty biopsy specimens, 16 had vascular invasion. Mean and standard deviation of mitosis in specimens with and without vascular invasion was 3.00±0.89 and 1.44±1.44, respectively. There was a significant difference between mean mitotic rate of two groups (t=3.97, df=48, P<0.001).
Fisher’s exact test showed a statistically significant difference between different levels of mitosis in the specimens with and without dissemination to lymphatic vessels (Table 3). As mitotic level increased, the risk of lymphatic invasion also increased (P=0.003).
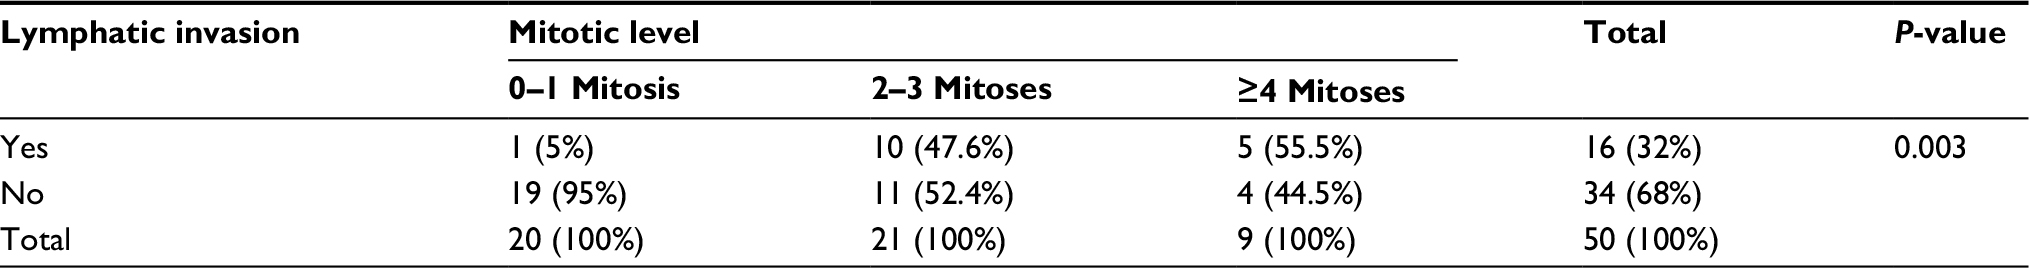 | Table 3 Comparison of different levels of mitosis in the specimens with and without lymphatic invasion |
Discussion
In recent years, there has been a growing interest in malignant melanoma probably due to its increasing incidence and high mortality. Melanoma of the skin is undoubtedly the most fatal skin cancer that arises from pigment cells residing in epidermal basal layer.13 This neoplasm may spread for months or years in the epidermis, but when it penetrates into the dermis several variables can affect its dissemination.14 Since treatment plans for patients with malignant melanoma are based on accurate staging, it is necessary to recognize several factors that contribute in this regard. Furthermore, staging may provide valuable information about patient prognosis.15 Breslow thickness, tumor stage based on TNM classification, Clark’s level of invasion, mitotic activity, presence or absence of regression, and presence or absence of inflammatory cells infiltration are among several variables that may affect prognosis.16 As Breslow thickness is necessary for planning surgical management of malignant melanoma, it should be included in every histopathologic report with melanoma diagnosis.17 Breslow depth may be accurately measured in excisional biopsies, while incisional biopsies may not allow the precise estimation of this important variable. We tried to find a correlation between mitotic activity (which reflects the biologic behavior of the tumor) and its depth of invasion to guess Breslow thickness in incisional biopsies (where the precise estimation of tumor depth may be difficult).
We found a statistically significant relationship between mean mitotic activity and Clark’s and Breslow levels, as well as various stages of T-classification. At higher Clark’s and Breslow levels and higher T-stages, the mean mitotic rate increased. We demonstrated that one unit increase in mitosis per square millimeter was correlated with 0.8 mm increase in Breslow depth of invasion.
Clark in his study expressed mitotic activity as one of the three major prognostic factors in addition to tumor thickness and lymphocytic infiltration. He concluded that by increasing mitotic activity and tumor thickness, the stage of the disease may increase.6 The results of our study support his findings.
Niezabitowski et al18 also revealed that the expression of Ki-67 and proliferating cell nuclear antigens, along with tumor thickness, tumor stage, tumor level of invasion, macroscopic pattern of tumor, invasion to vasculature, ulceration, and expression of HMB-45 could all affect survival. It is worth mentioning that Ki-67 and proliferating cell nuclear antigens are markers of cell proliferation, and their recognition by immunohistochemistry may reflect mitotic activity of the tumor.19 It has recently been shown by Ladstein et al20 that Ki-67 expression is even a more important prognostic factor than mitotic rate in nodular malignant melanomas. They demonstrated that mitotic rate and Ki-67 expression were both correlated positively with tumor thickness, tumor necrosis, and tumor ulceration; however, Ki-67 had a greater impact on prognosis. They also found that mitotic activity and ki-67 expression were directly related to Clark’s level of invasion and invasion to vasculature.20 Findings of Ladstein20 study are in agreement with our findings; however, we did not perform immunohistochemistry to assess the expression of Ki-67. This might not be a great issue, since several studies have conflicting results on the significance of Ki-67 expression as an independent prognostic factor in malignant melanoma.21,22 Ohsie et al23 have recommended that Ki-67 may be used to distinguish benign melanocytic lesions from malignant melanoma, but they believe that this marker has limited value as an indicator of prognosis.
Naraghi et al24 also examined a total of 47 histopathological slides from patients with primary malignant melanoma, and found that 55.3% had no mitosis, 23.4% had 1–6 mitoses, and 12.8% had ≥7 mitoses per HPF. Mean number of mitosis in samples with ulceration was significantly higher than those without ulceration. They showed that when Breslow thickness exceeds 1.7 mm and mitotic count exceeds 6, a significant drop in 10-year survival ensues. They also observed that mitotic rate in specimens with vascular invasion was significantly higher than those without vascular invasion; a finding that is consistent with the results of our study.24
Our findings may have implications regarding surgical management of cutaneous melanoma. When the likelihood of melanoma is clinically high, and the size and anatomic location of the lesion allow, excisional biopsy followed by radicalization for widening of surgical margins (according to the depth of invasion) is the best biopsy technique. However, in large lesions of face, hands, and feet, when the clinical suspicion is low and excisional biopsy requires an expanded surgery, incisional biopsy may be performed before radical surgery for definite diagnosis.25–27 In these conditions, because of lack of information about actual depth of tumor, the minimum depth of invasion can be estimated from the maximum mitotic activity in the specimen. If the incisional biopsy is taken from the center of the lesion in the most elevated area, it may be possible to roughly estimate the mitotic activity, and subsequently the depth of invasion. It is worth mentioning that sometimes “hotspot” may be located in the deep invasive margin of the tumor, but according to Vollmer study on probability distribution of mitotic counts in melanoma and the fact that “hotspots” are events of low probability, mitotic rate of incisional specimens seems to be comparable to excisional ones.28 Most publications suggest that lesions with Breslow thickness <2 mm might be treated with lateral excision margins of 10–20 mm. For tumors with Breslow thickness between 2 and 4 mm, the recommended margin is 20 mm. For thicker tumors (Breslow thickness >4 mm), a 20–30 mm lateral margin is recommended.29 As our findings show, all samples with 0–1 mitosis/mm2 had Breslow levels ≤3, which means their Breslow thickness is ≤2.25 mm. Therefore, it can be concluded that in the presence of 0–1 mitosis/mm2, the excision of the lesion should be done with maximum 20 mm lateral margin. In other words, by assessing the number of mitosis per square millimeter in an incisional biopsy specimen, one can roughly estimate the depth of invasion, which is an essential variable for planning surgical management. However, in incisional biopsies, the estimation of mitotic rate has to be interpreted with caution. It is clear that further large-scale studies are needed in this regard, since our sample size was relatively small.
Conclusion
In patients with malignant melanoma, mitotic activity along with other histopathological characteristics can indicate the depth of tumor invasion. Therefore, in incisional biopsies of melanoma, where actual depth of the tumor cannot be measured, mitotic activity might be used to roughly estimate the depth of invasion.
Acknowledgment
This study was conducted based on the approved MD thesis of Sara Ahovan (number of thesis: 9504011669), and we would like to thank the vice chancellor for Research and Technology at Hamadan University of Medical Sciences for thesis approval.
Disclosure
The authors report no conflicts of interest in this work.
References
Vollmer RT, Seigler HF. Using a continuous transformation of the Breslow thickness for prognosis in cutaneous melanoma. Am J Clin Pathol. 2001;115:205–212. | ||
León P, Daly JM, Synnestvedt M, Schultz DJ, Elder DE, Clark WH Jr. The prognostic implications of microscopic satellites in patients with clinical stage I melanoma. Arch Surg. 1991;126:1461–1468. | ||
Schmoeckel C, Bockelbrink A, Bockelbrink H, Braun-Falco O. Low- and high-risk malignant melanoma – II. Multivariate analyses for a prognostic classification. Eur J Cancer Clin Oncol. 1983;19:237–243. | ||
Kopf AW, Gross DF, Rogers GS, et al. Prognostic index for malignant melanoma. Cancer. 1987;59:1236–1241. | ||
Ramsay JA, From L, Iscoe NA, Kahn HJ. MIB-1 proliferative activity is a significant prognostic factor in primary thick cutaneous melanomas. J Invest Dermatol. 1995;105:22–26. | ||
Clark JWH, Elder DE, Guerry IVD, et al. Model predicting survival in stage I melanoma based on tumor progression. J Natl Cancer Inst. 1989;81:1893–1904. | ||
Azzola MF, Shaw HM, Thompson JF, et al. Tumor mitotic rate is a more powerful prognostic indicator than ulceration in patients with primary cutaneous melanoma. Cancer. 2003;97:1488–1498. | ||
Kesmodel SB, Karakousis GC, Botbyl JD, et al. Mitotic rate as a predictor of sentinel lymph node positivity in patients with thin melanomas. Ann Surg Oncol. 2005;12:449–458. | ||
Balch CM, Gershenwald JE, Soong SJ, et al. Final version of 2009 AJCC melanoma staging and classification. J Clin Oncol. 2009;27:6199–6206. | ||
Scolyer RA, Shaw HM, Thompson JF, et al. Interobserver reproducibility of histopathologic prognostic variables in primary cutaneous melanomas. Am J Surg Pathol. 2003;27:1571–1576. | ||
Breslow A. Thickness, cross-sectional areas and depth of invasion in the prognosis of cutaneous melanoma. Ann Surg. 1970;172:902. | ||
Morton DL, Davtyan DG, Wanek LA, Foshag LJ, Cochran AJ. Multivariate analysis of the relationship between survival and the microstage of primary melanoma by Clark level and Breslow thickness. Cancer. 1993;71:3737–3743. | ||
Testa U, Castelli G, Pelosi E. Melanoma: genetic abnormalities, tumor progression, clonal evolution and tumor initiating cells. Med Sci. 2017;5:28. | ||
Balch CM, Soong SJ, Gershenwald JE, et al. Prognostic factors analysis of 17,600 melanoma patients: validation of the American Joint Committee on Cancer melanoma staging system. J Clin Oncol. 2001;19:3622–3634. | ||
Gershenwald JE, Scolyer RA, Hess KR, et al. Melanoma staging: evidence-based changes in the American Joint Committee on Cancer eighth edition cancer staging manual. CA Cancer J Clin. 2017;67:472–492. | ||
Garbe C, Eigentler TK, Bauer J, et al. Histopathological diagnostics of malignant melanoma in accordance with the recent AJCC classification 2009: review of the literature and recommendations for general practice. J Dtsch Dermatol Ges. 2011;9:690–699. | ||
Ruiter DJ. Clinical and pathologic diagnosis, staging and prognostic factors of melanoma and management of primary disease. Curr Opin Oncol. 1992;4:357–367. | ||
Niezabitowski A, Czajecki K, Ryś J, et al. Prognostic evaluation of cutaneous malignant melanoma: a clinicopathologic and immunohistochemical study. J Surg Oncol. 1999;70:150–160. | ||
Reddy VB, Gattuso P, Aranha G, Carson HJ. Cell proliferation markers in predicting metastases in malignant melanoma. J Cutan Pathol. 1995;22:248–251. | ||
Ladstein RG, Bachmann IM, Straume O, Akslen LA. Ki-67 expression is superior to mitotic count and novel proliferation markers PHH3, MCM4 and mitosin as a prognostic factor in thick cutaneous melanoma. BMC Cancer. 2010;10:140. | ||
Henrique R, Azevedo R, Bento MJ, Domingues JC, Silva C, Jerónimo C. Prognostic value of Ki-67 expression in localized cutaneous malignant melanoma. J Am Acad Dermatol. 2000;43:991–1000. | ||
Moretti S, Spallanzani A, Chiarugi A, Fabiani M, Pinzi C. Correlation of Ki-67 expression in cutaneous primary melanoma with prognosis in a prospective study: different correlation according to thickness. J Am Acad Dermatol. 2001;44:188–192. | ||
Ohsie SJ, Sarantopoulos GP, Cochran AJ, Binder SW. Immunohistochemical characteristics of melanoma. J Cutan Pathol. 2008;35:433–444. | ||
Naraghi ZS, Bahadori M, Ehsani A, Robati RM, Ghiasi M, Nozan Z. Evaluation of primary cutaneous malignant melanoma according to Breslow and Clarke pathological indices. Tehran Univ Med J. 2006;64:79–86. | ||
Fernandes NC, Calmon R, Maceira JP, Cuzzi T, Claudio da Silva CS. Melanoma cutâneo: estudo prospectivo de 65 casos Cutaneous melanoma: prospective study of 65 cases. An Bras Dermatol. 2005;80:25–34. | ||
Karimipour DJ, Schwartz JL, Wang TS, et al. Microstaging accuracy after subtotal incisional biopsy of cutaneous melanoma. J Am Acad Dermatol. 2005;52:798–802. | ||
Mun GH. Management of malignant melanoma. Arch Plast Surg. 2012;39:565–574. | ||
Vollmer RT. A probabilistic analysis of mitotic counts in melanoma. Am J Clin Pathol. 2014;141:213–218. | ||
Orzan OA, Sandru A, Jecan CR. Controversies in the diagnosis and treatment of early cutaneous melanoma. J Med Life. 2015;8:132–141. |
 © 2018 The Author(s). This work is published and licensed by Dove Medical Press Limited. The
full terms of this license are available at https://www.dovepress.com/terms
and incorporate the Creative Commons Attribution
- Non Commercial (unported, 3.0) License.
By accessing the work you hereby accept the Terms. Non-commercial uses of the work are permitted
without any further permission from Dove Medical Press Limited, provided the work is properly
attributed. For permission for commercial use of this work, please see paragraphs 4.2 and 5 of our Terms.
© 2018 The Author(s). This work is published and licensed by Dove Medical Press Limited. The
full terms of this license are available at https://www.dovepress.com/terms
and incorporate the Creative Commons Attribution
- Non Commercial (unported, 3.0) License.
By accessing the work you hereby accept the Terms. Non-commercial uses of the work are permitted
without any further permission from Dove Medical Press Limited, provided the work is properly
attributed. For permission for commercial use of this work, please see paragraphs 4.2 and 5 of our Terms.