Back to Journals » Diabetes, Metabolic Syndrome and Obesity » Volume 12
The relationship between hypertriglyceridemic-waist phenotype and vitamin D status in type 2 diabetes
Received 3 February 2019
Accepted for publication 6 March 2019
Published 23 April 2019 Volume 2019:12 Pages 537—543
DOI https://doi.org/10.2147/DMSO.S204062
Checked for plagiarism Yes
Review by Single anonymous peer review
Peer reviewer comments 2
Editor who approved publication: Prof. Dr. Juei-Tang Cheng
Chun-Ming Ma, Fu-Zai Yin
Department of Endocrinology, The First Hospital of Qinhuangdao, Qinhuangdao 066000, Hebei Province, People’s Republic of China
Background: The aim of the study was to explore the relationship between hypertriglyceridemic-waist (HTW) phenotype and vitamin D status in type 2 diabetes.
Methods: A cross-sectional study was conducted in subjects with type 2 diabetes. This study enrolled 338 type 2 diabetic (190 males and 148 females). The HTW phenotype was defined as serum triglyceride concentrations ≥1.7 mmol/L and waist circumference ≥90 cm (male) and 85 cm (female). Multiple logistic regression models were used for modeling relationships between HTW phenotype and vitamin D status.
Results: The prevalence of HTW phenotype was 36.4%. The prevalence of HTW phenotype was 10.5%, 27.2%, and 41.6% in type 2 diabetes with vitamin D sufficiency, vitamin D insufficiency, and vitamin D deficiency, respectively. In multiple logistic regression analysis, subjects with vitamin D deficiency were more likely to have HTW phenotype (OR=6.222, 95%CI: 1.307–29.620, P=0.022) compared with subjects with vitamin D sufficiency.
Conclusions: There was a significant correlation between HTW phenotype and vitamin D status in type 2 diabetes.
Keywords: hypertriglyceridemic-waist phenotype, vitamin D status, type 2 diabetes
Background
Humans get vitamin D from exposure to sunlight, from their diet, and from dietary supplements.1 Growing scientific evidence has implicated vitamin D deficiency is very common.2–4 The classical role of vitamin D is about bone health. Vitamin D maintains bone health and prevents fall and fracture. Vitamin D also has a potential role in the prevention of nonskeletal disorders such as auto-immune disease, cancer, mental health problems, and cardiovascular disease.5–8 Vitamin D deficiency was more common in diabetics compared with controls.9 Vitamin D deficiency was associated with the macrovascular complications, microvascular complications, and peripheral neuropathy in type 2 diabetes.10–13
The hypertriglyceridemic-waist (HTW) phenotype is represented by the simultaneous presence of elevated serum triglyceride (TG) and increased waist circumference (WC) and was used as a screening tool to identify coronary artery disease.14 In a meta-analysis, HTW phenotype was very common and pooled prevalence has reached an alarming level (19%).15 HTW phenotype was also associated with abnormal glucose metabolism. In subjects without diabetes, HTW phenotype has more serious insulin resistance status and predicts the incidence of diabetes in the future.16–18 In diabetes, HTW phenotype has inappropriate blood glucose control, worse cardiovascular risk factor, and diabetic chronic complications, such as coronary artery disease and early diabetic nephropathy.19–21 Recently, Rashidbeygi et al, found that vitamin D deficiency was also strongly associated with the risk of HTW phenotype in apparently healthy adults.22 The aim of our study was to determine the relationship between HTW phenotype and vitamin D status in type 2 diabetes.
Methods
Subjects
After obtaining informed consent from subjects with type 2 diabetes a cross-sectional study was conducted. All subjects were recruited from the First Hospital of Qinhuangdao. All subjects were men and women over 18 years of age, with a diagnosis of type 2 diabetes (based on the American Diabetes Association diagnostic criteria).23 The exclusion criteria included the following: 1) subjects with type 1 diabetes, 2) subjects with clinical evidence of other endocrinopathy, such as Cushing’s syndrome, hyperthyroidism, et al, 3) subjects were taking medications known to affect lipid metabolism, such as glucocorticoids, fibrates, and statin, 4) subjects were taking vitamin D, 5) subjects with renal dysfunction (Estimate glomerular filtration rate (eGFR) less than 60 ml*min−1*1.73 m−2) or hepatic dysfunction(alanine aminotransferase (ALT) >100U/L), 6) pregnancy, and 7) subjects with acute and chronic inflammation. This study was approved by the ethics committee of the First Hospital of Qinhuangdao. All subjects provided written informed consent before study initiation. This study was conducted in accordance with the Declaration of Helsinki.
Measurements
Anthropometric measurements, including height, weight, and WC were obtained while the subjects were in light clothing and barefoot. Height and weight were measured to the nearest 0.1 cm and 0.1 kg, respectively. WC was accurately measured at the level of midway between the lowest rib and the top of the iliac crest. All measurements were taken twice, and the two measurements were averaged for analysis. Body mass index (BMI) was calculated by dividing weight (kg) by height squared (m2). Blood pressure was measured three times with a mercury sphygmomanometer while the subjects were seated after 10 mins of rest. Sociodemographic variables were collected and included: age, sex, duration of diabetes, family history of diabetes (FHD, defined as mothers, fathers, offsprings or siblings with type 2 diabetes), hypertension (subjects with history of hypertension or SBP and/or DBP ≥140/90 mmHg for three screenings), smoking and drinking status.
After a 10 hrs overnight fast, blood samples were collected from an antecubital vein into heparinized tubes. Fasting plasma glucose (FPG) concentration was measured using the glucose oxidase method, and serum lipid levels, as well as renal and hepatic function, were measured using enzymatic assays with an autoanalyzer (Hitachi, Tokyo, Japan). Glycosylated hemoglobin A1C (HbA1c) was measured by high-performance liquid chromatography. Serum 25-hydroxyvitamin D [25(OH)D] was measured using enzyme-linked immunosorbent assay (ELISA) kits produced by UK IDS Company. eGFR =175× creatinine (Cr, mg/dL)−1.234× age(year)−0.179(×0.79 if female).24
Definition
The HTW phenotype was defined as serum TG concentrations ≥1.7 mmol/L and WC ≥90 cm (male) and 85 cm (female).25 Subjects were categorized into four phenotype groups on the basis of the mentioned cutoffs: normal WC (<90 cm for male and <85 cm for female) and normal serum TG concentrations (<1.7 mmol/L); enlarged WC (≥90 cm for male and ≥85 cm for female) and normal serum TG concentrations (<1.7 mmol/L); normal WC (<90 cm for male and <85 cm for female) and elevated serum TG concentrations (≥1.7 mmol/L); and enlarged WC (≥90 cm for male and ≥85 cm for female) and elevated serum TG concentrations (≥1.7 mmol/L).
Vitamin D status
The nutritional status of VitD was assessed by circulating levels of 25(OH)D, vitamin D deficiency <50 nmol/L, vitamin D insufficiency 50–74.9 nmol/L, and vitamin D sufficiency ≥75nmol/L.26
Statistical analyses
All analyses were performed using the SPSS 11.5 statistical software (SPSS 11.5 for Windows; SPSS, Inc., Chicago, IL). Numerical variables were reported as mean ± standard deviation. Comparisons were conducted between groups using the ANOVA. Comparison of prevalence data was performed by X2 analysis. Multiple logistic regression models were used for modeling relationships between HTW phenotype and vitamin D status. P<0.05 was considered statistically significant.
Declarations
Ethics approval and consent to participate: This study was approved by the ethics committee of the First Hospital of Qinhuangdao. Written informed consent was obtained from all subjects/patients.
Results
This study enrolled 338 type 2 diabetics (190 males and 148 females), age 54.0±12.2 years, duration of diabetes 7.4±6.4 years. Among these subjects, 36.4% were characterized by the HTW phenotype. The prevalence of HTW phenotype was similar between males and females (males 37.4% vs females 35.1%, X2=0.179,P=0.672). The prevalence of HTW phenotype was higher in subjects with hypertension than subjects without hypertension (42.3% vs 31.7%, X2=3.995,P=0.046). Characteristics of subgroups classified on the basis of WC and TG levels are presented in Table 1. The age, duration of diabetes, FHD, smoking, and drinking between the four groups were similar (P>0.05). The level of BMI was significantly higher in group D than in group A and group C (P<0.05). The level of FPG was significantly higher in group D than in group A and group B (P<0.05). The level of HDL-C was significantly lower in group D than in groups A, B, and C (P<0.05). The level of ALT was significantly higher in group D than in group A and group B (P<0.05). The level of 25(OH)D was significantly lower in group D than in groups A, B, and C (P<0.05). The levels of SBP, DBP, HbA1c, Cr, and eGFR between the four groups were similar (P>0.05).
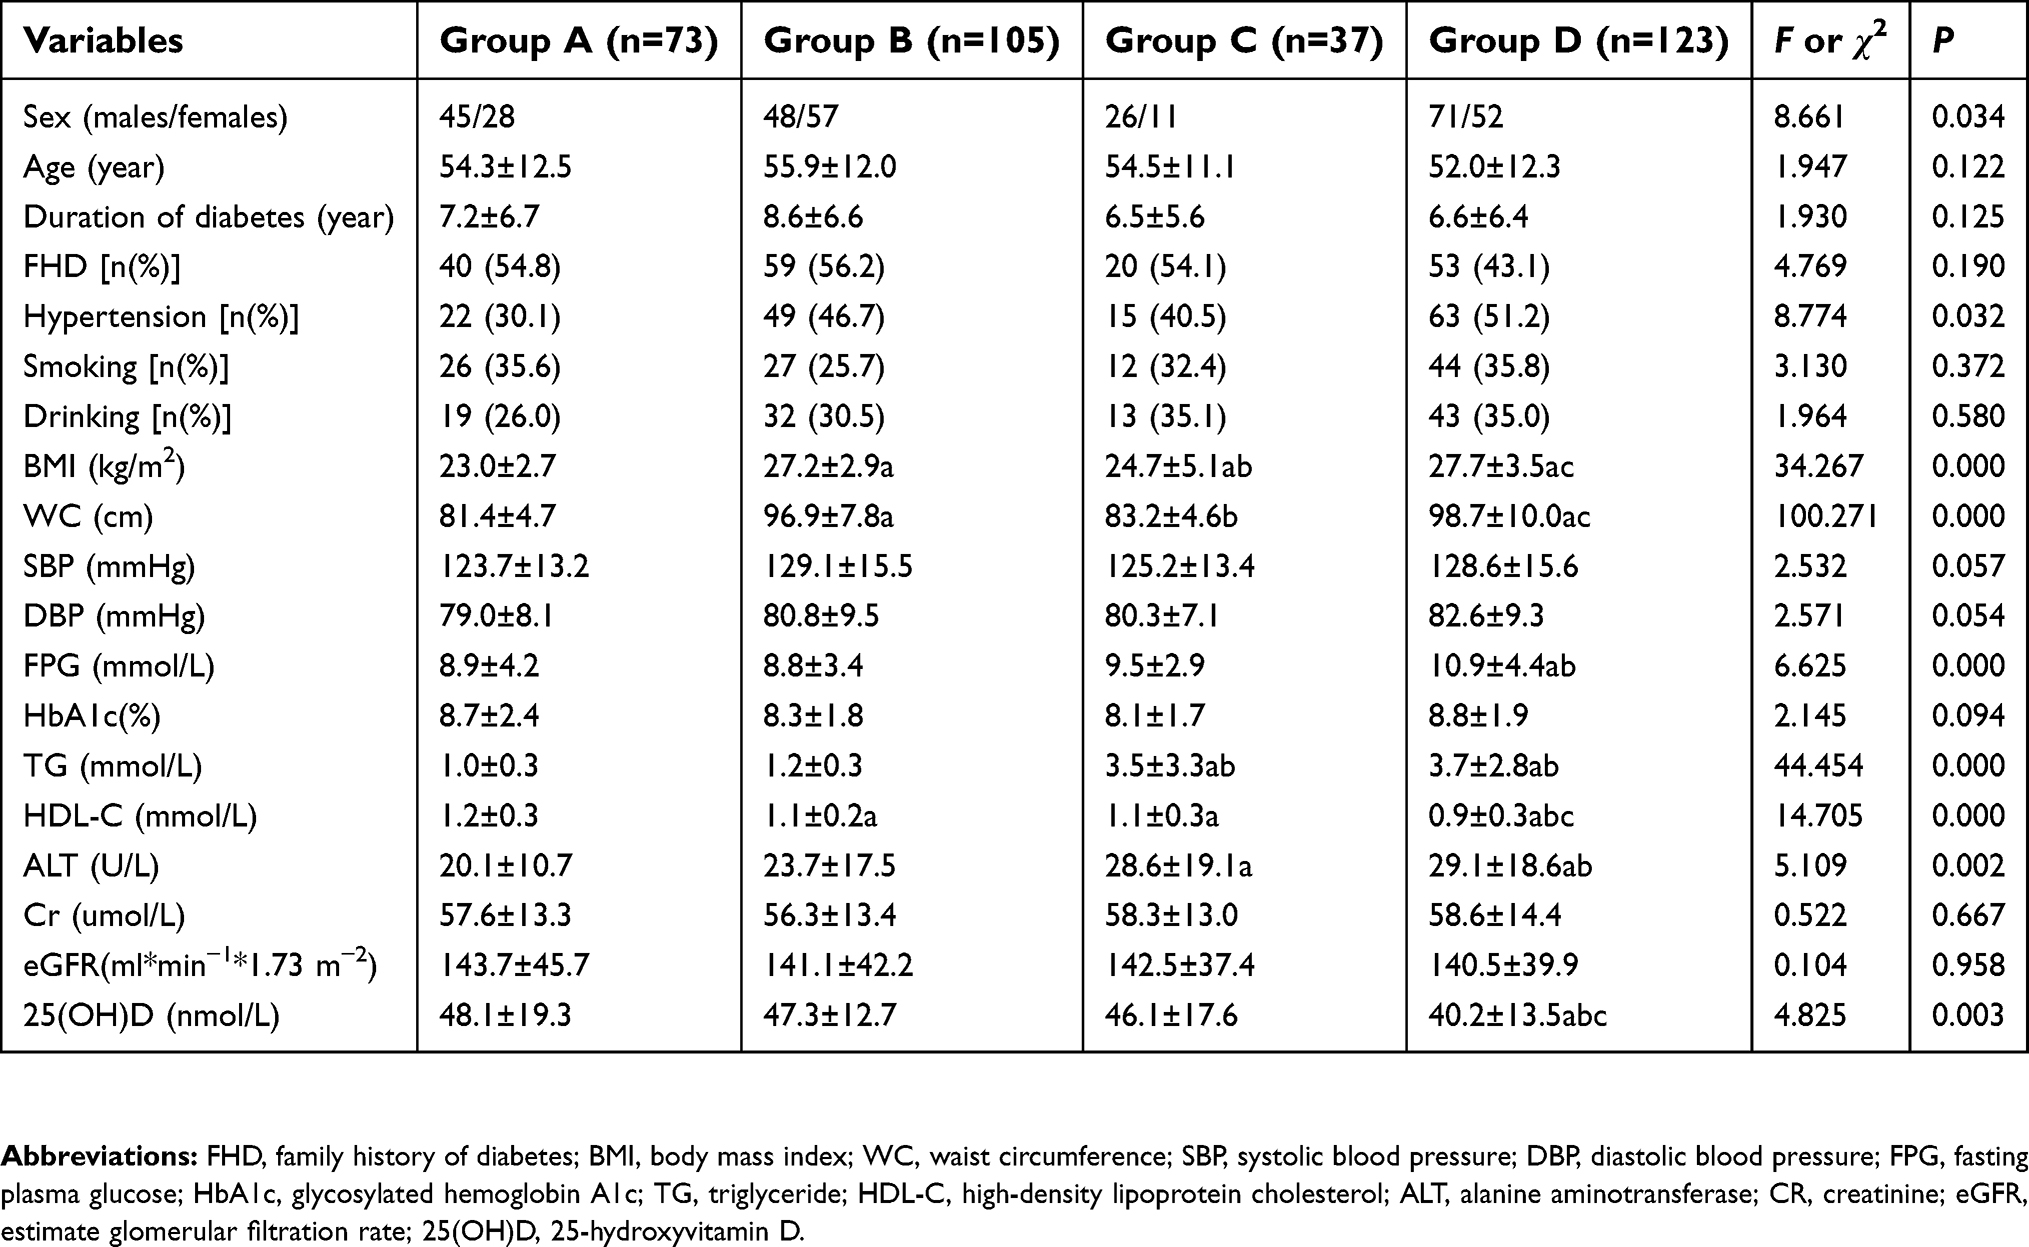 | Table 1 Characteristics of subjects with type 2 diabetes by phenotypes of serum triglyceride concentration and waist circumference |
Among these subjects, 23.9% were characterized by the vitamin D insufficiency and 70.4% were characterized by the vitamin D deficiency. Multivariate-adjusted odds ratios (ORs) [and 95% confidence intervals (CIs)] for HTW phenotype across different vitamin D status are shown in Table 2. The prevalence of HTW phenotype was 10.5%, 27.2%, and 41.6% in type 2 diabetes with vitamin D sufficiency, vitamin D insufficiency, and vitamin D deficiency, respectively. When HTW phenotype was considered as the dependent variables in a multiple logistic regression analysis with sex, age, duration of diabetes, FHD, hypertension, smoking, drinking, BMI, FPG, HbA1c, HDL-C, ALT, eGFR and vitamin D status as independent variables, subjects with vitamin D deficiency were more likely to have HTW phenotype [OR=6.222, 95%CI: 1.307–29.620, P=0.022] compared with subjects with vitamin D sufficiency.
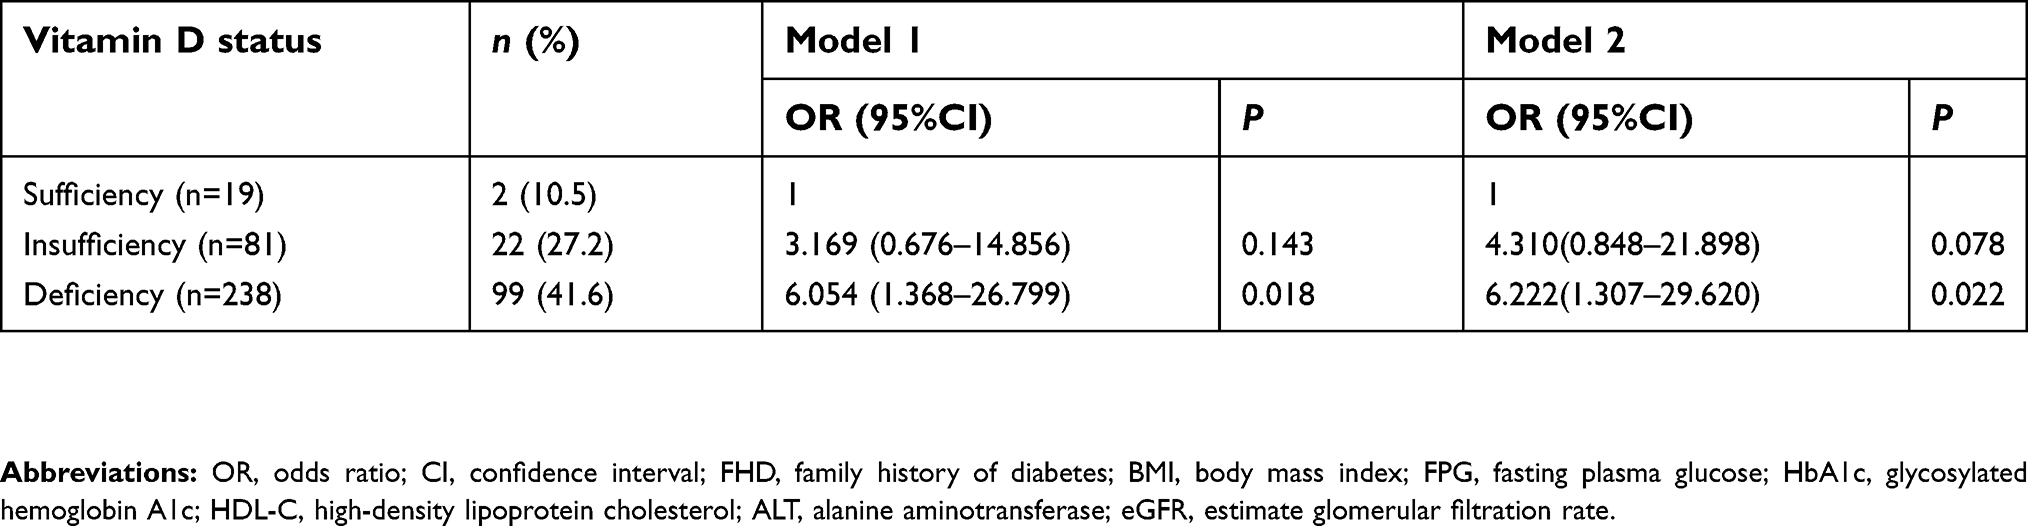 | Table 2 Prevalence of hypertriglyceridemic-waist phenotype across vitamin D status |
Discussion
Our study shows that the prevalence of HTW phenotype in type 2 diabetes was 36.4%, which is similar to the previous study.27 In the present study, the risk of HTW phenotype increased with the decline of vitamin D nutritional status. It has been observed that almost two-fifths of individuals in vitamin D deficiency had HTW phenotype. Nevertheless, the prevalence of HTW phenotype was only about one-tenth of people with sufficient vitamin D.
HTW phenotype was proposed by Lemieux I et al, in Canada and defined as serum TG concentrations ≥2.0 mmol/L and WC ≥90 cm (male).14 In our study, HTW phenotype was defined as serum TG concentrations ≥1.7 mmol/L and WC ≥90 cm (male) and 85 cm (female).25 The diagnostic criteria were based on the definition of metabolic syndrome proposed by the Chinese Diabetes Society. The diagnostic criteria were race specific and were epidemiological evidence based. The optimal cutoff of WC for abdominal obesity is 90 cm for men and 85 cm for women in Chinese.28 Chinese adults with TG ≥1.7 mmol/L is associated with a substantially higher risk for first cardiovascular disease.29 In another cohort study, subjects were categorized into three groups according to TG levels: <1.70 mmol/L, 1.70–2.25 mmol/L, and ≥2.26 mmol/L. The risk of diabetes has elevated in subjects with TG levels of 1.70–2.25 mmol/L.30
Over the past decade, there have been a lot of studies on the relationship between obesity, dyslipidemia, and vitamin D deficiency. The vitamin D deficiency was associated with obesity irrespective of age, latitude, cut-offs to define vitamin D deficiency, and the Human Development Index of the study location.31 Vitamin D deficiency was positively associated with both general and abdominal obesity.32 Serum 25(OH)D concentrations were also negatively associated with the risk of hypertriglyceridemia.33 Vitamin D deficiency in postmenopausal women was associated with a higher prevalence of hypertriglyceridemia.34 Low serum 25(OH)D levels are assocıated with hypertriglyceridemia in Turkish adult subjects.35
Interestingly, the level of 25(OH)D only decreased in HTW phenotype in our study. Although the levels of TG were similar between solely high TG group and HTW phenotype, and the levels of WC were similar between solely enlarged WC group and HTW phenotype. The levels of 25(OH)D in solely high TG and enlarged WC group were similar to subjects with normal WC and high TG level.
This could be due to the visceral fat. Vitamin D insufficiency and deficiency was correlated with higher visceral adipose.36 Vitamin D supplementation contributes to a beneficial reduction of visceral adipose tissue (VAT).37,38 WC is a substitution of visceral adiposity in adults.39 But individuals with enlarged WC do not always have excess VAT, because the accumulation of adipose tissue can be subcutaneous. Among obese adults, Visceral Fat Amount was positively associated with serum TG level.40 The use of high serum levels of TG in combination with the high WC, strengthens the association with VAT. Subjects with HTW phenotype had significantly higher visceral fat compared with subjects with solely enlarged WC in type 2 diabetes, despite similar age, BMI, and WC.41 In other words, vitamin D deficiency can promote visceral fat accumulation. Visceral fat accumulation can cause abdominal obesity and hypertriglyceridemia at the same time.
Active vitamin D exerts its biologic functions by binding to vitamin D receptor (VDR). Several studies have reported an association between vitamin D deficiency, VDR polymorphism and metabolic syndrome.42–44 Yu F et al, found that rs739837 was associated with TG accumulation in Chinese type 2 diabetes patients.45 Recently Sun H et al, reported that rs3847987 was also associated with elevated TG in the Chinese population.46 In the central-European population, allelic variants in VDR gene, FokI, and ApaI, are associated with reduced WC.47 The lack of significant differences between HTW patients with vitamin D insufficiency and HTW patients with vitamin D deficiency could be related to the presence of VDR polymorphisms. This may be due to a reduction of vitamin D signaling effectiveness in the presence of VDR polymorphisms.
However, there are limitations to our study. First, because of the cross-sectional design of this study, we could not identify the causal relationship between HTW phenotype and vitamin D deficiency. Second, almost 30% of individuals in vitamin D insufficiency had HTW phenotype. However, there was no statistical difference between vitamin D insufficiency and vitamin D sufficiency. Vitamin D insufficiency and vitamin D deficiency are very common. Vitamin D sufficiency as reference group was only 19 subjects (5.6%) in our study. We need a larger sample size to confirm the relationship between HTW phenotype and vitamin D insufficiency in the future. Third, the accuracy of vitamin D tests has a substantial impact on clinical estimates of the vitamin D status. The gold standard for this measurement is a liquid chromatography-tandem mass spectrometry (LC-MS/MS) method. The variability in 25(OH)D measurements was found both between-laboratories and between-assays.48–51 The use of an ELISA method for 25(OH)D is a limitation of our study. Fourth, VAT was not measured in our study.
Conclusions
In summary, there was a significant correlation between HTW phenotype and vitamin D deficiency in type 2 diabetes. Further work will be necessary to confirm whether vitamin D supplementation can prevent HTW phenotype.
Abbreviation list
HTW phenotype, hypertriglyceridemic-waist phenotype; FHD, family history of diabetes; BMI, body mass index; WC, waist circumference; SBP, systolic blood pressure; DBP, diastolic blood pressure; FPG, fasting plasma glucose; HbA1c, glycosylated hemoglobin A1c; TG, triglyceride; HDL-C, high-density lipoprotein cholesterol; ALT, alanine aminotransferase; CR, creatinine; eGFR, estimate glomerular filtration rate; 25(OH)D, 25-hydroxyvitamin D; VAT, visceral adipose tissue; VDR, vitamin D receptor; LC-MS/MS, Liquid Chromatography-Tandem Mass Spectrometry.
Author contributions
All authors contributed to data analysis, drafting and revising the article, gave final approval of the version to be published, and agree to be accountable for all aspects of the work.
Disclosure
The authors report no conflicts of interest in this work.
References
1. Holick MF. Vitamin D deficiency. N Engl J Med. 2007;357:266–281. doi:10.1056/NEJMra070553
2. Hirani V, Primatesta P. Vitamin D concentrations among people aged 65 years and over living in private households and institutions in England: population survey. Age Ageing. 2005;34:485–491. doi:10.1093/ageing/afi153
3. Parva NR, Tadepalli S, Singh P, et al. Prevalence of vitamin D deficiency and associated risk factors in the US population (2011–2012). Cureus. 2018;10:e2741.
4. Yu S, Fang H, Han J, et al. The high prevalence of hypovitaminosis D in China: a multicenter vitamin D status survey. Medicine (Baltimore). 2015;94:e585. doi:10.1097/MD.0000000000000874
5. Agmon-Levin N, Theodor E, Segal RM, Shoenfeld Y. Vitamin D in systemic and organ-specific autoimmune diseases. Clin Rev Allergy Immunol. 2013;45:256–266. doi:10.1007/s12016-012-8342-y
6. Feldman D, Krishnan AV, Swami S, Giovannucci E, Feldman BJ. The role of vitamin D in reducing cancer risk and progression. Nat Rev Cancer. 2014;14:342–357. doi:10.1038/nrc3691
7. Lerner PP, Sharony L, Miodownik C. Association between mental disorders, cognitive disturbances and vitamin D serum level: current state. Clin Nutr ESPEN. 2018;23:89–102. doi:10.1016/j.clnesp.2017.12.007
8. Norman PE, Powell JT. Vitamin D and cardiovascular disease. Circ Res. 2014;114:379–393. doi:10.1161/CIRCRESAHA.113.301241
9. Tahrani AA, Ball A, Shepherd L, Rahim A, Jones AF, Bates A. The prevalence of vitamin D abnormalities in South Asians with type 2 diabetes mellitus in the UK. Int J Clin Pract. 2010;64:351–355. doi:10.1111/j.1742-1241.2009.02221.x
10. Dziedzic EA, Gasior JS, Pawlowski M, Dabrowski M. Association of vitamin D deficiency and degree of coronary artery disease in cardiac patients with type 2 diabetes. J Diabetes Res. 2017;2017:3929075. doi:10.1155/2017/3929075
11. Luo BA, Gao F, Qin LL. The association between vitamin D deficiency and diabetic retinopathy in type 2 diabetes: a meta-analysis of observational studies. Nutrients. 2017;9:307. doi:10.3390/nu9030307
12. Usluogullari CA, Balkan F, Caner S, et al. The relationship between microvascular complications and vitamin D deficiency in type 2 diabetes mellitus. BMC Endocr Disord. 2015;15:33. doi:10.1186/s12902-015-0029-y
13. He R, Hu Y, Zeng H, et al. Vitamin D deficiency increases the risk of peripheral neuropathy in Chinese patients with type 2 diabetes. Diabetes Metab Res Rev. 2017;33:e2820. doi:10.1002/dmrr.v33.2
14. Lemieux I, Pascot A, Couillard C, et al. Hypertriglyceridemic waist: a marker of the atherogenic metabolic triad (hyperinsulinemia; hyperapolipoprotein B; small, dense LDL) in men? Circulation. 2000;102::179–184.
15. Ren Y, Luo X, Wang C, et al. Prevalence of hypertriglyceridemic waist and association with risk of type 2 diabetes mellitus: a meta-analysis. Diabetes Metab Res Rev. 2016;32:405–412. doi:10.1002/dmrr.v32.4
16. Ren Y, Liu Y, Sun X, et al. Hypertriglyceridemia-waist and risk of developing type 2 diabetes: the Rural Chinese Cohort Study. Sci Rep. 2017;7:9072. doi:10.1038/s41598-017-09136-x
17. Han KJ, Lee SY, Kim NH, et al. Increased risk of diabetes development in subjects with the hypertriglyceridemic waist phenotype: a 4-year longitudinal study. Endocrinol Metab (Seoul). 2014;29:514–521. doi:10.3803/EnM.2014.29.4.514
18. Janghorbani M, Amini M. Utility of hypertriglyceridemic waist phenotype for predicting incident type 2 diabetes: the Isfahan Diabetes Prevention Study. J Diabetes Investig. 2016;7:860–866. doi:10.1111/jdi.2016.7.issue-6
19. Radenkovic SP, Kocic RD, Pesic MM, et al. The hypertriglyceridemic waist phenotype and metabolic syndrome by differing criteria in type 2 diabetic patients and their relation to lipids and blood glucose control. Endokrynol Pol. 2011;62:316–323.
20. Ma CM, Wang R, Liu XL, Lu N, Lu Q, Yin FZ. The relationship between hypertriglyceridemic waist phenotype and early diabetic nephropathy in type 2 diabetes. Cardiorenal Med. 2017;7:295–300. doi:10.1159/000477828
21. de Graaf FR, Schuijf JD, Scholte AJ, et al. Usefulness of hypertriglyceridemic waist phenotype in type 2 diabetes mellitus to predict the presence of coronary artery disease as assessed by computed tomographic coronary angiography. Am J Cardiol. 2010;106:1747–1753. doi:10.1016/j.amjcard.2010.08.015
22. Rashidbeygi E, Rahimi MH, Mollahosseini M, et al. Associations of vitamin D status and metabolic dyslipidemia and hypertriglyceridemic waist phenotype in apparently healthy adults. Diabetes Metab Syndr. 2018;12:985–990. doi:10.1016/j.dsx.2018.06.010
23.
24. Xu Q, Li X, Gao B, et al. Comparative performance of four equations estimating glomerular filtration rate in adult Chinese diabetics. J Endocrinol Invest. 2013;36:293–297.
25. Society CD. Chinese guideline for type 2 diabetes. Chin J Endocrinol Metab. 2014;30:893–942.
26. Holick MF, Binkley NC, Bischoff-Ferrari HA, et al. Evaluation, treatment, and prevention of vitamin D deficiency: an Endocrine Society clinical practice guideline. J Clin Endocrinol Metab. 2011;96:1911–1930. doi:10.1210/jc.2011-0385
27. Ren Y, Zhang M, Zhao J, et al. Association of the hypertriglyceridemic waist phenotype and type 2 diabetes mellitus among adults in China. J Diabetes Investig. 2016;7:689–694. doi:10.1111/jdi.2016.7.issue-5
28. Bao Y, Lu J, Wang C, et al. Optimal waist circumference cutoffs for abdominal obesity in Chinese. Atherosclerosis. 2008;201:378–384. doi:10.1016/j.atherosclerosis.2008.03.001
29. Yali A, Wang J, Gong Q, et al. Hypertriglyceridemia predicts cardiovascular events in chinese adults: 23-year follow-up of Da Qing Diabetes and IGT Study (DQDIS). Diabetes. 2016;65:A367. doi:10.2337/db16-1375–1656
30. Wang W, Liu J, Sun JY, et al. [The association between the changes in triglyceride levels and the risk of incident type 2 diabetes mellitus: a 15 years followed-up results from the Chinese Multi-provincial Cohort Study]. Zhonghua Nei Ke Za Zhi. 2012;51:516–519.
31. Pereira-Santos M, Costa PR, Assis AM, Santos CA, Santos DB. Obesity and vitamin D deficiency: a systematic review and meta-analysis. Obes Rev. 2015;16:341–349. doi:10.1111/obr.2015.16.issue-4
32. Mansouri M, Miri A, Varmaghani M, et al. Vitamin D deficiency in relation to general and abdominal obesity among high educated adults. Eat Weight Disord. 2019;24:83–90. doi:10.1007/s40519-018-0511-4
33. Kim J. Association between serum vitamin D, parathyroid hormone and metabolic syndrome in middle-aged and older Korean adults. Eur J Clin Nutr. 2015;69:425–430. doi:10.1038/ejcn.2014.192
34. Schmitt EB, Nahas-Neto J, Bueloni-Dias F, Poloni PF, Orsatti CL, Petri Nahas EA. Vitamin D deficiency is associated with metabolic syndrome in postmenopausal women. Maturitas. 2018;107:97–102. doi:10.1016/j.maturitas.2017.11.001
35. Tosunbayraktar G, Bas M, Kut A, Buyukkaragoz AH. Low serum 25(OH)D levels are associated to higher BMI and metabolic syndrome parameters in adult subjects in Turkey. Afr Health Sci. 2015;15:1161–1169. doi:10.4314/ahs.v15i4.15
36. Zhang M, Li P, Zhu Y, et al. Higher visceral fat area increases the risk of vitamin D insufficiency and deficiency in Chinese adults. Nutr Metab (Lond). 2015;12:50. doi:10.1186/s12986-015-0046-x
37. Rosenblum JL, Castro VM, Moore CE, Kaplan LM. Calcium and vitamin D supplementation is associated with decreased abdominal visceral adipose tissue in overweight and obese adults. Am J Clin Nutr. 2012;95:101–108. doi:10.3945/ajcn.111.019489
38. Zhu W, Cai D, Wang Y, et al. Calcium plus vitamin D3 supplementation facilitated fat loss in overweight and obese college students with very-low calcium consumption: a randomized controlled trial. Nutr J. 2013;12:8. doi:10.1186/1475-2891-12-8
39. Borruel S, Molto JF, Alpanes M, et al. Surrogate markers of visceral adiposity in young adults: waist circumference and body mass index are more accurate than waist hip ratio, model of adipose distribution and visceral adiposity index. PLoS One. 2014;9:e114112. doi:10.1371/journal.pone.0114112
40. Huang CY, Huang HL, Yang KC, et al. Serum triglyceride levels independently contribute to the estimation of visceral fat amount among nondiabetic obese adults. Medicine (Baltimore). 2015;94:e965. doi:10.1097/MD.0000000000000874
41. Sam S, Haffner S, Davidson MH, et al. Hypertriglyceridemic waist phenotype predicts increased visceral fat in subjects with type 2 diabetes. Diabetes Care. 2009;32:1916–1920. doi:10.2337/dc09-0412
42. Karonova T, Grineva E, Belyaeva O, et al. Relationship between vitamin D status and vitamin D receptor gene polymorphisms with markers of metabolic syndrome among adults. Front Endocrinol (Lausanne). 2018;9:448. doi:10.3389/fendo.2018.00420
43. Sangkaew B, Nuinoon M, Jeenduang N. Association of vitamin D receptor gene polymorphisms with serum 25(OH)D levels and metabolic syndrome in Thai population. Gene. 2018;659:59–66. doi:10.1016/j.gene.2018.03.047
44. Hajj A, Chedid R, Chouery E, Megarbane A, Gannage-Yared MH. Relationship between vitamin D receptor gene polymorphisms, cardiovascular risk factors and adiponectin in a healthy young population. Pharmacogenomics. 2016;17:1675–1686. doi:10.2217/pgs-2016-0045
45. Yu F, Wang C, Wang L, et al. Study and evaluation the impact of vitamin D receptor variants on the risk of type 2 diabetes mellitus in Han Chinese. J Diabetes. 2017;9:275–284. doi:10.1111/1753-0407.12413
46. Sun H, Long SR, Li X, et al. Serum vitamin D deficiency and vitamin D receptor gene polymorphism are associated with increased risk of cardiovascular disease in a Chinese rural population. Nutr Res. 2019;61:13–21. doi:10.1016/j.nutres.2018.09.002
47. Bienertova-Vasku J, Zlamal F, Pohorala A, et al. Allelic variants in vitamin D receptor gene are associated with adiposity measures in the central-European population. BMC Med Genet. 2017;18:90. doi:10.1186/s12881-017-0454-z
48. Sempos CT, Vesper HW, Phinney KW, Thienpont LM, Coates PM, Vitamin DSP. Vitamin D status as an international issue: national surveys and the problem of standardization. Scand J Clin Lab Invest Suppl. 2012;243:32–40.
49. Mineva EM, Schleicher RL, Chaudhary-Webb M, et al. A candidate reference measurement procedure for quantifying serum concentrations of 25-hydroxyvitamin D(3) and 25-hydroxyvitamin D(2) using isotope-dilution liquid chromatography-tandem mass spectrometry. Anal Bioanal Chem. 2015;407:5615–5624. doi:10.1007/s00216-015-8491-y
50. Lai JK, Lucas RM, Banks E, Ponsonby AL;
51. Black LJ, Anderson D, Clarke MW, Ponsonby A-L, Lucas RM, Ramagopalan SV;
 © 2019 The Author(s). This work is published and licensed by Dove Medical Press Limited. The
full terms of this license are available at https://www.dovepress.com/terms
and incorporate the Creative Commons Attribution
- Non Commercial (unported, 3.0) License.
By accessing the work you hereby accept the Terms. Non-commercial uses of the work are permitted
without any further permission from Dove Medical Press Limited, provided the work is properly
attributed. For permission for commercial use of this work, please see paragraphs 4.2 and 5 of our Terms.
© 2019 The Author(s). This work is published and licensed by Dove Medical Press Limited. The
full terms of this license are available at https://www.dovepress.com/terms
and incorporate the Creative Commons Attribution
- Non Commercial (unported, 3.0) License.
By accessing the work you hereby accept the Terms. Non-commercial uses of the work are permitted
without any further permission from Dove Medical Press Limited, provided the work is properly
attributed. For permission for commercial use of this work, please see paragraphs 4.2 and 5 of our Terms.