Back to Journals » Diabetes, Metabolic Syndrome and Obesity » Volume 18
The Relationship Between Hemoglobin Levels and Proliferative Diabetic Retinopathy in Type 2 Diabetes Patients
Authors Ding Y ![]() , Hou Z, Mei M, Wu K, Tao L, Yang G
, Hou Z, Mei M, Wu K, Tao L, Yang G
Received 4 August 2025
Accepted for publication 18 November 2025
Published 3 December 2025 Volume 2025:18 Pages 4439—4447
DOI https://doi.org/10.2147/DMSO.S556952
Checked for plagiarism Yes
Review by Single anonymous peer review
Peer reviewer comments 2
Editor who approved publication: Dr Rebecca Baqiyyah Conway
Yu Ding,1,2 Zhengyu Hou,1 Mei Mei,1 Kaifeng Wu,1 Liming Tao,2 Guoke Yang1
1Department of Ophthalmology, The First People’s Hospital of Hefei, The Third Affiliated Hospital of Anhui Medical University, Hefei, 230032, People’s Republic of China; 2Department of Ophthalmology, The Second Affiliated Hospital of Anhui Medical University, Hefei, 230601, People’s Republic of China
Correspondence: Guoke Yang, Email [email protected]
Introduction: Diabetic retinopathy (DR), particularly proliferative diabetic retinopathy (PDR), is a leading cause of blindness. This study aimed to evaluate the predictive value of hemoglobin (Hb) and direct bilirubin (DBil) for PDR progression.
Methods: We retrospectively collected data from 1,496 T2DM patients with DR treated at the South District of the First People’s Hospital of Hefei. Logistic regression, correlation analysis, restricted cubic spline models, and Mendelian randomization were used.
Results: For each unit increase in Hb and DBil, the risk of PDR decreased by 4.4% and 29.1%, respectively. Restricted cubic spline analyses showed a non-linear association between Hb and PDR: the risk decreased with increasing Hb up to a turning point at approximately 133 g/L and then plateaued thereafter; a turning point of 2.67 μmol/L was identified for DBil. The combined diagnostic model of Hb and DBil yielded an AUC of 0.742 with sensitivity 54.5% and specificity 86.5%, indicating moderate discriminative ability. Subgroup analysis showed higher PDR prevalence with worsening anemia. Mendelian randomization suggested a possible association between genetically predicted anemia and higher PDR risk (OR 1.06, 95% CI 1.003– 1.12).
Conclusion: Lower Hb and DBil levels were associated with higher PDR prevalence in this hospitalized population. These findings reflect statistical associations and require confirmation in prospective, population-based studies.
Keywords: type 2 diabetes, diabetic retinopathy, proliferative diabetic retinopathy, hemoglobin, direct bilirubin
Introduction
Diabetic retinopathy (DR) is the leading microvascular complication of diabetes and remains the foremost cause of vision loss among working-age adults in developed countries.1 In non-proliferative DR (NPDR), chronic hyperglycemia damages the retinal capillary bed, leading to areas of non-perfusion, increased vascular permeability, and, ultimately, diabetic macular edema (DME) with central vision impairment.2 As the disease advances to proliferative DR (PDR), pathological neovascularization, vitreous hemorrhage, and tractional retinal detachment magnify the risk of severe, often irreversible, vision loss.3 Longitudinal studies confirm that DR progression dramatically diminishes quality of life, and without intervention, nearly 50% of high-risk PDR patients develop significant visual impairment within five years of diagnosis.4–6 Early detection and timely treatment are therefore crucial to arrest disease advancement and lessen the burden of sight-threatening complications.7
DR is a complex microvascular complication influenced by multiple interacting risk factors. Poor glycemic control remains the strongest predictor of DR onset and progression, while hypertension, dyslipidemia, and smoking have also been identified as important contributors to disease severity. In addition, longer duration of diabetes is closely associated with a higher risk of PDR.2,8,9 These established risk factors underscore the multifactorial nature of DR and highlight the need to explore additional determinants that may refine risk stratification. Within this context, hemoglobin (Hb) and direct bilirubin (DBil) have drawn attention for their potential roles as biomarkers in DR progression. Our previous work also implicated low serum bilirubin as a predictor of severe DR, potentially via alterations in gut microbiota and barrier integrity.10 Yet, other modifiable risk indicators remain under-characterized. Within this context, Hb and DBil have drawn attention for their potential roles as biomarkers in DR progression. However, not all studies have confirmed a consistent association between Hb and DR progression.11,12
Mendelian randomization (MR) offers a strategy to strengthen causal inference by using genetic variants—typically single-nucleotide polymorphisms—as unconfounded proxies for exposures of interest. By leveraging the random allocation of alleles at conception, MR can distinguish true causal effects from spurious associations due to confounding or reverse causation.13 In this study, we first determined the prevalence and clinical risk factors for PDR among hospitalized type 2 diabetes patients in the southern district of the First People’s Hospital of Hefei. We then applied a two-sample MR framework to interrogate whether genetically determined anemia influences the risk of PDR. Our results aim to inform risk stratification and prompt earlier interventions in clinical practice.
Materials and Methods
Participants
This retrospective analysis included 1,496 adult patients with type 2 diabetes mellitus (T2DM) and documented DR who were treated at the South District of the First People’s Hospital of Hefei (Third Affiliated Hospital of Anhui Medical University) between August 2016 and August 2024. Ethical approval was granted by the hospital’s Institutional Ethics Committee (Approval No. 2024–203-02). DR was graded from color fundus photographs (45° Topcon camera, Tokyo, Japan) according to EURODIAB protocols and staged per the 2022 Chinese Ophthalmology Society criteria: stages 1–3 as non-proliferative DR (NPDR; n = 1,400) and stages 4–6 as proliferative DR (PDR; n = 96).
We excluded patients with type 1 diabetes or acute diabetes complications, severe anemia (hemoglobin < 60 g/L), active malignancy, chronic kidney disease (eGFR ≤ 60 mL/min/1.73 m2, since CKD is a recognized comorbidity strongly associated with PDR and CKD-related renal anemia may confound the relationship between Hb levels and PDR), pregnancy, or rheumatologic disorders. Demographic data (age, sex) and laboratory results were extracted from medical records. All participants had measurements of glycosylated hemoglobin (HbA1c), complete blood count (including hemoglobin), liver enzymes (ALT, AST), direct bilirubin, serum creatinine, uric acid, and lipid panel (triglycerides, LDL-C, HDL-C, total cholesterol). Estimated glomerular filtration rate (eGFR) was calculated via the equation: eGFR=194 × serum creatinine–1.094 × age–0.287 (with a multiplier of 0.739 for females). Anemia was defined as hemoglobin < 120 g/L in men and < 110 g/L in women; microcytic hypochromic anemia required additionally MCV < 80 fL, MCH < 27 pg, and MCHC < 0.32. Severity categories were mild (Hb 90–120 g/L for men, 90–110 g/L for women) and moderate (Hb 60–90 g/L). Two independent clinicians verified data integrity.
Mendelian Randomization Design and Data Sources
Our two-sample Mendelian randomization framework (Figure 1) employed single-nucleotide polymorphisms (SNPs) as instrumental variables (IVs) to infer causal effects of anemia on PDR risk. Genetic instruments were selected using genome-wide significance (p < 5×10⁻⁵) and independence criteria (linkage disequilibrium r2 < 0.001, clumping window 10,000 kb). Mendelian randomization analyses were conducted using the TwoSampleMR R package (version 0.5.7). Harmonization was performed by aligning effect alleles, with palindromic SNPs removed, and instruments missing in outcome datasets were excluded from analysis.14,15 SNP–PDR associations were obtained from a GWAS meta-analysis of 8,681 European PDR cases and 204,208 controls (FinnGen dataset at EBI; “DM_RETINA_PROLIF”), while anemia-related SNPs were drawn from publicly available GWAS (“GCST90038678” and “GCST90018652”). All underlying studies had received ethical clearance.
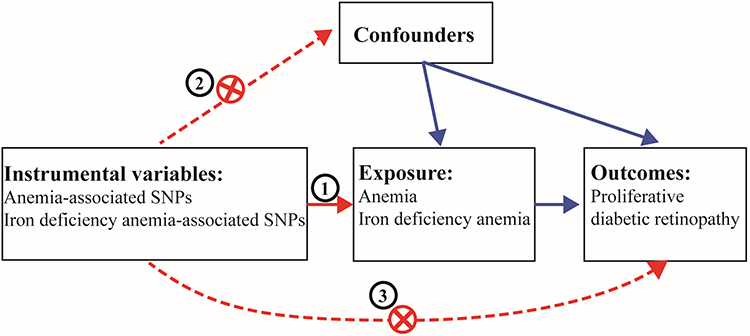 |
Figure 1 The framework of the current MR study. |
Statistical Analysis
Baseline characteristics and laboratory values were compared between NPDR and PDR groups using independent t-tests or Mann–Whitney U-tests for continuous variables, and chi-square tests for categorical variables. Logistic regression models estimated adjusted odds ratios (ORs) and 95% confidence intervals (CIs) for PDR, controlling for potential confounders. Restricted cubic spline models explored nonlinear relationships of hemoglobin and total bilirubin with PDR risk. Receiver operating characteristic (ROC) curves and corresponding area under the curve (AUC) values assessed discriminatory performance. Post-hoc power calculations were performed using the pwr package in R. For the PDR subgroup (n = 96), statistical power was approximately 62% to detect moderate associations (α = 0.05). For the moderate anemia subgroup (n = 13), power was <20%, indicating insufficient sensitivity for reliable inference. For MR analyses, the inverse variance–weighted (IVW) method provided the primary causal estimate, with the weighted-median approach as sensitivity analysis. Heterogeneity across SNPs was evaluated by Cochran’s Q statistic; horizontal pleiotropy was assessed via the MR-Egger intercept test and MR-PRESSO. Two-sided p < 0.05 was considered statistically significant.
Results
Demographic and Metabolic Characterization of Study Subjects
A total of 1,496 T2DM participants were included, with 854 (57.09%) male and 642 (42.91%) female patients. Of these, 96 (6.4%) participants were categorized as having PDR. Hemoglobin, direct bilirubin, and albumin levels were significantly different between the two groups (all p < 0.05), while no statistical differences were found for the other indicators. The clinical and biochemical characteristics of NPDR and PDR patients are shown in Table 1.
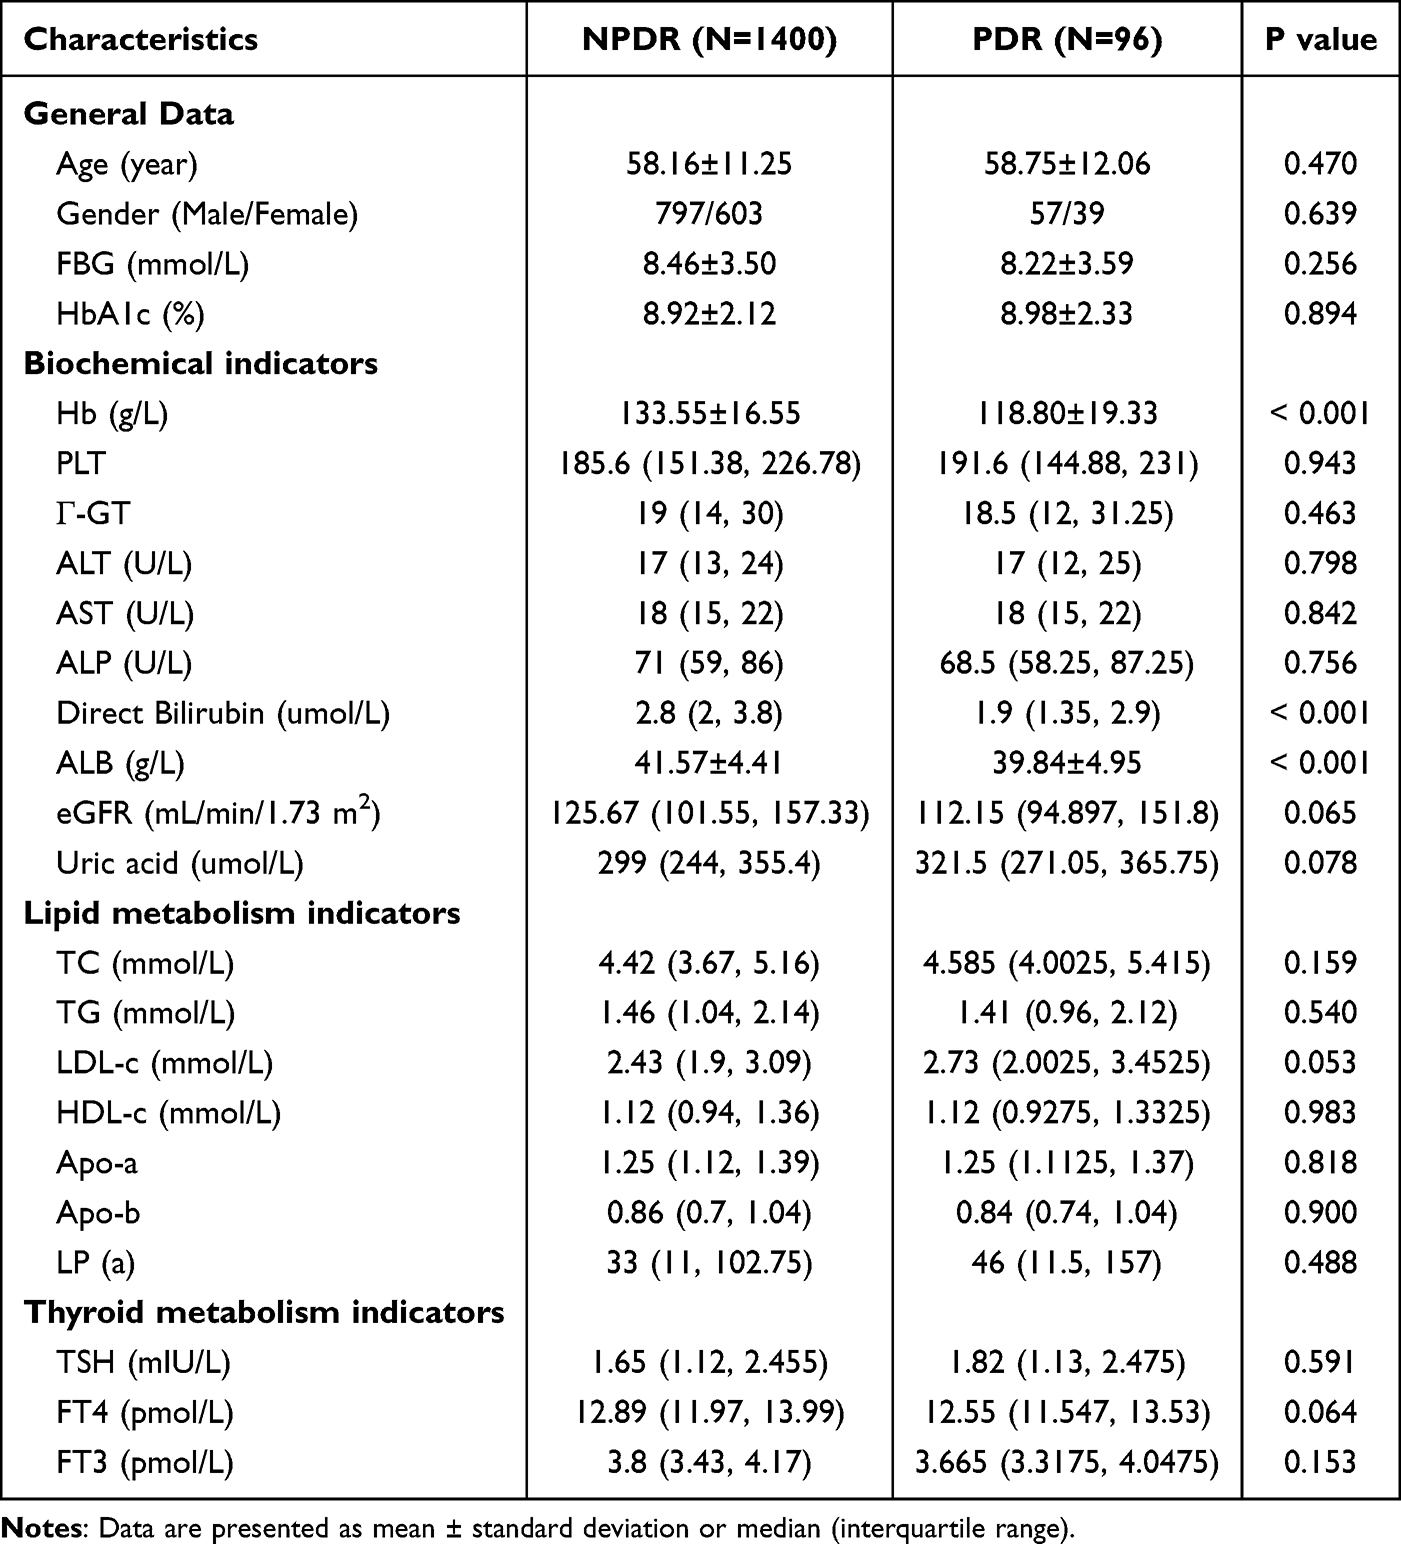 |
Table 1 Demographic and Metabolism Characterization of Study Subjects |
Logistic Regression Analysis of DR Progression in T2DM Patients
We included variables with a p-value < 0.1 from the univariate analysis (Hemoglobin, Direct Bilirubin, Albumin, eGFR, Uric Acid, LDL-c, and FT4), along with gender and age, in a binary stepwise logistic regression analysis. Hemoglobin (OR=0.956) and Direct Bilirubin (OR=0.709) emerged as potential protective factors against the progression of NPDR to PDR (Table 2). The inverse association between hemoglobin and PDR remained significant in both men and women, and no significant interaction was found (Supplementary Table 1).
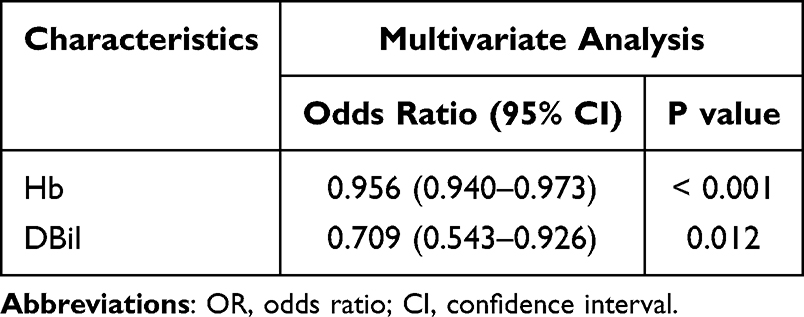 |
Table 2 Logistic Regression Analysis of DR Progression in T2DM Patients |
Associations of Hemoglobin and Direct Bilirubin Levels with PDR Risk
Spearman correlation analysis revealed a positive correlation between hemoglobin (Hb) and direct bilirubin (DBil) levels in both the NPDR and PDR groups (Figure 2A, R = 0.292 and 0.476, respectively). Using restricted cubic spline analyses to explore the non-linear associations with PDR risk, we observed a curvilinear relationship between Hb concentration and PDR. The risk of PDR decreased markedly as Hb increased up to approximately 133 g/L, and then leveled off or showed a mild upward trend beyond this threshold (Figure 2B). Similarly, a non-linear relationship was found between DBil and PDR risk, with a turning point of 2.67 µmol/L, below which the risk declined sharply and then plateaued (Figure 2C).
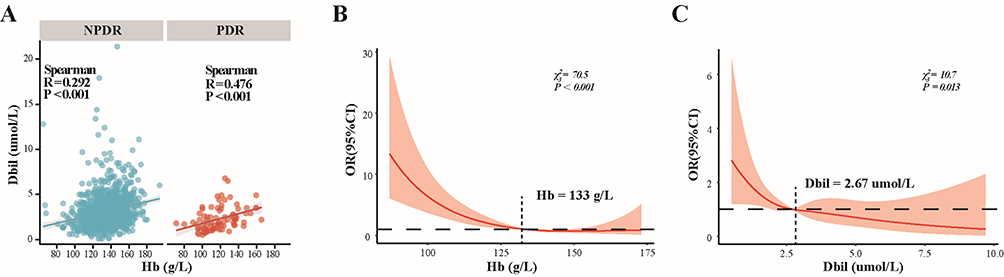 |
Figure 2 Associations of Hemoglobin and Direct Bilirubin concentrations with PDR risk. (A) Correlation between Hb levels and Dbil by Spearman correlation analysis; (B) Relationship between Hb levels and the risk of developing PDR, adjusted for Dbil, evaluated by restricted cubic splines; (C) Relationship between Dbil levels and the risk of developing PDR, adjusted for Hb, evaluated by restricted cubic splines. |
Diagnostic Value of Hemoglobin and Direct Bilirubin Levels for PDR
ROC curve analysis was performed to evaluate the predictive power of Hemoglobin and Direct Bilirubin levels for PDR incidence. The AUCs for Hemoglobin (Figure 3A) and Direct Bilirubin (Figure 3B) were 0.723 and 0.661, respectively. The combined analysis of Hemoglobin and Direct Bilirubin levels showed better diagnostic performance, with a sensitivity of 54.5%, specificity of 86.5%, and an AUC of 0.742 (Figure 3C).
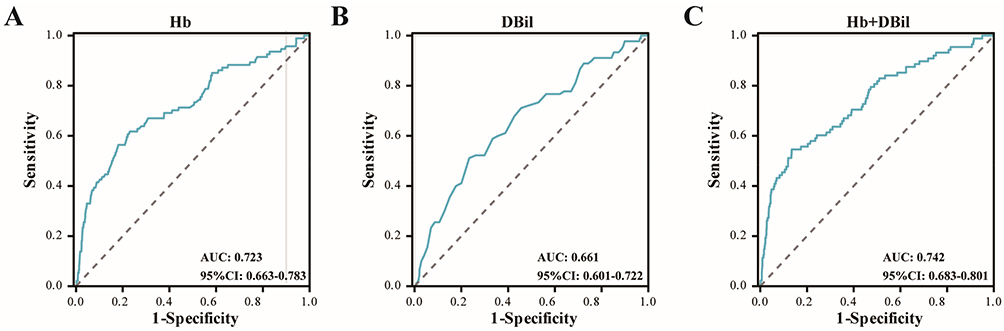 |
Figure 3 Diagnostic Value of Hemoglobin and Direct Bilirubin Levels for PDR. AUC analysis of Hb (A) TBil (B) and the combination of Hb and TBil concentrations (C) for predicting the incidence of PDR. |
Subgroup Analysis Based on Hemoglobin
Participants were divided into non-anemia (n=1303), mild anemia (n=180), and moderate anemia groups (n=13) based on their Hemoglobin levels. The subgroup analysis (Figure 4A) revealed a significant increase in PDR proportion with increasing anemia severity (p for trend < 0.001). Additionally, among the 165 anemic patients, those with microcytic hypochromic anemia (n=28) and non-microcytic hypochromic anemia (n=137) showed no statistical difference in the distribution of PDR versus NPDR (Figure 4B).
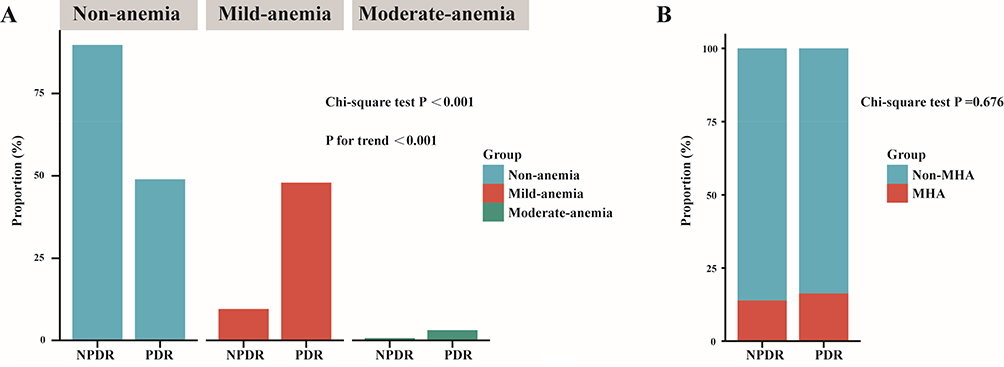 |
Figure 4 Subgroup Analysis Based on Hemoglobin. (A) Subgroup analysis stratified by Hemoglobin Concentration. (B) Further subgroup analysis of anemic patients, stratified by the presence of Microcytic Hypochromic Anemia (MHA). |
Mendelian Randomization Results for Anemia’s Causal Effects on PDR
A total of 104 SNPs were selected as instrumental variables to analyze the causal effect of anemia on PDR. No pleiotropic outliers were detected in the causal effect of iron deficiency on PDR. Using the IVW method (Figure 5A and B), anemia was found to be related to a 0.06-fold increase in the risk of PDR (OR 1.06, 95% CI 1.003–1.12, P = 0.0162). Further analyses, including funnel plots (Figure 5C) and leave-one-out methods (Figure 5D), supported these findings. No statistically significant difference was found in the analysis of iron deficiency anemia’s impact on PDR (Supplementary Table 2).
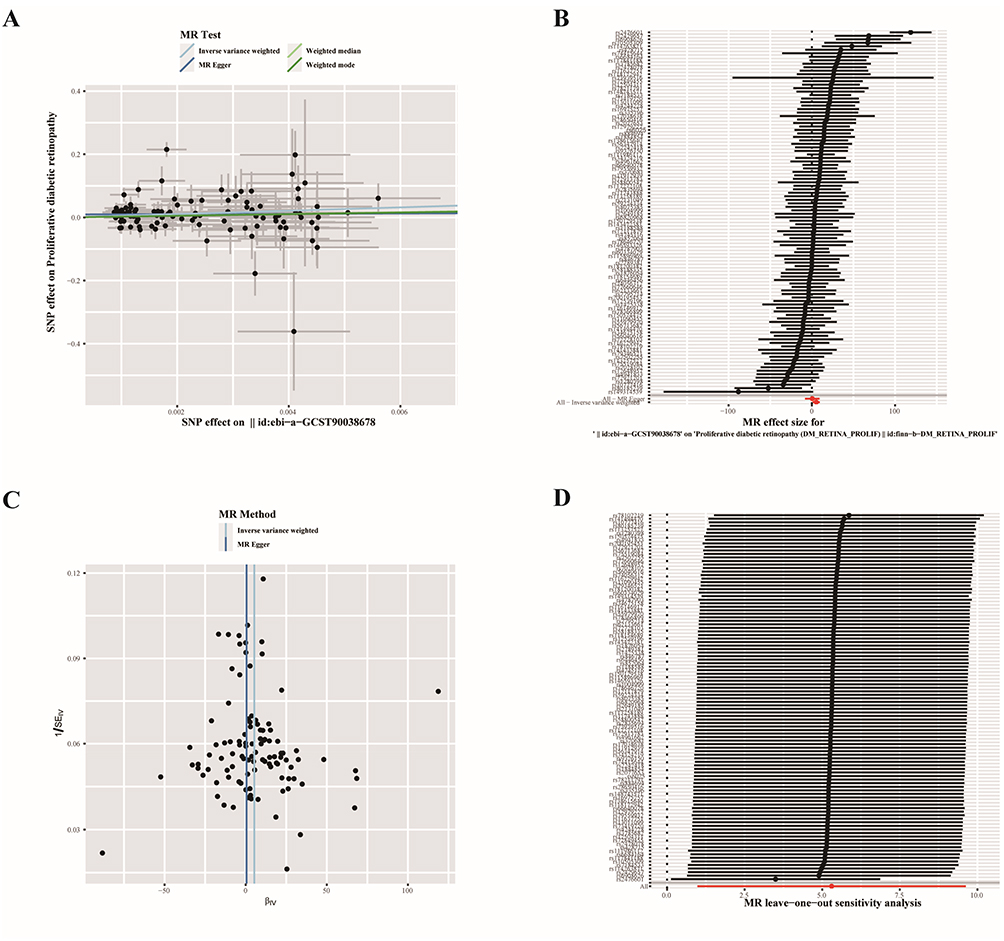 |
Figure 5 Mendelian Randomization Results for Anemia’s Causal Effects on PDR. (A) Scatter plot; (B) Overall effects of SNPs; (C) Funnel plot; (D) Leave-one-out plot. |
Discussion
In Chinese populations, anemia—defined by low hemoglobin levels—affects approximately 15–25% of type 2 diabetes patients, which may complicate interpretation of its association with DR. Furthermore, In a nationwide survey on the prevalence of diabetic complications conducted in China, a total of 50,564 evaluable participants were included. The prevalence of diabetic retinopathy and vision-threatening diabetic retinopathy was 16.3% (95% CI: 15.3–17.2%) and 3.2% (95% CI: 2.9–3.5%), respectively.16 These characteristics highlight the importance of evaluating Hb and DBil as potential biomarkers specifically within Chinese cohorts. Our findings extend previous observations that higher hemoglobin levels confer protection against diabetic microvascular complications—including neuropathy, nephropathy, and retinopathy—by demonstrating, for the first time, a predictive relationship between Hb concentration and the transition from non-proliferative to PDR.17–19 In this cohort, each 1 g/L increment in Hb corresponded to a 4.4% lower risk of progression to PDR, while a 1 µmol/L rise in direct bilirubin was linked to a 29.1% risk reduction. Restricted cubic spline curves indicated that patients with Hb below 133 g/L or direct bilirubin under 2.67 µmol/L faced disproportionately higher progression rates. Moreover, subgroup analyses revealed a graded increase in PDR incidence with worsening anemia, underscoring the prognostic importance of maintaining adequate Hb and bilirubin concentrations.
Conway et al reported that Hb levels significantly predicted the development of PDR in both male and female patients with type 1 diabetes, and suggested that this association might be partly attributable to increased blood viscosity and related sludging.20 However, Hb concentration within the physiological or moderately elevated range does not directly reflect blood viscosity, and only extremely high hemoglobin levels are typically associated with clinically meaningful increases in viscosity. A previous study analyzing hemoglobin levels in 1,691 subjects from a Finnish diabetes outpatient clinic (1991–1992) showed that participants with Hb levels below 12 g/dL had a 2.0-fold higher odds ratio for any retinopathy compared to those with Hb levels ≥12 g/dL (95% CI 1.2–3.3). For those with lower Hb levels, the odds ratio for severe retinopathy was 5.3 (2.3–12.6).11 In another study involving 2,123 T2DM patients aged ≥30 years from the 2008–2012 Korean National Health and Nutrition Examination Survey, each 1.0 g/dL increase in Hb was associated with a 19% reduction in DR risk.21 Similarly, a prospective cross-sectional study by V K Ajoy Mohan involving 306 T2DM patients indicated that lower Hb was a strong predictor of DR, clinically significant macular edema (CSME), and hard exudate formation.22 Additional research also supports that lower oxygen transport capacity is linked to more severe DR and retinal ischemia, suggesting that Hb plays a key role in DR development and progression.19 Our findings align with these studies, confirming that declining Hb levels may increase the likelihood of developing PDR, especially when Hb levels fall below 133 g/L. Subsequent Mendelian randomization analyses further validated that anemia exacerbates the risk of PDR. Although iron metabolism is known to play a significant role in the chronic complications of diabetes, our clinical data and MR results did not support a causal relationship between iron deficiency anemia and PDR. The lack of association between IDA and PDR in our study may be due to the small number of patients with IDA, resulting in inadequate statistical power. Alternatively, IDA could influence retinal pathology through mechanisms distinct from Hb concentration, such as iron-dependent oxidative stress pathways. Future studies with larger sample sizes are warranted to clarify this relationship.
In the Hisayama study, a cross-sectional analysis of 3,119 participants suggested that elevated bilirubin levels might protect against DR in individuals with diabetes or abnormal glucose metabolism.23 Our previous study, involving 540 NPDR patients, also demonstrated that total bilirubin (TBIL) is an important independent predictor of DR progression (HR: 0.70, p = 0.006). Progression-group patients had higher levels of urobilinogen and endotoxins but lower TBIL levels, suggesting that reduced bilirubin levels may be associated with gut dysbiosis and intestinal barrier disruption.10 Notably, most of these studies measured total bilirubin (TBil), whereas in the present study we specifically assessed direct bilirubin (DBil). This distinction is important to avoid confusion and to ensure clarity in interpreting the findings. However, the underlying mechanisms between bilirubin metabolism and DR still require further validation through animal studies.
Our results align with prior studies reporting a possible protective association of bilirubin with PDR. Furthermore, we observed that lower Hb levels were associated with a higher likelihood of PDR, with the lowest risk around 133 g/L. These findings highlight a potential threshold effect but warrant cautious interpretation. The combination of Hb and DBil yielded an AUC of 0.742, with sensitivity of 54.5% and specificity of 86.5%, indicating moderate diagnostic utility. While these findings support the potential of Hb+DBil as biomarkers for PDR. Low Hb levels may exacerbate retinal ischemia and hypoxia, activating hypoxia-inducible factors and VEGF signaling, thereby promoting pathological angiogenesis. In contrast, DBil has been shown to exert antioxidant and anti-inflammatory effects, reducing oxidative damage and vascular dysfunction in the retina. The balance between pro-angiogenic stimuli driven by anemia and the cytoprotective role of DBil may partly explain their combined association with PDR progression. However, there are limitations to our study. First, as a retrospective study conducted at a single center with a relatively small sample of PDR patients, multicenter studies would provide more robust evidence. Second, due to many patients not visiting the endocrinology department, key indicators like UACR and diabetes-related factors were missing, and no imputation methods were applied, thus early stages of diabetic nephropathy may not have been captured. Lastly, we did not explore other potential risk factors for DR, such as socioeconomic status or medication use. The limited statistical power in subgroup analyses, particularly in the moderate anemia group, must be acknowledged. These findings should therefore be interpreted cautiously, future multicenter, large-sample, prospective studies are needed to further investigate the effects of Hb and bilirubin levels on PDR progression.
Data Sharing Statement
The datasets analysed during the current study are available from the corresponding author.
Ethics Approval
The study received ethical approval (2024-203-02) from The First People’s Hospital of Hefei (The Third Affiliated Hospital of Anhui Medical University). We have obtained written informed consent from all study participants. All of the procedures were performed in accordance with the Declaration of Helsinki and relevant policies in China.
Author Contributions
Conceptualization:Yu Ding; Methodology: Yu Ding, Zhengyu Hou, Liming Tao; Formal analysis: Yu Ding; Investigation: Mei Mei, Kaifeng Wu; Data curation: Yu Ding, Mei Mei; Writing – original draft: Yu Ding; Writing – review & editing: Liming Tao, Guoke Yang; Supervision: Guoke Yang. All authors made a significant contribution to the work reported, whether that is in the conception, study design, execution, acquisition of data, analysis and interpretation, or in all these areas; took part in drafting, revising or critically reviewing the article; gave final approval of the version to be published; have agreed on the journal to which the article has been submitted; and agree to be accountable for all aspects of the work.
Funding
This study was supported by National Natural Science Foundation of China General Program (82171043 and 82471094).
Disclosure
The authors declare that they have no competing interests.
References
1. Vujosevic S, Aldington SJ, Silva P, et al. Screening for diabetic retinopathy: new perspectives and challenges. Lancet Diabetes Endocrinol. 2020;8(4):337–347. doi:10.1016/S2213-8587(19)30411-5
2. Perais J, Agarwal R, Evans JR, et al. Prognostic factors for the development and progression of proliferative diabetic retinopathy in people with diabetic retinopathy. Cochrane Database Syst Rev. 2023;2(2):CD013775. doi:10.1002/14651858.CD013775.pub2
3. Hu A, Schmidt MHH, Heinig N. Microglia in retinal angiogenesis and diabetic retinopathy. Angiogenesis. 2024;27(3):311–331. doi:10.1007/s10456-024-09911-1
4. Okamoto F, Okamoto Y, Fukuda S, Hiraoka T, Oshika T. Vision-related quality of life and visual function following vitrectomy for proliferative diabetic retinopathy. Am J Ophthalmol. 2008;145(6):1031–1036. doi:10.1016/j.ajo.2008.02.006
5. Tsilimbaris MK, Kontadakis GA, Tsika C, Papageorgiou D, Charoniti M. Effect of panretinal photocoagulation treatment on vision-related quality of life of patients with proliferative diabetic retinopathy. Retina. 2013;33(4):756–761. doi:10.1097/IAE.0b013e31826b0c06
6. Kollias AN, Ulbig MW. Diabetic retinopathy: early diagnosis and effective treatment. Dtsch Arztebl Int. 2010;107(5):75–83. doi:10.3238/arztebl.2010.0075
7. Sun WJ, An XD, Zhang YH, et al. The ideal treatment timing for diabetic retinopathy: the molecular pathological mechanisms underlying early-stage diabetic retinopathy are a matter of concern. Front Endocrinol. 2023;14:1270145. doi:10.3389/fendo.2023.1270145
8. Busik JV. Lipid metabolism dysregulation in diabetic retinopathy. J Lipid Res. 2021;62:100017. doi:10.1194/jlr.TR120000981
9. Do DV, Han G, Abariga SA, Sleilati G, Vedula SS, Hawkins BS. Blood pressure control for diabetic retinopathy. Cochrane Database Syst Rev. 2023;3(3):CD006127. doi:10.1002/14651858.CD006127.pub3
10. Ding Y, Zhao J, Liu G, et al. Total bilirubin predicts severe progression of diabetic retinopathy and the possible causal mechanism. J Diabetes Res. 2020;2020:7219852. doi:10.1155/2020/7219852
11. Qiao Q, Keinanen-Kiukaanniemi S, Laara E. The relationship between hemoglobin levels and diabetic retinopathy. J Clin Epidemiol. 1997;50(2):153–158. doi:10.1016/S0895-4356(96)00335-6
12. Li X, Chen M. Correlation of hemoglobin levels with diabetic retinopathy in US adults aged >/=40 years: the NHANES 2005-2008. Front Endocrinol. 2023;14:1195647. doi:10.3389/fendo.2023.1195647
13. Sanderson E, Glymour MM, Holmes MV, et al. Mendelian randomization. Nat Rev Meth Primers. 2022;2.
14. Emdin CA, Khera AV, Kathiresan S. Mendelian randomization. JAMA. 2017;318(19):1925–1926. doi:10.1001/jama.2017.17219
15. Skrivankova VW, Richmond RC, Woolf BAR, et al. Strengthening the reporting of observational studies in epidemiology using mendelian randomization: the STROBE-MR statement. JAMA. 2021;326(16):1614–1621. doi:10.1001/jama.2021.18236
16. Hou X, Wang L, Zhu D, et al. Prevalence of diabetic retinopathy and vision-threatening diabetic retinopathy in adults with diabetes in China. Nat Commun. 2023;14(1):4296. doi:10.1038/s41467-023-39864-w
17. Yang J, Yan PJ, Wan Q, Li H. Association between hemoglobin levels and diabetic peripheral neuropathy in patients with type 2 diabetes: a cross-sectional study using electronic health records. J Diabetes Res. 2017;2017:2835981. doi:10.1155/2017/2835981
18. Mohanram A, Zhang Z, Shahinfar S, Lyle PA, Toto RD. The effect of losartan on hemoglobin concentration and renal outcome in diabetic nephropathy of type 2 diabetes. Kidney Int. 2008;73(5):630–636. doi:10.1038/sj.ki.5002746
19. Traveset A, Rubinat E, Ortega E, et al. Lower hemoglobin concentration is associated with retinal ischemia and the severity of diabetic retinopathy in type 2 diabetes. J Diabetes Res. 2016;2016:3674946. doi:10.1155/2016/3674946
20. Conway BN, Miller RG, Klein R, Orchard TJ. Prediction of proliferative diabetic retinopathy with hemoglobin level. Arch Ophthalmol. 2009;127(11):1494–1499. doi:10.1001/archophthalmol.2009.274
21. Lee MK, Han KD, Lee JH, et al. High hemoglobin levels are associated with decreased risk of diabetic retinopathy in Korean type 2 diabetes. Sci Rep. 2018;8(1):5538. doi:10.1038/s41598-018-23905-2
22. Ajoy Mohan VK, Nithyanandam S, Idiculla J. Microalbuminuria and low hemoglobin as risk factors for the occurrence and increasing severity of diabetic retinopathy. Indian J Ophthalmol. 2011;59(3):207–210. doi:10.4103/0301-4738.81029
23. Yasuda M, Kiyohara Y, Wang JJ, et al. High serum bilirubin levels and diabetic retinopathy: the hisayama study. Ophthalmology. 2011;118(7):1423–1428. doi:10.1016/j.ophtha.2010.12.009
 © 2025 The Author(s). This work is published and licensed by Dove Medical Press Limited. The
full terms of this license are available at https://www.dovepress.com/terms
and incorporate the Creative Commons Attribution
- Non Commercial (unported, 4.0) License.
By accessing the work you hereby accept the Terms. Non-commercial uses of the work are permitted
without any further permission from Dove Medical Press Limited, provided the work is properly
attributed. For permission for commercial use of this work, please see paragraphs 4.2 and 5 of our Terms.
© 2025 The Author(s). This work is published and licensed by Dove Medical Press Limited. The
full terms of this license are available at https://www.dovepress.com/terms
and incorporate the Creative Commons Attribution
- Non Commercial (unported, 4.0) License.
By accessing the work you hereby accept the Terms. Non-commercial uses of the work are permitted
without any further permission from Dove Medical Press Limited, provided the work is properly
attributed. For permission for commercial use of this work, please see paragraphs 4.2 and 5 of our Terms.