Back to Journals » Diabetes, Metabolic Syndrome and Obesity » Volume 14
The Relationship Between Hemoglobin Glycation Variation Index and Vitamin D in Type 2 Diabetes Mellitus
Authors Li Z, Wang F, Jia Y, Guo F, Chen S
Received 12 March 2021
Accepted for publication 7 April 2021
Published 30 April 2021 Volume 2021:14 Pages 1937—1948
DOI https://doi.org/10.2147/DMSO.S310672
Checked for plagiarism Yes
Review by Single anonymous peer review
Peer reviewer comments 2
Editor who approved publication: Professor Ming-Hui Zou
Zelin Li,1,2 Fei Wang,1,2 Yujiao Jia,1,2 Feiyue Guo,1,3 Shuchun Chen1,2,4
1Graduate School of Hebei Medical University, Shijiazhuang, Hebei, People’s Republic of China; 2Department of Endocrinology, Hebei General Hospital, Shijiazhuang, Hebei, People’s Republic of China; 3Department of Glandular Surgery, Hebei General Hospital, Shijiazhuang, Hebei, People’s Republic of China; 4Hebei Key Laboratory of Metabolic Diseases, Hebei, People’s Republic of China
Correspondence: Shuchun Chen
Department of Endocrinology, Hebei General Hospital, 348 Heping West Road, Shijiazhuang, Hebei, 050051, People’s Republic of China
Tel +86 31185988406
Fax +86 31185988406
Email [email protected]
Objective: This study aimed to investigate the relationship between hemoglobin glycation variation index (HGI) and vitamin D in patients with type 2 diabetes mellitus (T2DM).
Materials and Methods: This is a cross-sectional study that recruited 347 patients with T2DM. The subjects were divided into no vitamin D deficiency group (25(OH)D ≥ 20 ng/mL) and vitamin D deficiency group (25(OH)D < 20 ng/mL). HGI was calculated as the difference between the measured and predicted values of HbA1c using the linear relationship between HbA1c level and fasting plasma glucose levels. All study participants were divided into high HGI and low HGI groups using the median of HGI as the boundary. At last, the subjects were divided into male group and female group, and these groups were further subdivided into vitamin D deficiency group and no vitamin D deficiency group.
Results: The levels of HGI were significantly higher in the vitamin D deficiency group compared with the no vitamin D deficiency group for all patients. The same was true for female patients but not for male patients. The prevalence of vitamin D deficiency in the high HGI group was higher than that in the low HGI group. The high HGI group had lower vitamin D levels compared to the low HGI group. Compared to the male group, the female group had lower vitamin D levels but higher HGI levels. A negative correlation existed between 25(OH) D and HGI in all subjects, as well as in the female-only subgroups. In the male-only subgroups, there was no correlation between them, and this positive correlation still existed after adjusting for other factors in multilinear regression analysis.
Conclusion: Our study showed for the first time that HGI is inversely associated with vitamin D in all patients with T2DM, and the correlation was also found in female patients, but not in male patients.
Keywords: hemoglobin glycation variation index, vitamin D, type 2 diabetes mellitus
Introduction
Vitamin D is an essential fat-soluble vitamin, which plays an important role in many physiological functions, including calcium/phosphorus homeostasis, bone metabolism, promoting insulin secretion1 and increasing insulin sensitivity.2 Usually, 80–90% of Vitamin D in the body is synthesized in the skin upon sunlight exposure and 10–20% comes from food intake.3 Despite the dual sources of vitamin D, vitamin D deficiency remains a global health problem. It is estimated that 1 billion people worldwide suffer from vitamin D deficiency.4 Among the forms of vitamin D, 25-hydroxyvitamin D (25(OH)D) is considered to be the most valuable indicator of vitamin D levels for clinical judgment of vitamin D levels, and vitamin D deficiency is defined as 25(OH)D < 20 ng/mL (50 nmol/L).
Vitamin D deficiency can accelerate the progression of some chronic diseases such as diabetes.5 Recently, an increasing number of studies had shown that vitamin D is associated with glucose homeostasis in patients with type 2 diabetes mellitus (T2DM), and they found that vitamin D levels were negatively related to fasting blood glucose (FBG)4 and glycosylated hemoglobin (HbA1c).2,6 In clinical practice, HbA1c levels are universally considered a gold standard for monitoring glucose control. However, there are differences between HbA1c and blood glucose levels. Many individuals exhibiting consistently higher or lower HbA1c levels than those that expected based on FBG or continuous glucose monitoring.7 Therefore, the hemoglobin glycosylation index (HGI) was introduced to quantify the inter-individual differences in glycosylation that lead to differences between FBG and HAb1c.8 HGI can be considered as a blood glucose monitoring indicator. Researches suggested that high HGI is associated with an increased risk of many chronic complications of diabetes, including diabetic retinopathy and diabetic nephropathy, especially cardiovascular disease.9–11
However, there are currently no data about the relationship between HGI and vitamin D among patients with T2DM. Considering the importance of vitamin D in the body, the purpose of this study was to investigate: 1) The relationship between HGI and vitamin D in patients with T2DM, and whether there is any difference between males and females; 2) Whether HGI is an independent factor for vitamin D levels.
Materials and Methods
Study Population
This was a hospital-based cross-sectional study, which was conducted in the Department of Endocrinology, Hebei General Hospital, from December 2018 to December 2019. Patients complying with the WHO diagnostic criteria for diabetes, 1999, were included. This study excluded patients with type 1 diabetes mellitus or acute diabetic complications, pregnant women, patients with hepatic or renal dysfunction or malignant tumor or thyroid diseases or hyperparathyroidism, and patients using agents that could affect vitamin D. This study was approved by the medical ethics committee of Hebei General Hospital, and all patients had signed the informed consent form before enrollment. This study was conducted in accordance with the Declaration of Helsinki.
Information and Biomarkers Collection
All participants completed a questionnaire to collect basic information, including gender, age, medical history, smoking history, and alcohol consumption history. Height, weight, systolic blood pressure, diastolic blood pressure were measured twice by professional, and the average value was recorded. Blood samples were collected from the patients after 8 hours of fasting. All blood biomarkers were tested in the same laboratory. In addition, our study measured the levels of FBG, HbA1c, vitamin D, total cholesterol, triglyceride, high-density lipoprotein cholesterol, low-density lipoprotein cholesterol, alanine aminotransferase, aspartate aminotransferase, urea nitrogen, creatinine and uric acid.
Hemoglobin Glycation Index
HGI was calculated using the formula: HGI = measured HbA1c value - predicted HbA1c value.11 The linear relationship between HbA1c and FPG was estimated from linear regression analysis of the data of the all the subject subjects (N = 347). In this study, we calculated the regression equation is: HbA1c = 0.0371 × FPG (mmol/L) + 6.008, r = 0.456 and p < 0.001). Predicted HbA1c value was then calculated from the regression equation using each subject’s FPG value. In a word, HGI was defined as the difference between the measured HbA1c level and that predicted from FBG levels, calculated using the HbA1c–FBG regression equation based on data obtained from all the study subjects.12
Statistical Analysis
All analyses were conducted using Statistical Product and Service Solutions 25.0 (SPSS 25.0). The study tested the distribution normality using the Kolmogorov–Smirnov test. Continuous variables are presented as mean ± standard deviation or median (25th–75th interquartile range) values. For categorical variables, data were expressed as numbers (percentages). The biochemical parameters between the two groups were compared using the Student’s t-test or Mann–Whitney test. χ2 test was employed to compare categorical variables. Spearman or Pearson correlation analysis was used to analyze the correlation between dependent variables and independent variables. Multiple linear regression analysis was used to study the independent correlation between HGI and vitamin D levels. A P-value less than 0.05 was considered statistically significant.
Results
Clinical Characteristics of All Participants
A total of 347 patients with T2DM (161 female and 186 male) were included in this study. The mean age was 58.13 years, the mean BMI was 25.73 kg/m2 and the mean diabetes duration was 10 years. In the cohort of all patients, the mean FBG level was 7.94 mmol/L and the mean HbA1c level was 8.40%. The mean vitamin D level was 16.39 ng/mL, 252 (72.6%) participants suffered from vitamin D deficiency 25(OH)D < (20 ng/mL). A total of 167 patients with high HGI values (48.1%), the mean HGI value was −0.44 (Table 1).
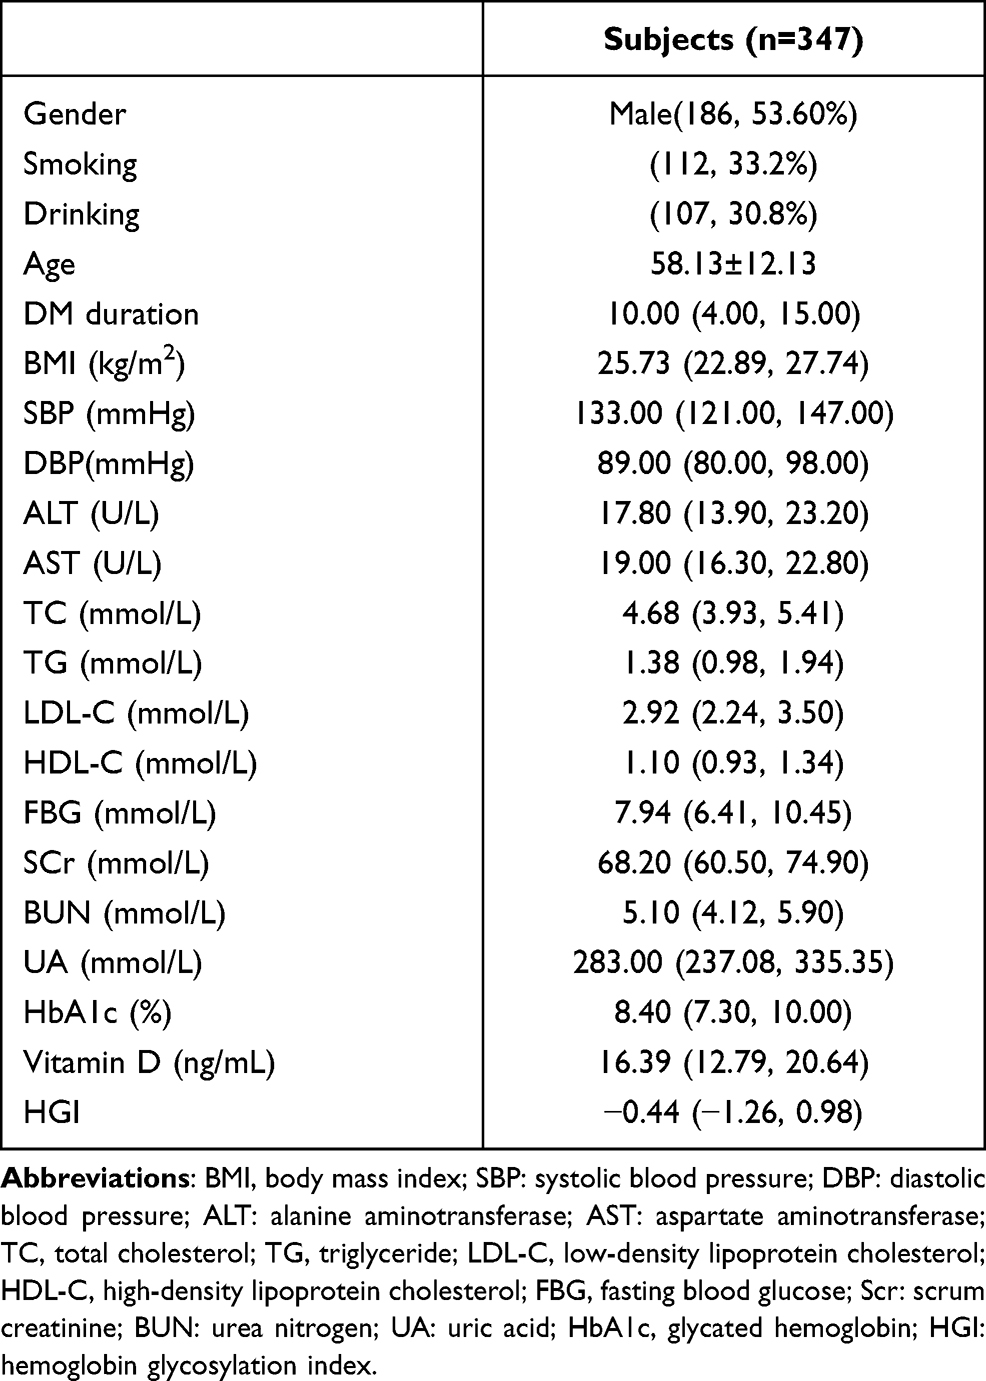 |
Table 1 Clinical Characteristics of All Participants |
Clinical Characteristics of All Patients with T2DM with and without Vitamin D Deficiency
The HGI and HbA1c levels were significantly increased in patients with vitamin D deficiency compared to patients without vitamin D deficiency, (P<0.001, respectively). Compared with the no vitamin D deficiency, the proportion of females in the vitamin D deficiency group was higher (P < 0.001). The vitamin D deficiency group had significantly lower creatinine and uric acid levels compared with the no vitamin D deficiency group (P=0.001, P=0.040, respectively) (Table 2). The difference in HGI between vitamin D deficiency group and no vitamin D deficiency group is shown in Figure 1.
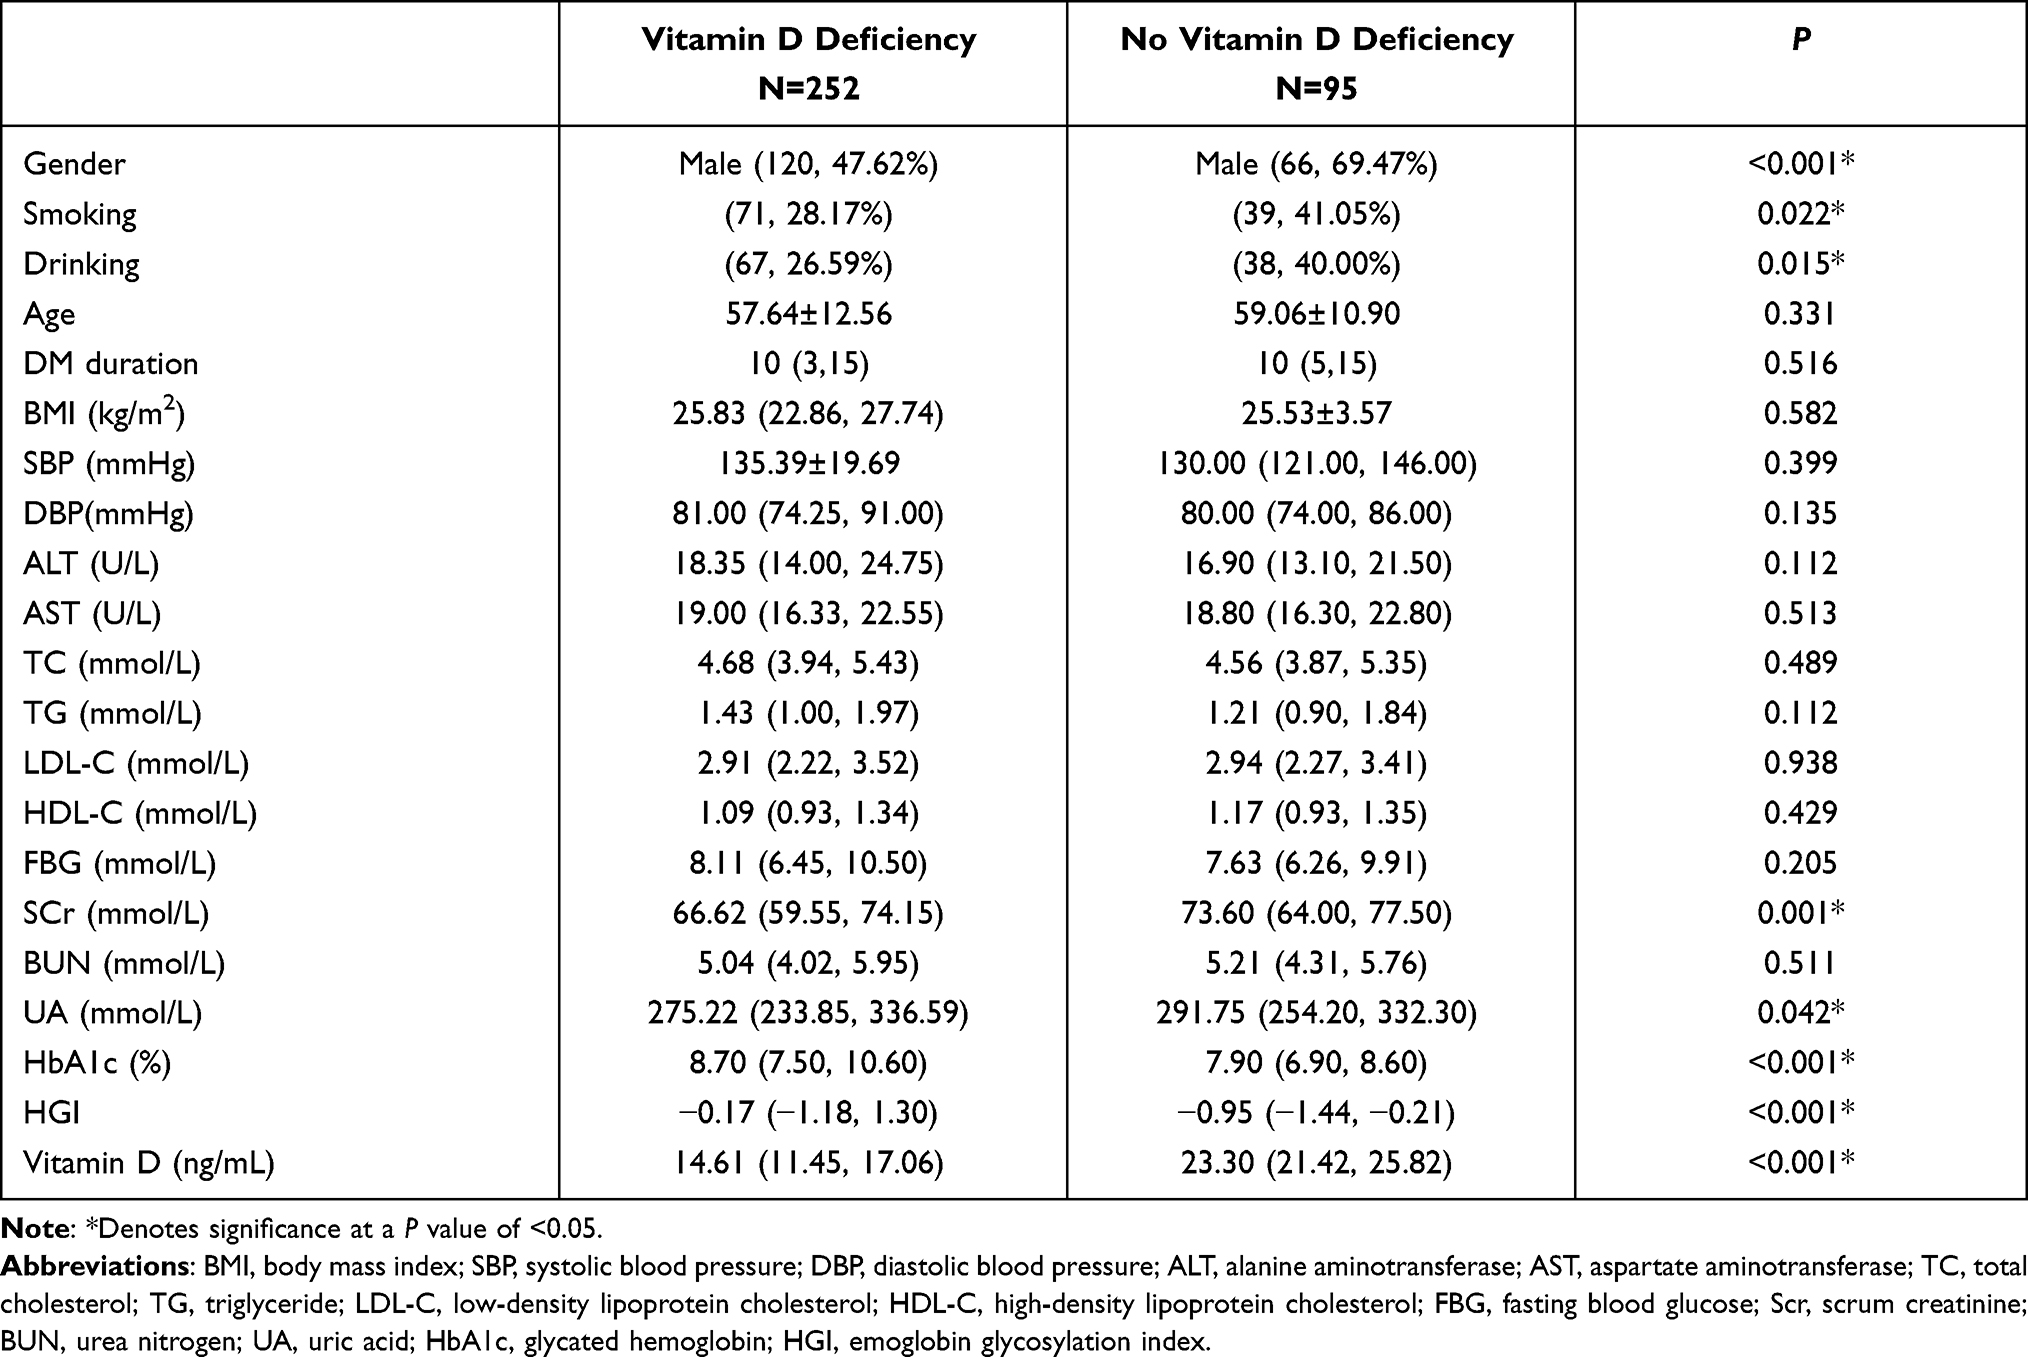 |
Table 2 Clinical Characteristics of All Patients with T2DM with and without Vitamin D Deficiency |
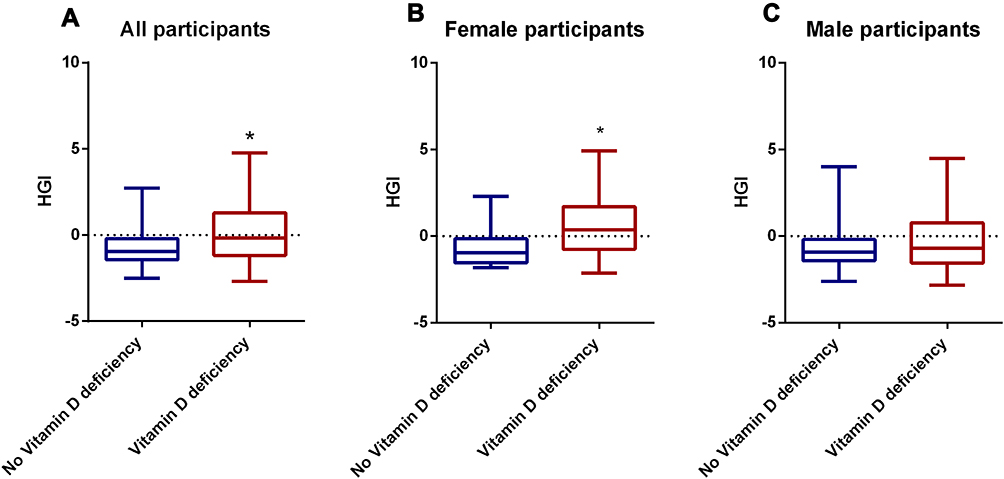 |
Figure 1 Comparisons of HGI in No vitamin D deficiency group and Vitamin D deficiency group.(A) Comparisons of HGI in No vitamin D deficiency group and Vitamin D deficiency group in all participants. (B) Comparisons of HGI No vitamin deficiency group and Vitamin D deficiency group in female participants. (C) Comparisons of HGI in No vitamin deficiency group and Vitamin D deficiency group in male participants. *Denotes significance at a P value of <0.05. |
Clinical Characteristics of All Patients with T2DM in the High and Low HGI Groups
There were more male patients in the low HGI group compared with the high HGI group (P<0.001). Compared with patients with high HGI level, patients with low HGI level exhibited significantly higher rates of smoking and drinking (P=0.039, P=0.007, respectively). There was no significant difference in age and duration of diabetes between the two groups. The prevalence of vitamin D deficiency in the high HGI group was higher than that in the low HGI group (P<0.001). Vitamin D levels were significantly decreased in the high HGI group compared with the low HGI group (P<0.001). The levels of creatinine and uric acid were significantly decreased in the high HGI group compared with the low HGI group (P<0.001, respectively), whereas the HAb1c levels were significantly increased (P<0.001) (Table 3). The difference of the prevalence of vitamin D deficiency and 25(OH)D levels in High HGI group and Low HGI group are shown in Figure 2.
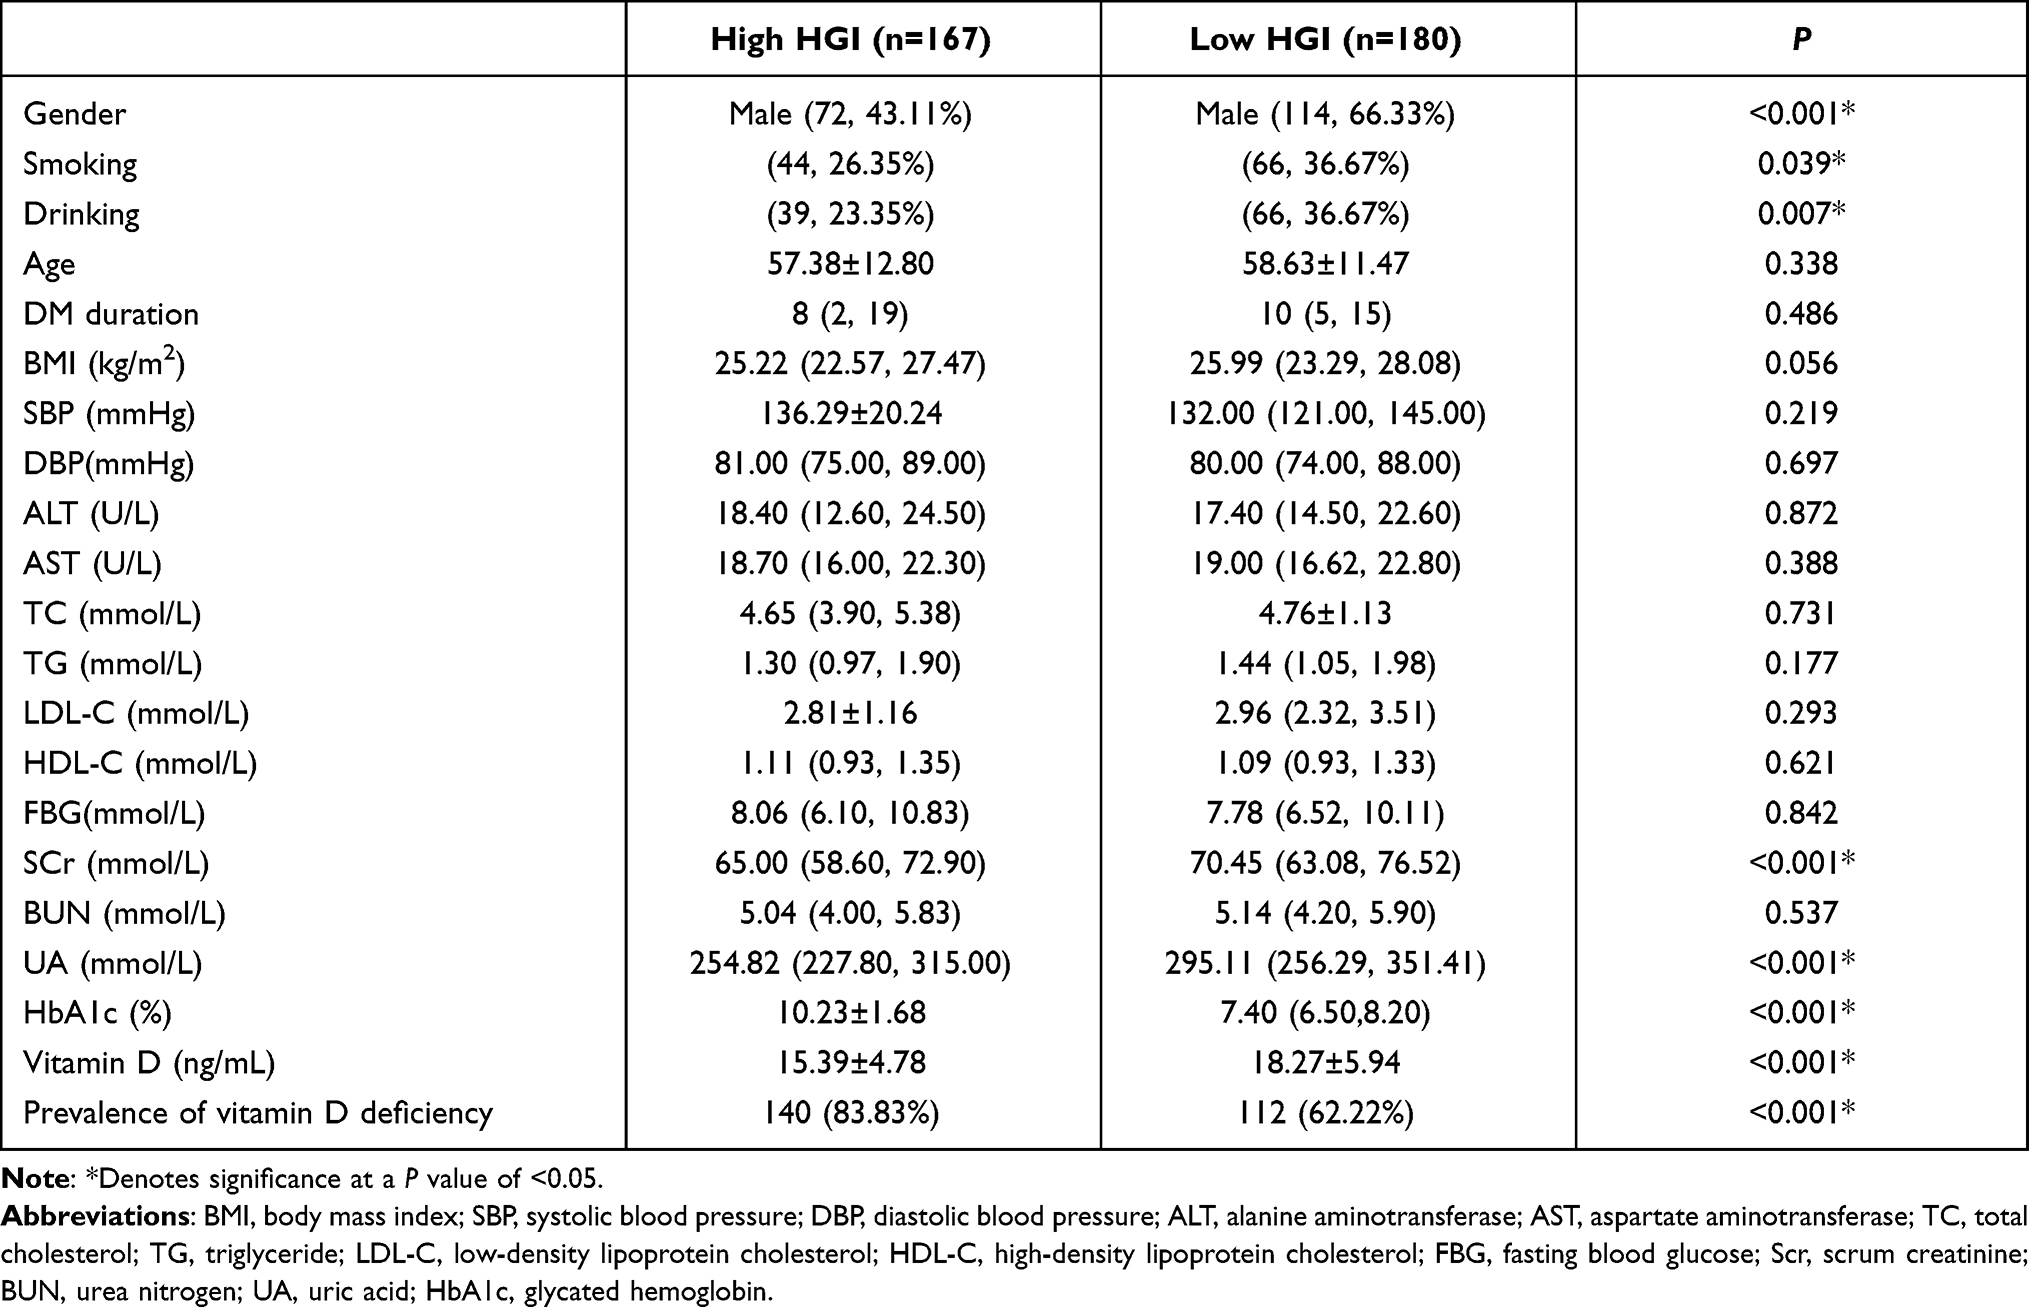 |
Table 3 Clinical Characteristics of All Patients with T2DM in the High and Low HGI Groups |
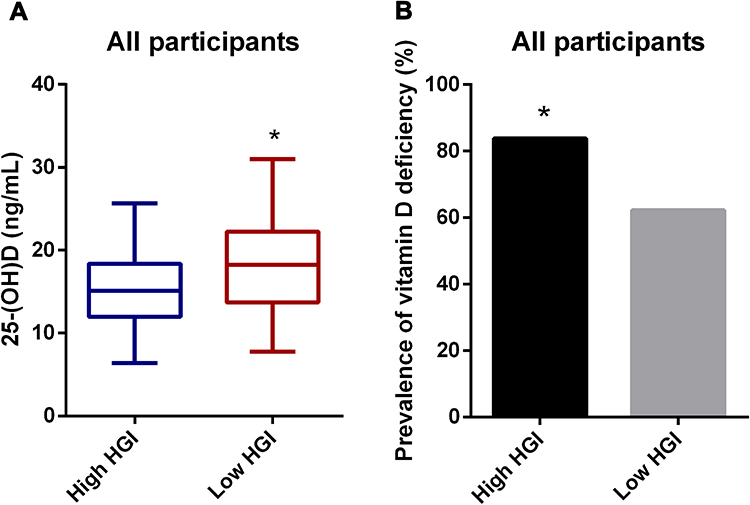 |
Figure 2 Comparisons of 25(OH)D levels and prevalence of vitamin D deficiency in the High HGI group and Low HGI group for all participants (A). Comparisons of 25(OH)D levels in the High HGI group and Low HGI group for all participants. (B) Comparisons of the prevalence of vitamin D deficiency in the High HGI group and Low HGI group for all participants. *Denotes significance at a P value of <0.05. |
Clinical Characteristics of Male and Female Patients with T2DM
Female patients with T2DM had lower levels of vitamin D than male patients with T2DM (P<0.001), while the levels of HGI were higher than male patients with T2DM (P<0.001, respectively). Compared to males with T2DM, female with T2DM had significantly higher levels of total cholesterol, low-density lipoprotein, and high-density lipoprotein, while creatinine and uric acid levels were significantly lower (Table 4).
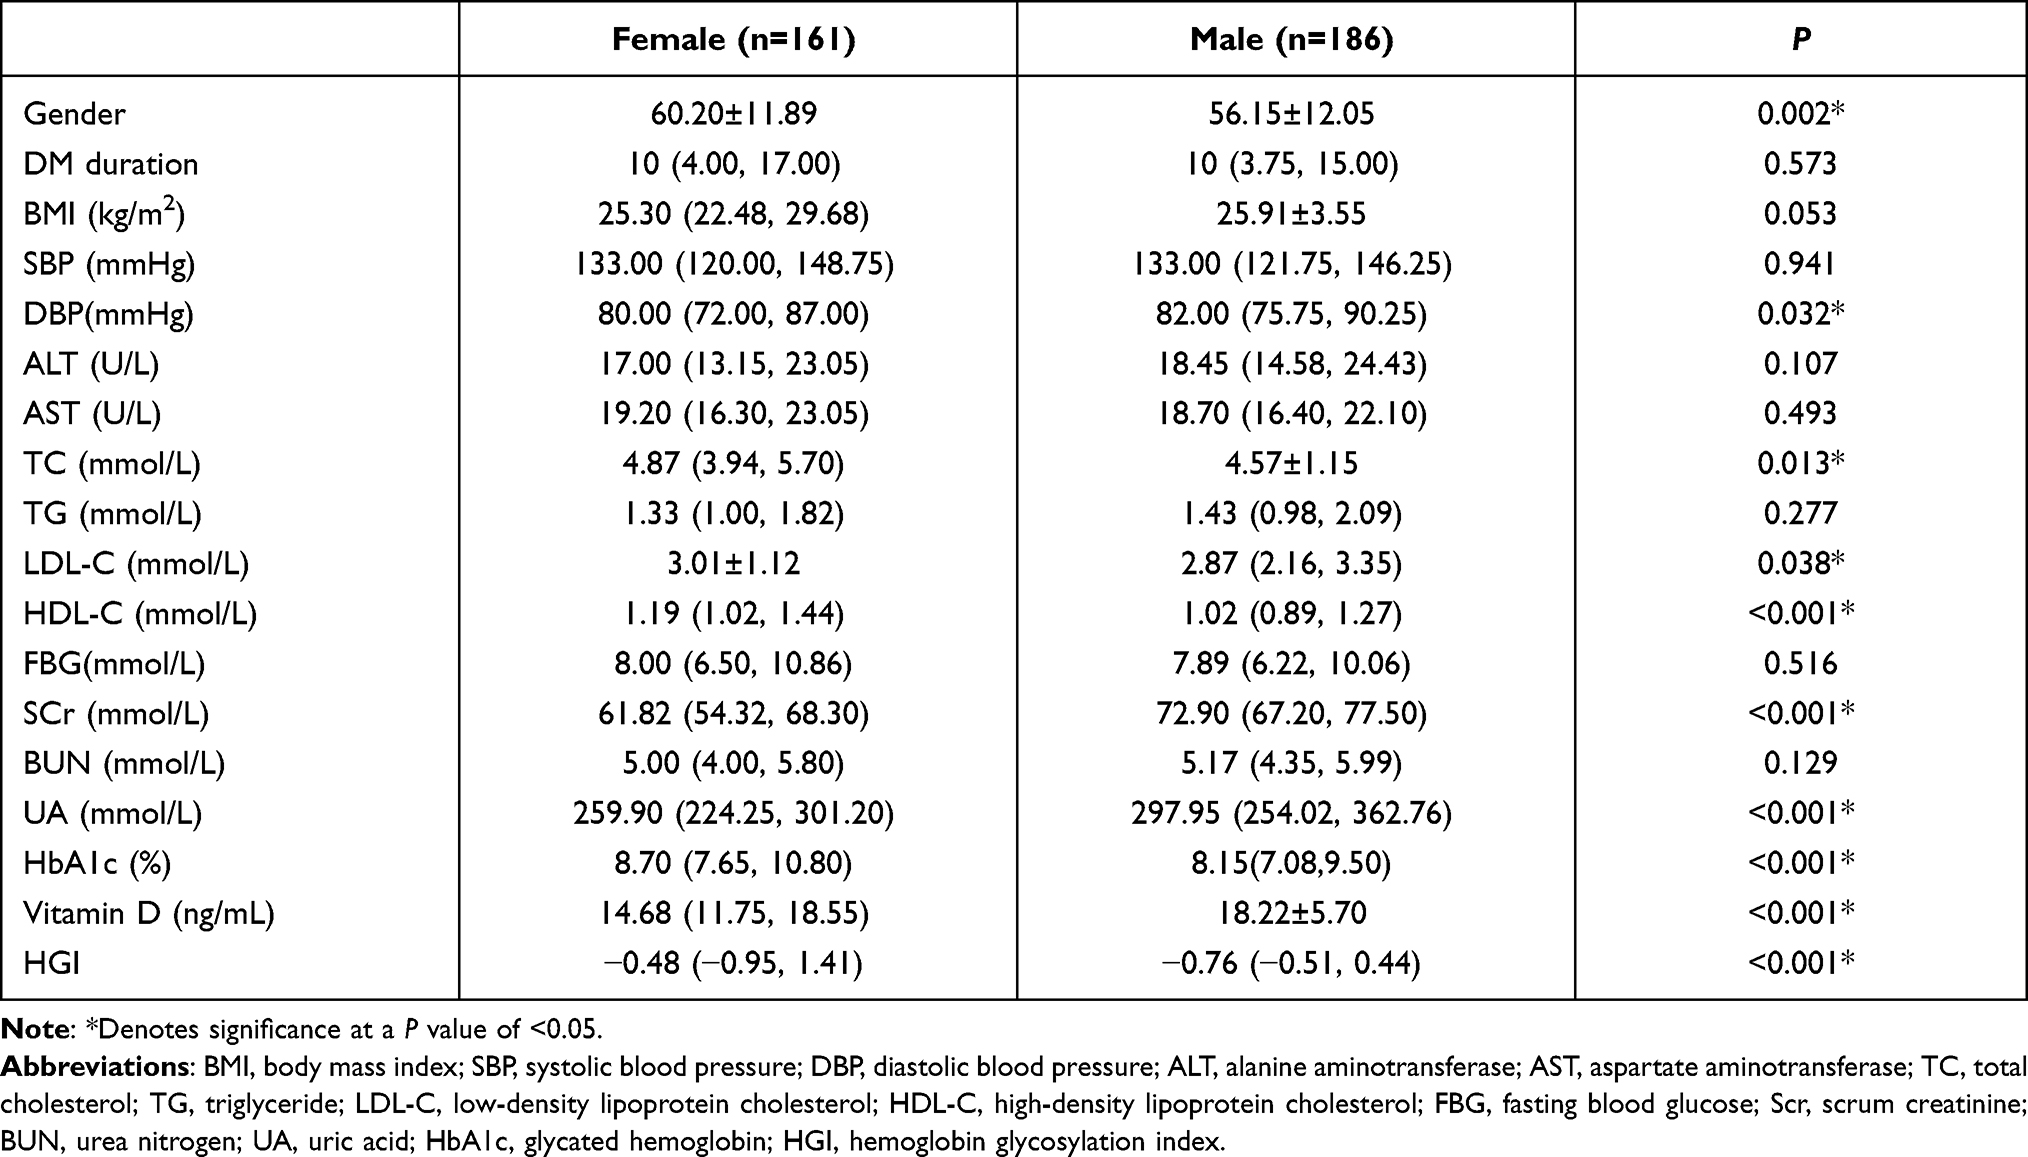 |
Table 4 Clinical Characteristics of Male and Female Patients with T2DM |
Compared with female patients without vitamin D deficiency, HbA1c and HGI values were significantly higher in females with vitamin D deficiency (P=0.001, P<0.001, respectively). However, there was no significant difference in HbA1c and HGI values between the no vitamin D deficiency male patients and vitamin D deficiency male patients (P=0.062, P=0.158, respectively) (Table 5). The difference of HGI levels and 25(OH)D levels in female group and male group is shown in Figure 3.
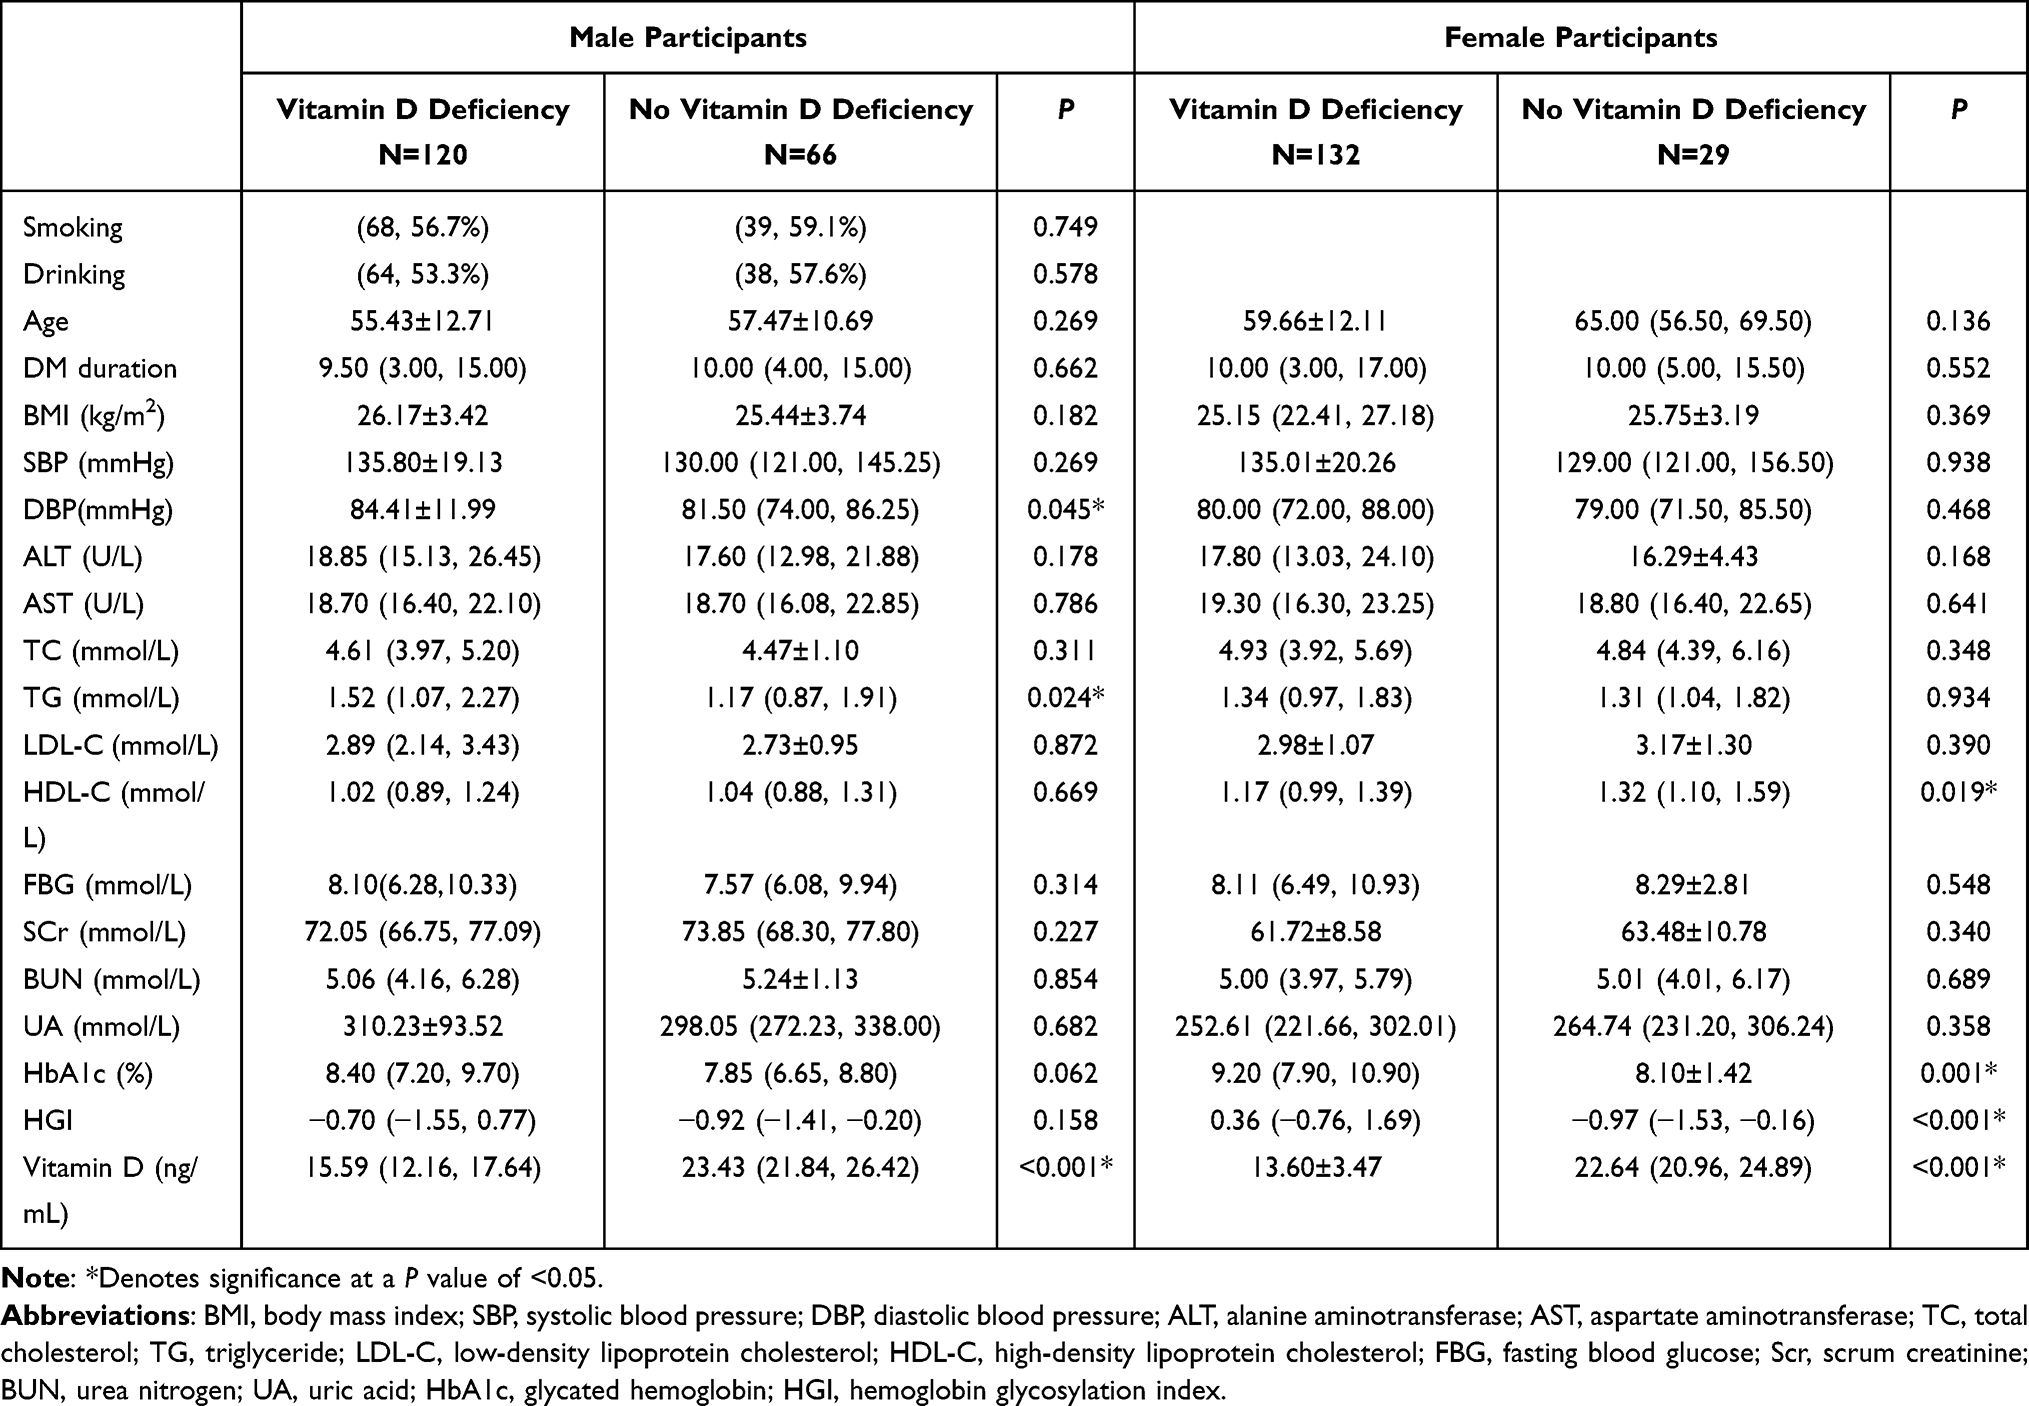 |
Table 5 Clinical Characteristics of Male and Female Patients with T2DM with and without Vitamin D Deficiency |
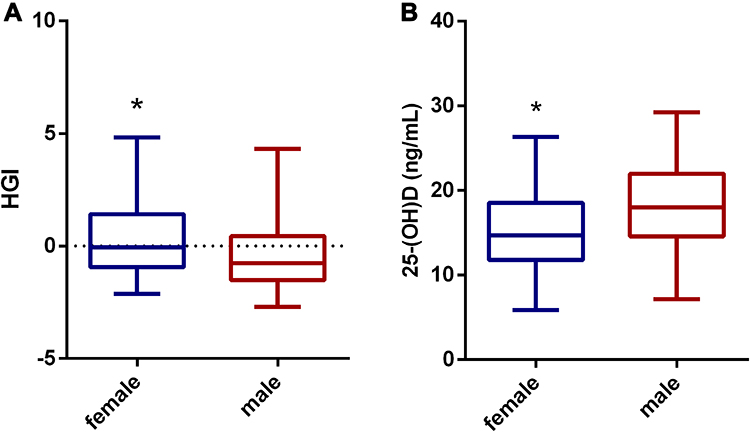 |
Figure 3 Comparisons of HGI levels and 25(OH)D levels in female group and male group for all participants. (A) Comparisons of HGI levels in female group and male group for all participants. (B) Comparisons of the 25(OH)D levels in female group and male group for all participants. *Denotes significance at a P value of <0.05. |
Correlation Between Vitamin D and HGI Levels in Patients with T2DM
Vitamin D was negatively correlated with HGI in all study subjects (r = −0.225, P < 0.001), and it was also negatively correlated with HGI in female patients with T2DM (r = −0.293, P < 0.001). However, there was no correlation between them in male with T2DM (r =0.090, P = 0.223) (Table 6) (Figure 4).
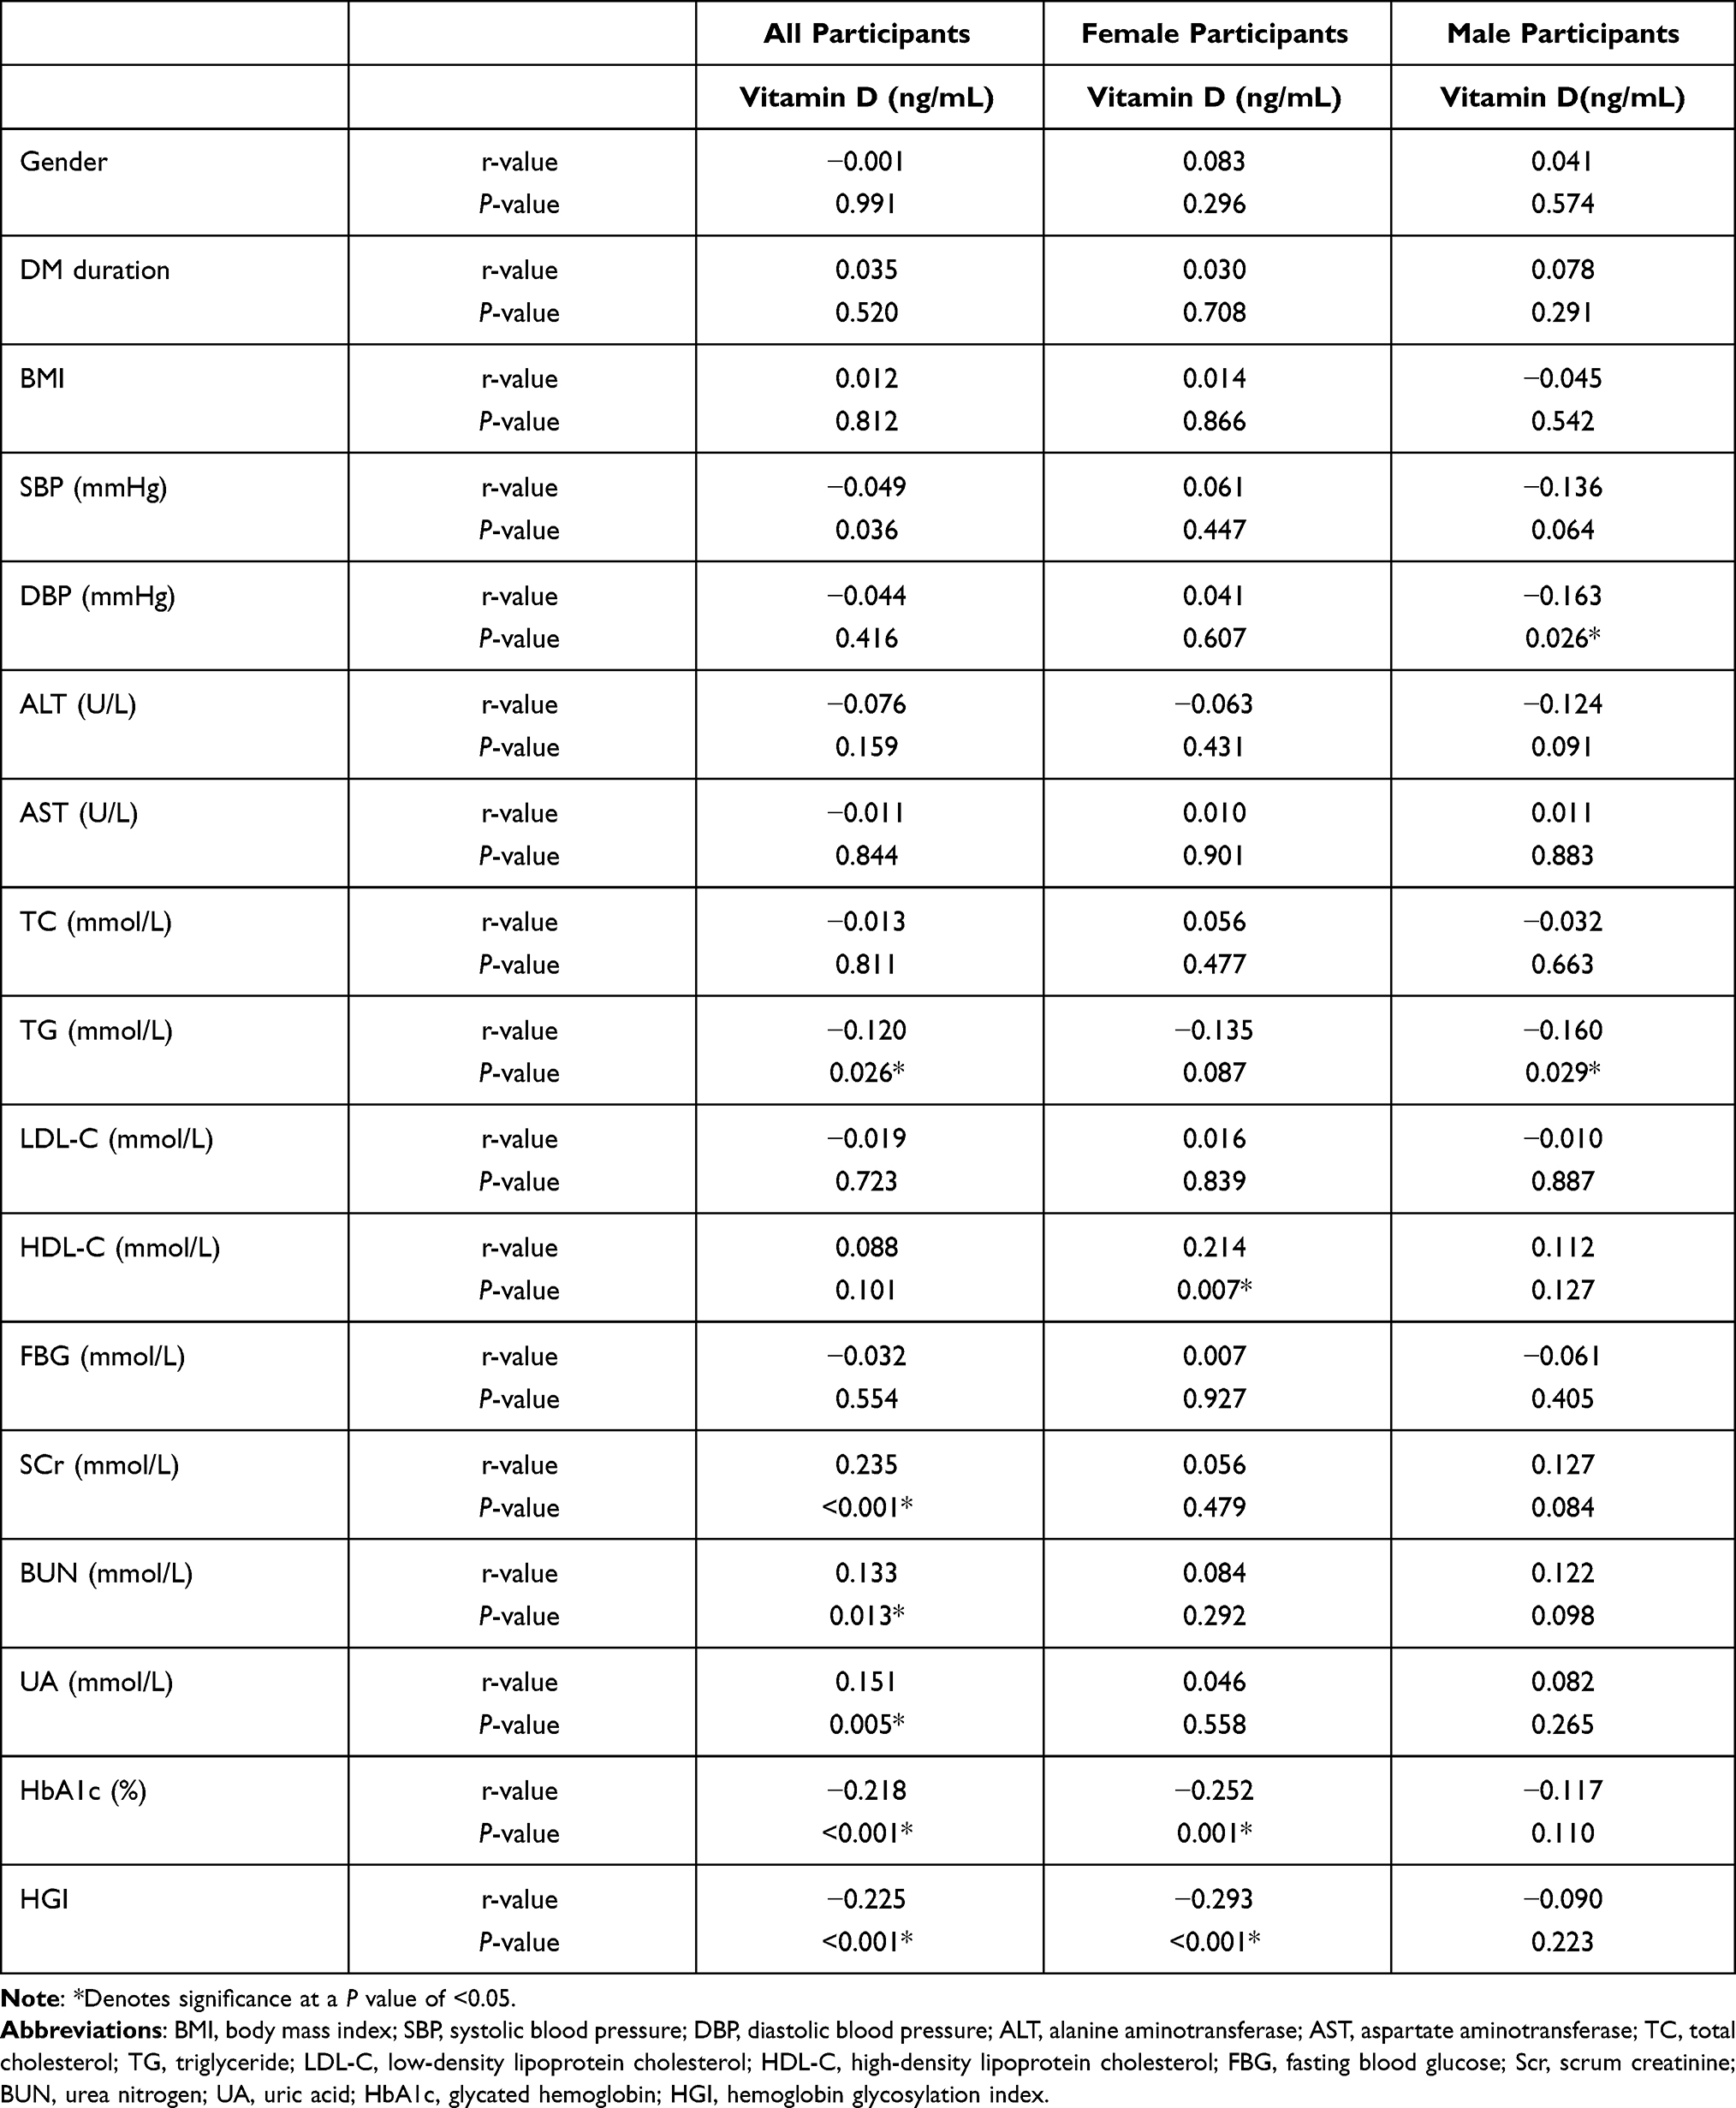 |
Table 6 Correlation Between Vitamin D and Other Factors in Patients with T2DM |
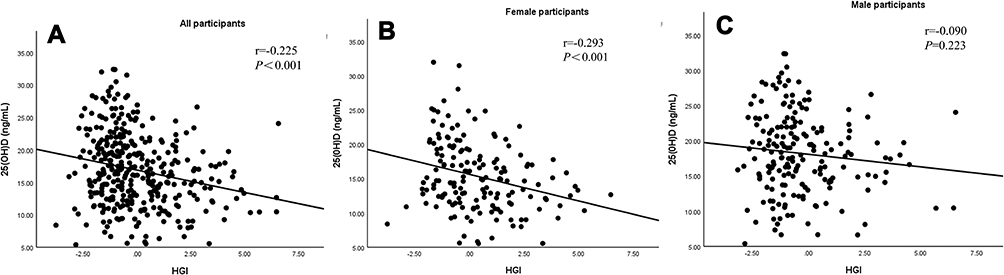 |
Figure 4 The correlation between vitamin D and HGI levels. (A) The correlation between vitamin D and HGI levels in all participants. (B) The correlation between vitamin D and HGI levels in female participants. (C) The correlation between vitamin D and HGI levels in male participants. |
Multivariate Linear Correlation Analysis of Vitamin D and HGI Levels in Patients with T2DM
For all participants, HGI was negatively correlated with vitamin D in the crude model 1 (β=−0.689, P<0.001), model 2 (adjusted for age, BMI, and duration of diabetes) (β=−0.676, P<0.001), model 3 (adjusted for age, BMI, duration of diabetes, total cholesterol, triglyceride, high-density lipoprotein cholesterol and low-density lipoprotein cholesterol) (β=−0.709, P<0.001) and model 4 (adjusted for age, BMI, duration of diabetes, total cholesterol, triglyceride, high-density lipoprotein cholesterol, low-density lipoprotein cholesterol, urea nitrogen, creatinine, uric acid) (β = −0.598, P<0.001) (Table 7).
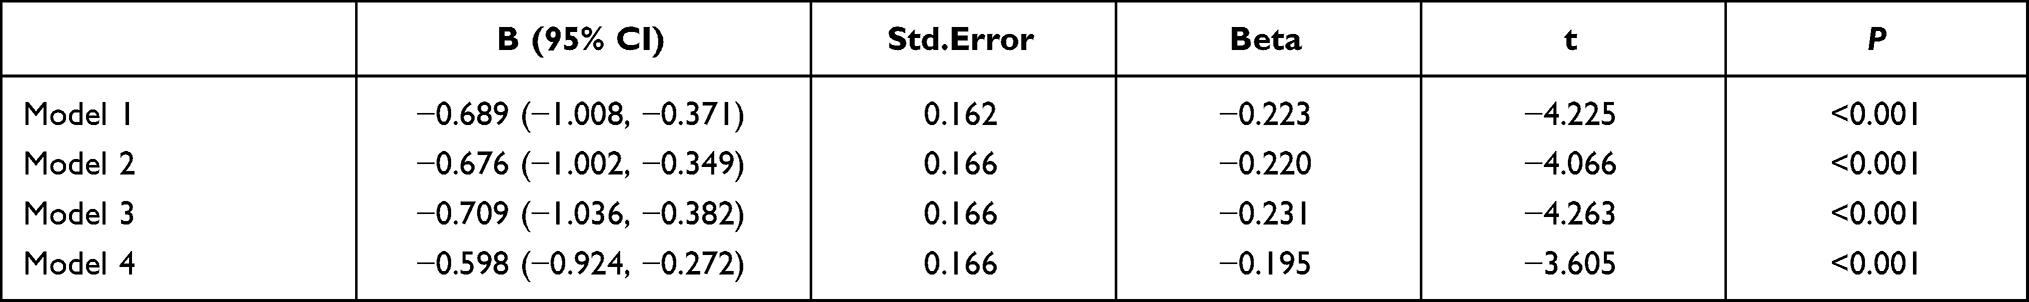 |
Table 7 Correlation Between Vitamin D and HGI in All Patients with T2DM |
HGI was negatively correlated with vitamin D levels in female patients with T2DM, regardless of whether an unadjusted or adjusted model was used (model 1: β = −0.277, P<0.001; model 2: β = −0.286, P<0.001; model 3: β=−0.283, P<0.001; model 4: β = −0.285, P<0.001) (Table 8).
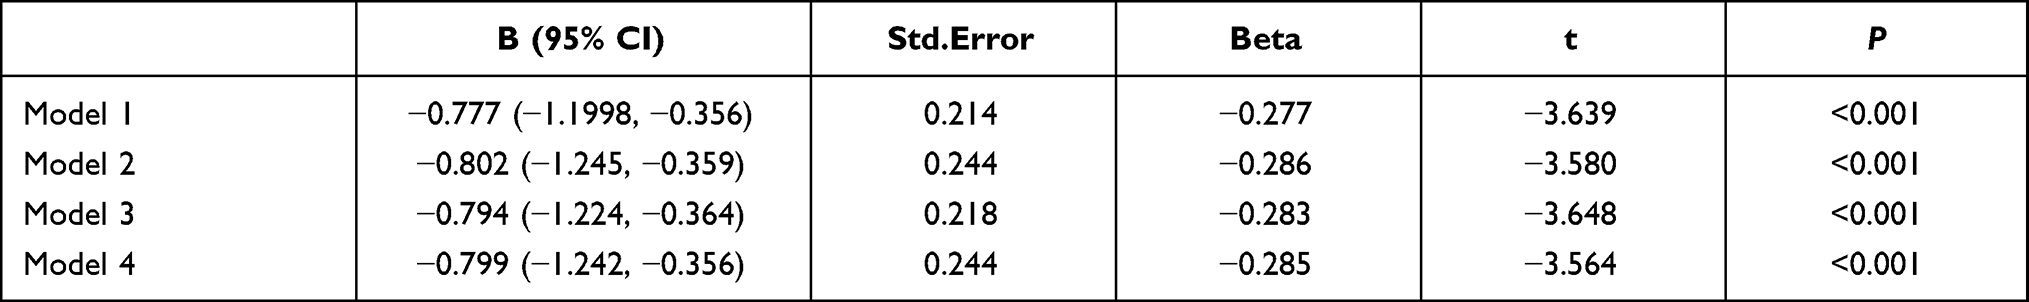 |
Table 8 Correlation Between Vitamin D and HGI in Female Patients with T2DM |
On the other hand, HGI was not associated with vitamin D levels in male patients with T2DM, regardless of the model used (model 1: β = −0.111, P = 0.133; model 2: β = −0.094, P = 0.214; model 3: β = −0.104, P = 0.173; model 4: β = −0.105, P = 0.166) (Table 9).
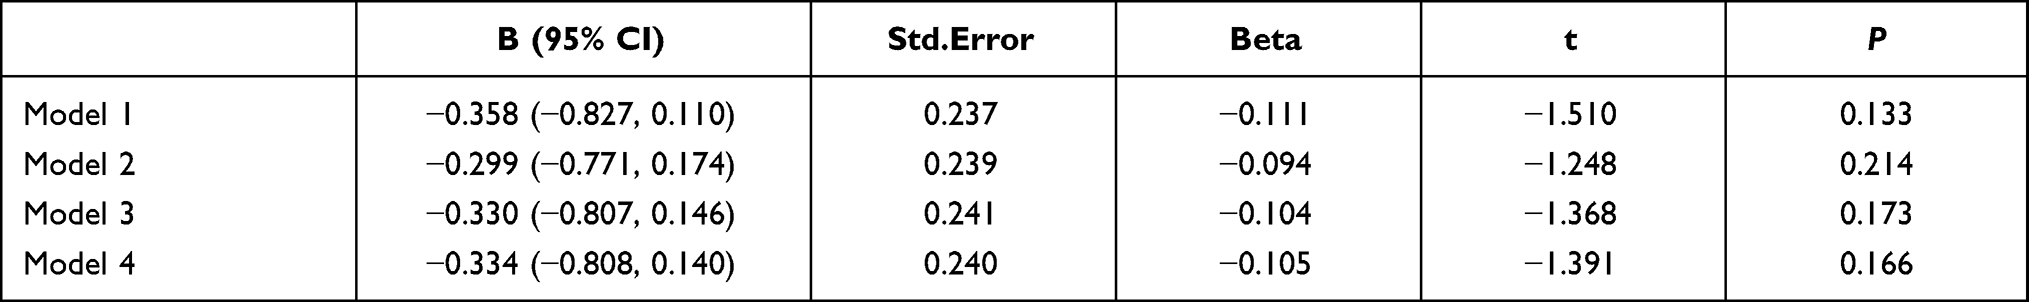 |
Table 9 Correlation Between Vitamin D and HGI in Male Patients with T2DM |
Discussion
Vitamin D deficiency is a risk factor for osteoporosis, and osteoporosis is a common public health problem in China. In recent years, the prevalence of osteoporosis has been increasing, affecting more than one-third of people aged 50 years and older.13 The most common prevention and treatment of osteoporosis is vitamin D supplementation.14 Vitamin D is one of the most-known lipoprotein hormones with metabolic properties, which plays an important role in calcium/phosphorus homeostasis, bone metabolism and skeletal development. Vitamin D is activated by hydroxylases in liver and kidney to become the active hormone (1,25(OH) 2D). On the one hand, 1,25(OH) 2D can increase intestinal absorption of calcium and phosphorus, and renal tubular reabsorption of calcium and phosphorus. These functions enable 1.25(OH)2D to elevate blood calcium levels and increase bone density. On the other hand, it can promote bone formation by affecting related transcription factors and directly acting on osteoblasts through vitamin D receptor (VDR). When patients have vitamin D deficiency, osteoblasts’ proliferation and differentiation ability are reduced, and it will eventually impair bone formation. In addition, vitamin D deficiency can lead to secondary hyperparathyroidism and significantly increase PTH levels. Large doses of PTH can increase bone resorption. The imbalance between bone formation and bone resorption can lead to osteoporosis.
Recently, an increasing number of studies have shown that vitamin D is also involved in diabetes. The incidence of T2DM continues to increase worldwide.15 The major points in the pathophysiology of T2DM are impaired insulin secretion, insulin resistance, and systemic inflammation.16 Studies have confirmed that vitamin D can have impacts on all of these pathophysiological pathways through vitamin D receptors on pancreatic β cells, skeletal muscle and adipocytes.17 First, 1.25(OH) 2D binds to VDRs on pancreatic β cells and directly affects insulin secretion.18,19 In addition, 1.25(OH) 2D can increase insulin receptor expression, activate insulin receptors and enhance insulin mediated glucose transport.20 Vitamin D can reduce peripheral insulin resistance by inhibiting adipocyte differentiation and adipogenesis and reducing the expression of peroxisome proliferator-active receptor-γ.21 Moreover, vitamin D can regulate the immunological reaction of macrophages and monocytes, reduce the production of inflammatory factors and alleviate the inflammatory response. Therefore, vitamin D can further reduce insulin resistance.1 Although the effect of vitamin D on T2DM is not fully understood, recent studies have shown an inverse correlation between vitamin D levels and glycemic control.2,6,22 Only few studies failed to find the correlation between HbA1c and vitamin D.23
HbA1c level is universally considered a gold standard for monitoring glucose control. However, studies have found differences between HbA1c and actual monitored blood glucose levels. Moreover, recent studies have demonstrated that only 60–80% of the variation in HbA1c levels could be explained by the mean blood glucose level.24 The value of HbA1c can be affected by many biological factors, including age, glucose metabolism, erythrocyte age, liver and kidney disease, etc.25 To overcome the limitations of HbA1c, HGI has been established to quantify the variance, which was suggested as an alternative method to account for glycemic variations.26
Our study found that HGI was inversely associated with vitamin D levels, which also indicated that vitamin D is inversely associated with glycemic control in patients with T2DM.
HGI has been reported to reflect advanced glycation end products (AGEs). Individuals with higher HGI have increased levels of AGEs in liver and skin.27 In addition, one study had found that vitamin D levels were inversely associated with AGEs in the skin.28 Behind the negative association between AGEs and vitamin D, the potential underlying mechanism is that vitamin D can reduce oxidative stress, which may further reduce the formation of AGEs and pro-inflammatory cytokines.29 When patients have vitamin D deficiency, the oxidative stress increases, which can increase the formation of AGEs. Since HGI can reflect AGEs, subjects with vitamin D deficiency may have higher HGI levels.
Several studies have investigated the association among HGI, diabetic complications and various chronic diseases in diabetes. High HGI levels can serve as an identifier for individuals with T2DM who may have higher risks of diabetes complications. Higher HGI levels have been proposed to identify a phenotype of glucose metabolism, which is characterized by an increased susceptibility to protein glycation and tissue accumulation of AGEs.28 The higher degree of nonenzymatic glycation of intracellular proteins and the higher AGEs levels may be the pathogenic factors of diabetic complications.12 High HGI has been reported to be associated with increased risks of cardiovascular disease, diabetic retinopathy and nephropathy in diabetic individuals.8,9,11 And in non-diabetic individuals, subjects with high HGI have a higher prevalence of non-alcoholic fatty liver disease, carotid atherosclerosis.30,31 This study found a higher prevalence of vitamin D deficiency in patients with high HGI, and the HGI levels were inversely correlated with vitamin D.
In this study, we found that females had higher HGI levels than males. HGI levels were independently and inversely associated with vitamin D levels in females with T2DM. In the male-only group, there was no correlation between HGI and vitamin D levels, regardless of adjusted or non-adjusted confounding factors. In addition, some studies have suggested a stronger association of female with high HGI.32,33 On the contrary, gender difference of HGI was not observed in many studies.34,35 The effect of gender on HGI is still controversial and inconclusive. This study also found that female patients had lower vitamin D levels than male patients, which are influenced by exercise, hormones, etc.
There were limitations to this study. First, this study was a cross-sectional study, and the causality of the negative association between vitamin D levels and HGI could not be confirmed. Second, outdoor activities, season, and diet should be considered in future studies of vitamin D levels. And, this study did not assess the predictors affecting glycemic control, such as medication adherence and usage rate of insulin.
In conclusion, this study found a higher prevalence of vitamin D deficiency in patients with high HGI. We speculated that high HGI is a risk factor for patients with type 2 diabetes. Moreover, there was an independent negative association between HGI and vitamin D levels in patients with T2DM, whereas this association differs between female and male patients with T2DM.
Disclosure
The authors report no conflicts of interest in this work.
References
1. Wang W, Ye S, Qian L, Xing X. Sex-specific association of serum 25-hydroxyvitamin D(3) with insulin resistance in Chinese han patients with newly diagnosed type 2 diabetes mellitus. J Nutr Sci Vitaminol. 2018;64(3):173–178. doi:10.3177/jnsv.64.173
2. Zhao H, Zhen Y, Wang Z, et al. The relationship between vitamin D deficiency and glycated hemoglobin levels in patients with type 2 diabetes mellitus. Diabetes Metab Syndr Obes. 2020;13:3899–3907. doi:10.2147/DMSO.S275673
3. Alaei-Shahmiri F, Khamseh ME, Manhoei K, Yadegari H, Kazemi H, Meshkini M. The optimal vitamin D cut-off value associated with hyperglycemia in an Iranian population. J Diabetes Metab Disord. 2020;19(1):5–12. doi:10.1007/s40200-019-00433-y
4. Holick MF. Vitamin D: evolutionary, physiological and health perspectives. Curr Drug Res. 2011;12(1):4–18. doi:10.2174/138945011793591635
5. Holick MF. Vitamin D deficiency. N Engl J Med. 2007;357(3):266–281. doi:10.1056/NEJMra070553
6. Dhas Y, Banerjee J, Damle G, Mishra N. Association of vitamin D deficiency with insulin resistance in middle-aged type 2 diabetics. Clin Chim Acta. 2019;492:95–101. doi:10.1016/j.cca.2019.02.014
7. Wilson DM, Xing D, Cheng J, et al. Persistence of individual variations in glycated hemoglobin: analysis of data from the Juvenile diabetes research foundation continuous glucose monitoring Randomized Trial. Diabetes Care. 2011;34(6):1315–1317. doi:10.2337/dc10-1661
8. van Steen SC, Woodward M, Chalmers J, et al. Haemoglobin glycation index and risk for diabetes-related complications in the action in diabetes and vascular disease: preterax and diamicron modified release controlled evaluation (ADVANCE) trial. Diabetologia. 2018;61(4):780–789. doi:10.1007/s00125-017-4539-1
9. Kim W, Go T, Kang DR, Lee EJ, Huh JH. Hemoglobin glycation index is associated with incident chronic kidney disease in subjects with impaired glucose metabolism: a 10-year longitudinal cohort study. J Diabetes Complications. 2021;35(1):107760. doi:10.1016/j.jdiacomp.2020.107760
10. McCarter RJ, Hempe JM, Gomez R, Chalew SA. Biological variation in HbA1c predicts risk of retinopathy and nephropathy in type 1 diabetes. Diabetes Care. 2004;27(6):1259–1264. doi:10.2337/diacare.27.6.1259
11. Hempe JM, Liu S, Myers L, McCarter RJ, Buse JB, Fonseca V. The hemoglobin glycation index identifies subpopulations with harms or benefits from intensive treatment in the ACCORD trial. Diabetes Care. 2015;38(6):1067–1074. doi:10.2337/dc14-1844
12. Kim MK, Jeong JS, Yun JS, et al. Hemoglobin glycation index predicts cardiovascular disease in people with type 2 diabetes mellitus: a 10-year longitudinal cohort study. J Diabetes Complications. 2018;32(10):906–910. doi:10.1016/j.jdiacomp.2018.08.007
13. Chen P, Li Z, Hu Y. Prevalence of osteoporosis in China: a meta-analysis and systematic review. BMC Public Health. 2016;16(1):1039. doi:10.1186/s12889-016-3712-7
14. Chen Y, Cheng J, Chen Y, et al. Association between serum vitamin D and uric acid in the eastern Chinese population: a population-based cross-sectional study. BMC Endocr. 2020;20(1):79.
15. Guariguata L, Whiting DR, Hambleton I, Beagley J, Linnenkamp U, Shaw JE. Global estimates of diabetes prevalence for 2013 and projections for 2035. Diabetes Res Clin Pract. 2014;103(2):137–149. doi:10.1016/j.diabres.2013.11.002
16. Leahy JL. Pathogenesis of type 2 diabetes mellitus. Arch Med Res. 2005;36(3):197–209. doi:10.1016/j.arcmed.2005.01.003
17. Kaya T, Akçay E, Ertürk Z, Ergenç H, Tamer A. The relationship between vitamin D deficiency and erythrocyte sedimentation rate in patients with diabetes. Turk J Med Sci. 2018;48(2):424–429. doi:10.3906/sag-1712-28
18. Bourlon PM, Billaudel B, Faure-Dussert A. Influence of vitamin D3 deficiency and 1,25 dihydroxyvitamin D3 on de novo insulin biosynthesis in the islets of the rat endocrine pancreas. J Endocrinol. 1999;160(1):87–95. doi:10.1677/joe.0.1600087
19. Zeitz U, Weber K, Soegiarto DW, Wolf E, Balling R, Erben RG. Impaired insulin secretory capacity in mice lacking a functional vitamin D receptor. FASEB J. 2003;17(3):509–511. doi:10.1096/fj.02-0424fje
20. Maestro B, Campión J, Dávila N, Calle C. Stimulation by 1,25-dihydroxyvitamin D3 of insulin receptor expression and insulin responsiveness for glucose transport in U-937 human promonocytic cells. EndocrJ. 2000;47(4):383–391. doi:10.1507/endocrj.47.383
21. Narvaez CJ, Simmons KM, Brunton J, Salinero A, Chittur SV, Welsh JE. Induction of STEAP4 correlates with 1,25-dihydroxyvitamin D3 stimulation of adipogenesis in mesenchymal progenitor cells derived from human adipose tissue. J Cell Physiol. 2013;228(10):2024–2036. doi:10.1002/jcp.24371
22. Erkus E, Aktas G. Diabetic regulation of subjects with type 2 diabetes mellitus is associated with serum vitamin D levels. Rev Assoc Med Bras (1992). 2019;65(1):51–55. doi:10.1590/1806-9282.65.1.51
23. Mariam W, Garg S, Singh MM, Koner BC, Anuradha S, Basu S. Vitamin D status, determinants and relationship with biochemical profile in women with Type 2 diabetes mellitus in Delhi, India. Diabetes Metab Syndr. 2019;13(2):1517–1521. doi:10.1016/j.dsx.2019.03.005
24. Nathan DM, Kuenen J, Borg R, Zheng H, Schoenfeld D, Heine RJ. Translating the A1C assay into estimated average glucose values. Diabetes Care. 2008;31(8):1473–1478. doi:10.2337/dc08-0545
25. Cohen RM, Snieder H, Lindsell CJ, et al. Evidence for independent heritability of the glycation gap (glycosylation gap) fraction of HbA1c in nondiabetic twins. Diabetes Care. 2006;29(8):1739–1743. doi:10.2337/dc06-0286
26. Hempe JM, Gomez R, McCarter RJ
27. Simental-Mendía LE, Rodríguez-Morán M, Guerrero-Romero F. The product of fasting glucose and triglycerides as surrogate for identifying insulin resistance in apparently healthy subjects. Metab Syndr Relat Disord. 2008;6(4):299–304. doi:10.1089/met.2008.0034
28. Krul-Poel YH, Agca R, Lips P, van Wijland H, Stam F, Simsek S. Vitamin D status is associated with skin autofluorescence in patients with type 2 diabetes mellitus: a preliminary report. Cardiovasc Diabetol. 2015;14(1):89. doi:10.1186/s12933-015-0250-z
29. Miyata T. Alterations of non-enzymatic biochemistry in uremia, diabetes, and atherosclerosis (“carbonyl stress”). Bull Mem Acad R Med Belg. 2002;157(3–4):
30. Hu DS, Zhu SH, Li X, et al. Association between hemoglobin glycation index and NAFLD in Chinese nondiabetic individuals. Can J Gastroenterol Hepatol. 2019;2019:8748459. doi:10.1155/2019/8748459
31. Hempe JM, Soros AA, Chalew SA. Estimated average glucose and self-monitored mean blood glucose are discordant estimates of glycemic control. Diabetes Care. 2010;33(7):1449–1451. doi:10.2337/dc09-1498
32. Nagayama D, Watanabe Y, Yamaguchi T, Saiki A, Shirai K, Tatsuno I. High hemoglobin glycation index is associated with increased systemic arterial stiffness independent of hyperglycemia in real-world Japanese population: a cross-sectional study. Diabetes Vasc Dis Res. 2020;17(9):1479164120958625. doi:10.1177/1479164120958625
33. Ahn CH, Min SH, Lee DH, et al. Hemoglobin glycation index is associated with cardiovascular diseases in people with impaired glucose metabolism. J Clin Endocrinol Metab. 2017;102(8):2905–2913. doi:10.1210/jc.2017-00191
34. Lee B, Heo YJ, Lee YA, et al. Association between hemoglobin glycation index and cardiometabolic risk factors in Korean pediatric nondiabetic population. Ann Pediatr Endocrinol Metab. 2018;23(4):196–203. doi:10.6065/apem.2018.23.4.196
35. van Steen SC, Schrieks IC, Hoekstra JB, et al. The haemoglobin glycation index as predictor of diabetes-related complications in the AleCardio trial. Eur J Prev Cardiol. 2017;24(8):858–866. doi:10.1177/2047487317692664
 © 2021 The Author(s). This work is published and licensed by Dove Medical Press Limited. The
full terms of this license are available at https://www.dovepress.com/terms
and incorporate the Creative Commons Attribution
- Non Commercial (unported, 3.0) License.
By accessing the work you hereby accept the Terms. Non-commercial uses of the work are permitted
without any further permission from Dove Medical Press Limited, provided the work is properly
attributed. For permission for commercial use of this work, please see paragraphs 4.2 and 5 of our Terms.
© 2021 The Author(s). This work is published and licensed by Dove Medical Press Limited. The
full terms of this license are available at https://www.dovepress.com/terms
and incorporate the Creative Commons Attribution
- Non Commercial (unported, 3.0) License.
By accessing the work you hereby accept the Terms. Non-commercial uses of the work are permitted
without any further permission from Dove Medical Press Limited, provided the work is properly
attributed. For permission for commercial use of this work, please see paragraphs 4.2 and 5 of our Terms.