Back to Journals » Neuropsychiatric Disease and Treatment » Volume 13
The regional neuronal activity in left posterior middle temporal gyrus is correlated with the severity of chronic aphasia
Authors Li J, Du D, Gao W, Sun X, Xie H, Zhang G, Li J, Li H, Li K ![]()
Received 20 April 2017
Accepted for publication 20 June 2017
Published 20 July 2017 Volume 2017:13 Pages 1937—1945
DOI https://doi.org/10.2147/NDT.S140091
Checked for plagiarism Yes
Review by Single anonymous peer review
Peer reviewer comments 2
Editor who approved publication: Dr Roger Pinder
Jianlin Li,1,* Dunren Du,2,* Wei Gao,1 Xichun Sun,3 Haizhu Xie,1 Gang Zhang,1 Jian Li,1 Honglun Li,1 Kefeng Li4
1Department of Radiology, Yantai Yuhuangding Hospital, 2Department of Radiology, Yantai Laishan Branch Hospital of Yuhuangding Hospital, Medical College of Qingdao University, 3Department of Radiology, Yantai Hospital of Traditional Chinese Medicine, Yantai, China; 4School of Medicine, University of California, San Diego, CA, USA
*These authors contributed equally to this work
Background: Aphasia is one of the most disabling cognitive deficits affecting >2 million people in the USA. The neuroimaging characteristics of chronic aphasic patients (>6 months post onset) remain largely unknown.
Objective: The objective of this study was to investigate the regional signal changes of spontaneous neuronal activity of brain and the inter-regional connectivity in chronic aphasia.
Materials and methods: Resting-state blood oxygenation level-dependent functional magnetic resonance imaging (fMRI) was used to obtain fMRI data from 17 chronic aphasic patients and 20 healthy control subjects in a Siemens Verio 3.0T MR Scanner. The amplitude of low-frequency fluctuation (ALFF) was determined, which directly reflects the regional neuronal activity. The functional connectivity (FC) of fMRI was assessed using a seed voxel linear correlation approach. The severity of aphasia was evaluated by aphasia quotient (AQ) scores obtained from Western Aphasia Battery test.
Results: Compared with normal subjects, aphasic patients showed decreased ALFF values in the regions of left posterior middle temporal gyrus (PMTG), left medial prefrontal gyrus, and right cerebellum. The ALFF values in left PMTG showed strong positive correlation with the AQ score (coefficient r=0.79, P<0.05). There was a positive FC in chronic aphasia between left PMTG and left inferior temporal gyrus (BA20), fusiform gyrus (BA37), and inferior frontal gyrus (BA47\45\44).
Conclusion: Left PMTG might play an important role in language dysfunction of chronic aphasia, and ALFF value might be a promising indicator to evaluate the severity of aphasia.
Keywords: aphasia, severity, ALFF, correlation, functional connectivity, aphasia quotient
Introduction
Aphasia is a common neurological language-based disorder that affects >2 million people in the USA. Aphasia frequently occurs after a stroke, head injury, or brain tumor, and almost one third of stroke patients have aphasia.1 The symptoms of aphasia vary across individuals such as slowed or halting speech, word-finding hesitations, and difficulty in understanding or following conversation. Although the damage of brain domains controlling language and speech in aphasia has been well accepted, the neurobiological mechanisms underlying the progression and severity of aphasia are poorly understood.
The severity of aphasia can be assessed by the Western Aphasia Battery (WAB), which was shortened by Andrew Kertesz in reference to the Boston Diagnostic Aphasia Examination in 1982 and has been widely used in the West.2 The WAB mainly evaluates the capabilities of spontaneous speech (SS), auditory comprehension (AC), repetition, and naming. After an aphasia examination, the aphasia quotient (AQ) is used to indicate the degree of language dysfunction, reflect the severity of aphasia, and predict aphasia outcome and deterioration.3
Functional magnetic resonance imaging (fMRI) is an imaging technique that is used to evaluate the regional neuronal activity by measuring hemodynamic changes. The blood oxygenation level-dependent (BOLD)-fMRI is the widely used imaging technique for measuring the relative content of regional oxyhemoglobin and deoxyhemoglobin on a T2-weighted signal influence, thereby indirectly reflecting the regional neuronal activity. Resting-state fMRI requires subjects to keep quiet, lie still, and avoid any thinking, or sleep during the scan. Biswal et al found that the synchronous low-frequency fluctuation (LFF) was highly coherent among motor cortices during the resting state.4 In recent years, several resting-state fMRI studies have shown the existence of LFF in the language system,5 the default network,6 and the attention system.7 LFF was also used to study brain diseases such as Alzheimer’s disease,8 mild cognitive impairment (MCI),9 and agnosia10 and to determine the functional connections in these conditions.11
Brain functional connectivity (FC) of aphasia has been explored in several recent studies using fMRI.12–14 Compared to the controls, reduced FC was discovered in aphasic patients between left frontoparietal network (LFPN) and the right middle frontal cortex, medial frontal cortex, and right inferior frontal cortex.12 Balaev et al found the decreased FC between posterior part of the default mode (pDMN) and right frontoparietal networks.13 The brain connectivity for resting state networks decreases with the increase of aphasia severity.14 Although the functional connections can identify brain networks including various brain regions from the whole brain, they cannot reveal the regional brain spontaneous neuronal activity (SNA) which leads to the changes in BOLD signal. Therefore, abnormal function connections between certain brain areas could not make the clear diagnosis.
The amplitude of low-frequency fluctuation (ALFF) calculates the amplitude change of the BOLD signal from the perspective of energy metabolism, and the resting-state BOLD-fMRI can adopt ALFF algorithm and directly reflect the extent of the regional brain SNA and metabolic activities.15 The ALFF has been widely used to examine the SNA of the regional brain in diseases such as MCI,16 epilepsy,17 and Parkinson’s disease.18
However, only a few studies to date have explored the ALFF in aphasia, and most of these studies focused on the early stages of post stroke. For instance, increased ALFF was found in right temporal regions and decreased ALFF in left frontal regions of aphasic patients.19 No study has examined the ALFF and its association with the severity in the chronic aphasic patients.
In this study, we applied two fMRI metrics to investigate the changes of regional SNA and the inter-regional FC. We compared the ALFF in aphasic patients with the healthy control subjects and examined its correlation with aphasia severity indicated by AQ. In addition, we measured the inter-regional FC. Our study provided valuable information regarding the pathophysiological mechanisms of chronic aphasia which could potentially improve aphasia therapy and recovery.
Materials and methods
Subjects
The study was approved by Yantai Yuhuangding Hospital Institutional Review Board (IRB Project 2015012172) and conformed to the World Medical Association Declaration of Helsinki: Ethical Principles for Medical Research Involving Human Subjects. Written informed consent was obtained from all subjects who participated in the study. A total of 17 aphasic patients (average age: 64±5.9 years, female and male 7/10 cases) were recruited between December 2015 and September 2016 from Yantai Yuhuangding Hospital (Table 1). All the subjects were right-handed, monolingual, and native Chinese speakers with no history of prior neurologic or psychiatric conditions. All the patients suffered a single cerebrovascular accident (≥6 months) involving the left cerebral hemisphere, and the related lesions were verified by magnetic resonance imaging (MRI). The healthy control group included 20 cognitively normal subjects with matched gender and age (average 60±3.1 years, female and male 9/11 cases).
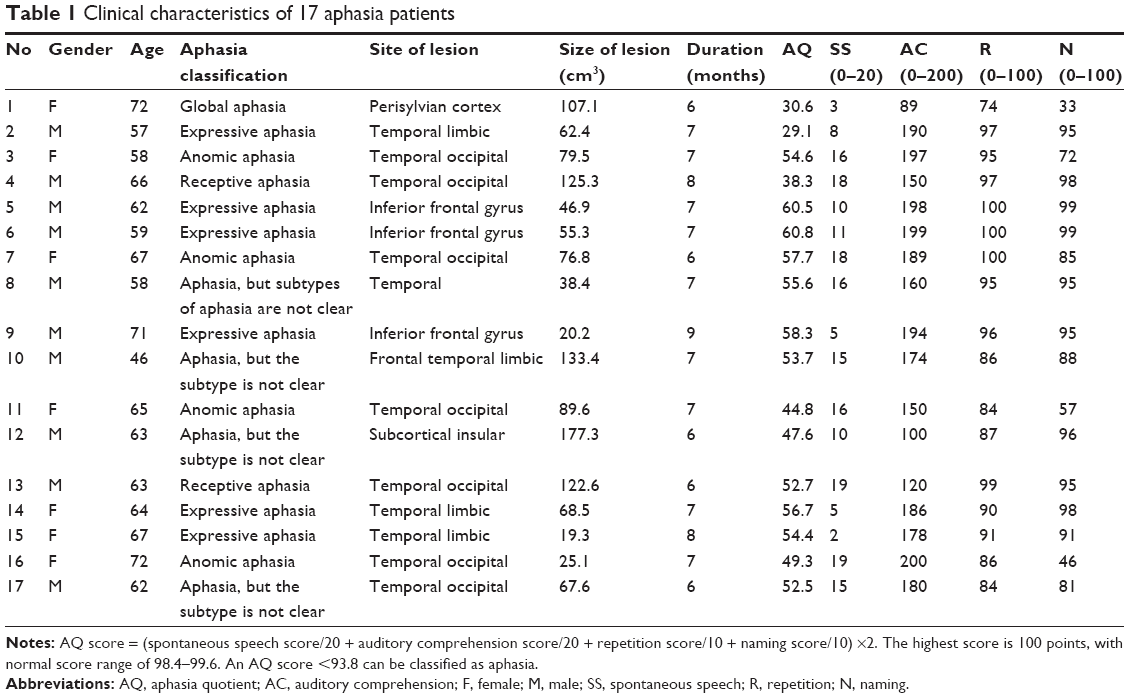 | Table 1 Clinical characteristics of 17 aphasia patients |
Clinical aphasia assessment
The WAB was used to assess aphasia severity on the day before fMRI examination. The indicators of WAB included spontaneous language, listening comprehension, repetition, and naming. AQ was acquired after the examination. It can reflect the severity of aphasia and can also be used as the index for evaluating improvement and deterioration of aphasia. The highest AQ score is 100, and its normal range is 98.4~99.6. AQ <93.8 can be rated as aphasia.
Image acquisition
MRI scanning was performed on a Siemens Spectra 3.0 Tesla scanner (Siemens, Shenzhen, China). All of the resting-state functional data were acquired using an echo-planar imaging sequence with the following parameters: repetition time/echo time (TR/TE) =2,330/30 ms, slice thickness =3 mm, slices =36, field of view (FOV) =240×240 mm2, base resolution =64×64, voxel size =3.8×3.8×3.0 mm3, and flip angle =90°. For each subject, a high-resolution T1-weighted anatomical image was acquired in a sagittal orientation using 3DT1 Magnetization Prepared Rapid Gradient Echo (MPRAGE) with the following parameters: TR/TE =2,300/2.52 ms, inversion time (TI) =900 ms; slice thickness =1 mm, slab =176; FOV =256×256 mm2; base resolution =256×256, voxel size =1.0×1.0×1.0 mm3, and flip angle =9°.
fMRI data preprocessing
The first five volumes of functional time series of each subject were discarded due to the possible instability in initial MRI signal and subject’s adaptation to scanning environment. The resting data were preprocessed using a Data Processing Assistant for Resting-State fMRI Analysis Toolkit (DPARSF, http://resting-fmri.sourceforge.net) on the basis of functions in the Statistical Parametric Mapping (SPM 8). Resting-State fMRI Data Analysis Toolkit (REST) was used for “pipeline” data analysis of resting-state fMRI. First, slice timing and head motion correction were carried out. Three subjects who had >2 mm of translation or >2 degrees of rotation in any direction were excluded, thus finally, 17 cases were effectively included in the study. Second, after head motion correction, the structural image of each subject was coregistered to the functional image using a nonlinear image registration approach.20 The coregistered structural images were segmented using the unified segmentation algorithm. Therefore, fMRI images were spatially normalized to standard Montreal Neurologic Institute (MNI), and the images were resampled at a voxel size of 3×3×3 mm3. Subsequently, spatial smoothing was conducted with a Gaussian kernel of 6 mm full-width at half maximum to remove the linear trend. Temporal band-pass filtering (0.01–0.08 Hz) was used to reduce low-frequency drift, high-frequency respiratory noise, and cardiac noise.
ALFF analysis
Before calculating ALFF, a common practice for resting-state fMRI preprocessing is to regress out head motion parameters and white matter/cerebrospinal fluid (WM/CSF) signals to minimize the physiological noises. The ALFF was calculated by following procedure stated in a previous study.21 The filtered time series was transformed to a frequency spectrum with a fast Fourier transform. Because the frequency spectrum is proportional to the square of the amplitude of frequency of the original time series, the square root of frequency spectrum at each voxel was calculated at each frequency across 0.01–0.08 Hz. The averaged square root was taken as the ALFF. For standardization purposes, the ALFF of each voxel was normalized to the global mean ALFF (mALFF) value. Comparison of mALFF values was performed with a two-sample Student’s t-test to detect regional SNA in the whole brain.
FC analysis
FC was calculated with the procedure in accordance with a previous study.22 We regressed out 9 additional covariates that modeled nuisance signals sampled from white matter, cerebrospinal fluid, whole brain signal, as well as from 4 motion parameters (2 rotation and 2 translation as saved by the 3D motion correction) to reduce the effects of physiological processes such as fluctuations related to cardiac and respiratory cycles or to motion.23 For each of the posterior middle temporal gyrus (PMTG) regions of interest (ROIs), a seed reference time course was obtained by averaging the time series of all voxels in the ROI. Pearson correlation analysis was then performed between the seed reference time course and time series of each voxel in the brain. Fisher’s method was used to transform the resultant correlation coefficients into z-scores to obtain the normal distribution of the data.
Statistical analysis
ALFF was compared between 17 aphasic patients and 20 normal healthy subjects using two-sample Student’s t-test. P-value <0.001 (AlphaSim corrected) and cluster size >27 voxels produced the false discovery rate <0.05 and were considered to be significantly different for ALFF values between the two groups.24 Linear Pearson correlation analysis was performed between AQ of aphasic patients and left PMTG, left medial prefrontal gyrus (MPFG) and right cerebellum. Left PMTG was selected as a seed point. One-sample Student’s t-test was conducted to compare the FC of left PMTG and other brain regions. P-value <0.001 (uncorrected) and cluster size >40 voxels were considered to be statistically significant between left PMTG and other brain regions.
Selection of ROI
The left PMTG showed decreased ALFF in the aphasia group and was selected as a seed point. The coordinates of the seed point were xyz = (−60 −62 0) mm, and the volume of the ROI covered 73 voxels. The ROI was generated by the REST slice viewer (Figure 1).
 | Figure 1 Selection of ROIs. Location of seeds (intersecting red lines) and ROIs (red cubes) were used to represent the left PMTG on three orthogonal views of the human brain. The images were displayed in radiological display convention (right is left). |
Results
Clinical characteristics of the participants
Aphasic patients and healthy controls were age and gender matched. The average age was 64±5.9 years for the aphasic group and 60±3.1 years for the controls. No significant differences were observed in age and gender (P>0.1). The average duration of aphasia was 6.9±0.8 months (range: 6–9 months) (Table 1). The excessive motion was defined as >2 mm of translation or >2 degrees of rotation in any direction, and all excessive motion data in subjects were excluded. The WAB results of 17 chronic aphasic patients were shown in Table 1. The average AQ score for the aphasic patients was 66.6±14.5. Out of 17 aphasic patients, 6 had expressive aphasia, also called Broca’s aphasia. The main clinical symptom for these expressive aphasias was inability of speaking fluently. Four patients had anomic aphasia with the main clinical feature of word retrieval failures, mainly spontaneous naming disorder. Two patients had receptive aphasia and 1 had global aphasia. In addition, the subtypes of 4 aphasic patients were not clear. The site and size of the lesions were also listed in Table 1.
ALFF values in aphasic patients
Compared with the normal control subjects, aphasic patients showed decreased ALFF in left PMTG, left MPFG, and right cerebellum. In contrast, the increased ALFF was observed in the left occipital lobe, precentral gyrus, insula, and right precuneus (P<0.001, AlphaSim corrected, cluster size >27 voxels) (Figure 2).
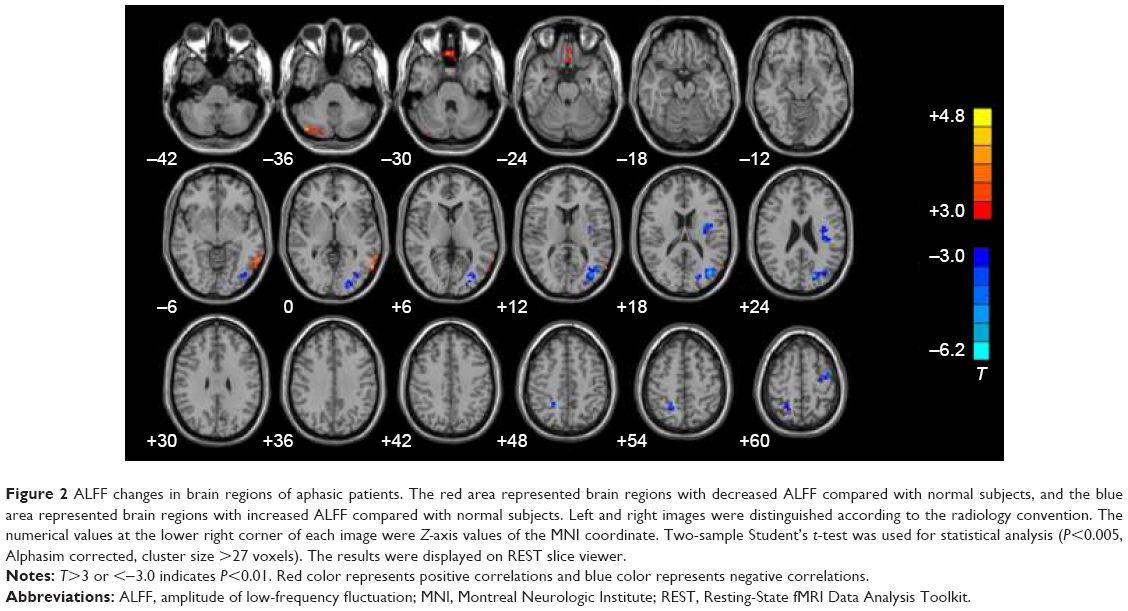 | Figure 2 ALFF changes in brain regions of aphasic patients. The red area represented brain regions with decreased ALFF compared with normal subjects, and the blue area represented brain regions with increased ALFF compared with normal subjects. Left and right images were distinguished according to the radiology convention. The numerical values at the lower right corner of each image were Z-axis values of the MNI coordinate. Two-sample Student’s t-test was used for statistical analysis (P<0.005, Alphasim corrected, cluster size >27 voxels). The results were displayed on REST slice viewer. |
Then, we compared the ALFF values between expressive aphasia and anomic aphasia in left PMTG, left MPFG, and right cerebellum. No significant difference of ALFF was found in the examined brain regions between expressive and anomic aphasia.
Correlation analysis
Pearson correlation analysis was performed between AQ and ALFF values of regions with decreased ALFF in aphasic patients. Positive correlations were observed between AQ and ALFF values, with correlation coefficients of 0.7938 (left PMTG), 0.5384 (left MPFG), and 0.2934 (right cerebellum), respectively. All P-values were <0.05. Among all the examined brain regions, the left PMTG showed the largest positive correlation between ALFF values and AQ (Figure 3A–C). No significant correlations were obtained between aphasia severity and ALFF in the left occipital lobe, precentral gyrus, insula, and right precuneus (all P-values >0.1).
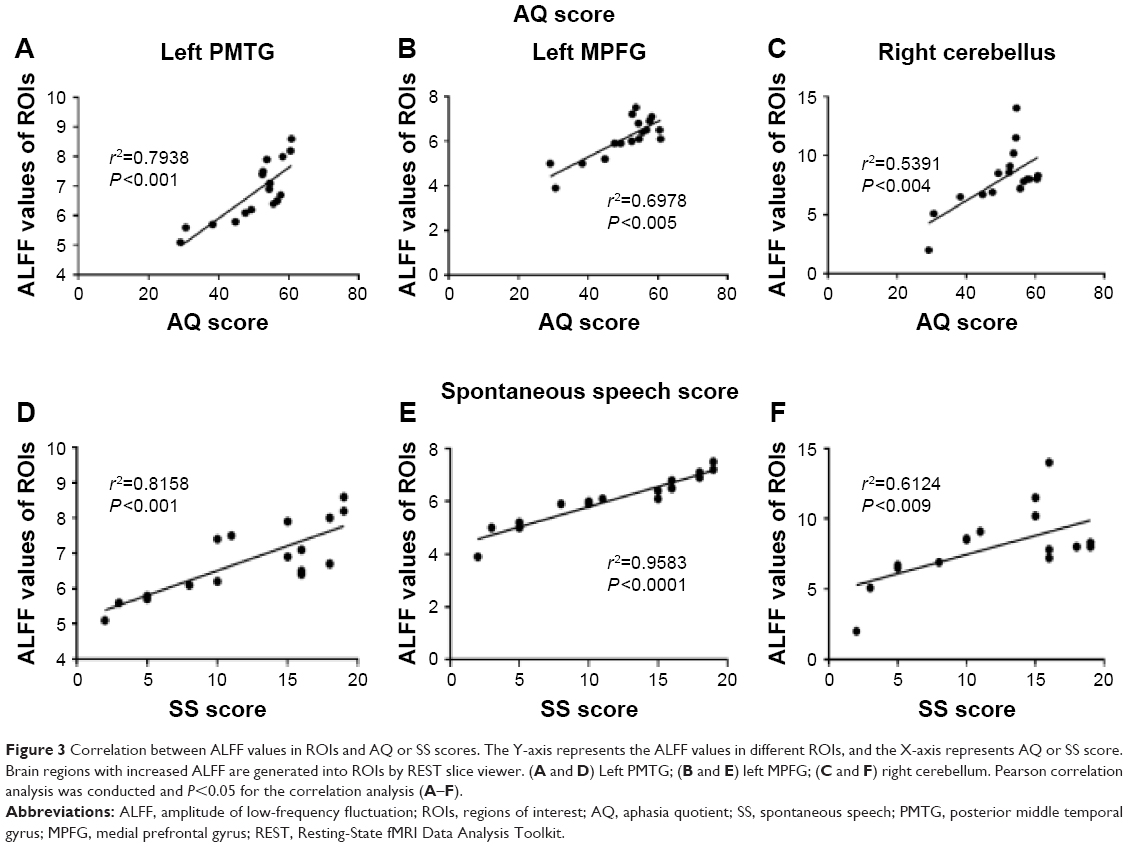 | Figure 3 Correlation between ALFF values in ROIs and AQ or SS scores. The Y-axis represents the ALFF values in different ROIs, and the X-axis represents AQ or SS score. Brain regions with increased ALFF are generated into ROIs by REST slice viewer. (A and D) Left PMTG; (B and E) left MPFG; (C and F) right cerebellum. Pearson correlation analysis was conducted and P<0.05 for the correlation analysis (A–F). |
In terms of the subscores of AQ, a significant positive correlation was also observed between ALFF values and SS scores in left PMTG (r2=0.8158, P<0.001), left MPFG (r2=0.9583, P<0.001), and right cerebellum (r2=0.6124, P<0.009) (Figure 3D–F). We found no other significant correlations between the ALFF values in other brain ROIs and clinical characteristics including AC, repetition score, and naming score.
FC with left PMTG-ROI in normal controls and chronic aphasic patients
In normal controls, positive FC with the left PMTG-ROI was observed in the left inferior temporal gyrus (BA21), fusiform gyrus (BA37), inferior frontal gyrus (BA47\45\44), suprarginal gyrus (BA39), right middle temporal gyrus (BA20), orbital frontal gyrus (BA47), and Zmiddle frontal gyrus (BA46) (P<0.001, uncorrected, cluster size >40 voxels) (Figure 4).
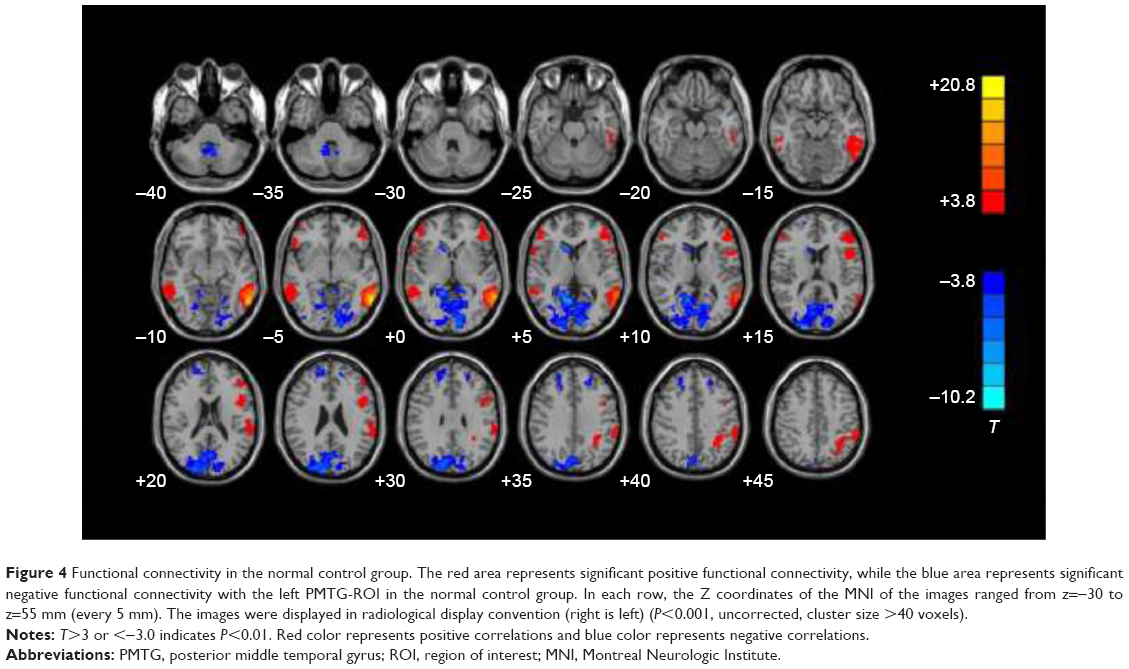 | Figure 4 Functional connectivity in the normal control group. The red area represents significant positive functional connectivity, while the blue area represents significant negative functional connectivity with the left PMTG-ROI in the normal control group. In each row, the Z coordinates of the MNI of the images ranged from z=−30 to z=55 mm (every 5 mm). The images were displayed in radiological display convention (right is left) (P<0.001, uncorrected, cluster size >40 voxels). |
Negative FC with left PMTG-ROI was observed in the bilateral superior frontal gyrus (BA9), occipital lobe (BA17\18\19), right head of the caudate nucleus, and cerebellum tonsil (P<0.001, uncorrected, cluster size >40 voxels) (Figure 4).
Discussion
Aphasia is a language dysfunction caused by brain lesions. Variation in causes, lesion location, and disease process results in different clinical manifestations, and thus, patients exhibit different subtypes of aphasia. The precise connections between brain regions and symptom classification are not available. Therefore, currently, there are no exact classification criteria for aphasia, and almost half of the aphasic patients cannot be classified as the subtypes of aphasia. In this study, we explored the mechanism of language dysfunction of aphasia in 17 patients with different aphasia subtypes and 20 normal subjects by resting-state fMRI using ALFF as an index. We found that the brain regions showing decreased ALFF in aphasic patients were mainly distributed in the left PMTG, left MPFG, and right cerebellum. Then, we extracted ALFF values of the brain regions by using REST software and found that these ALFF values were positively correlated with the AQ of aphasic patients. We selected the left PMTG, which showed highest ALFF value, as a seed point for functional connection analysis. Positive FC in a network included the left inferior temporal gyrus (BA21), fusiform gyrus (BA37), inferior frontal gyrus (BA47\45\44), suprarginal gyrus (BA39), right middle temporal gyrus (BA20), orbital frontal gyrus (BA47), and middle frontal gyrus (BA46).
In this study, the left PMTG, left MPFG, and right cerebellum showed decreased ALFF in aphasic patients. Lesions affecting the left PMTG and underlying white matter could produce severe comprehension deficits.25 Turken et al applied diffusion tensor imaging and resting-state FC and found extensive structural connectivity and FC between left PMTG and multiple brain areas involved in language function.26 The MPFG is often referred to a part of the default network.6 Binder et al in a meta-analysis found that the MPFG participates in semantic processing.27 Marien reported a case of right cerebellum infarction with cognitive and language disorders.28 Therefore, these three brain regions are all involved in language function. When these brain regions are impaired, patients may exhibit language disorder. Therefore, the decreased ALFF of these brain regions might indicate abnormal hemodynamics which results in the occurrence of aphasia. Interestingly, there was no significant difference of ALFF between expressive aphasia and anomic aphasia. This might be due to the overlap of clinical features and causes in our study. All the patients enrolled in this study had the damage of single cerebrovascular accident involving the left cerebral hemisphere.
The regions showing increased ALFF covered left occipital lobe, precentral gyrus, insula, and right precuneus. The occipital lobe is involved in visual functions, and aphasic patients might compensate for a lack of comprehension by enhancing visual stimulation to increase their understanding of input. The occipital lobe can function the language processing networks in congenitally blind patients.29 The precentral gyrus, a motor function area, could be activated when aphasic patients are requested to produce oral expressions. They might use gestures or body movements to express their intent. Therefore, compared with normal subjects, increased SNA and ALFF in the visual cortex and motor cortex of aphasic patients may compensate for the impaired language function. The insular cortex belongs to the part of the limbic system, and its damage may result in the language disorder. Lemieux et al reported that the insular cortex stroke patients showed transient and frequent clinical manifestations, including non-fluent aphasia, anomia, and phonemic paraphasia, combined with mild comprehension and poor repetition.30 Recently, Whitney et al found that the connections between the right precuneus and bilateral posterior and middle cingulate gyrus might play an important role in language comprehension.31 In short, the increased ALFF signal in the left occipital lobe, precentral gyrus, insula, and right precuneus in aphasic patients suggests that these areas have roles in the functional reorganization or compensatory effect in the recovery of language function.
Our study showed that AQ of aphasic patients was positively correlated with ALFF value of the left PMTG, left anterior medial frontal gyrus, and right cerebellum. Thus, in the same brain regions, lower ALFF signal indicates lower AQ and higher degree of aphasia. Since ALFF directly reflects the extent of regional brain SNA, the decreased SNA might be associated with the language dysfunctions of aphasic patients. The intrinsic SNA of these brain regions could influence extrinsic language performance. Since left PMTG showed the highest correlation between ALFF and AQ, we then proposed that SNA of left PMTG might exert large influence on language function supported by previous studies that damaged left PMTG could lead to severe and persistent language comprehension disorder.25,26
In this study, we found that the SNA level of the left PMTG decreased in the aphasic patients and showed a positive correlation with AQ. Anatomically, the left PMTG lies at the junction of the auditory and visual cortex and accepts information from the Wernicke’s area (post superior temporal gyrus), the primary auditory cortex (transverse gyrus), and the visual cortex. Previous studies have shown that the left PMTG involved in the comprehension of lexical and vocabulary25 and has structural and functional connections with many brain areas involved in language function.26 Therefore, we selected the left PMTG other than MPFG or right cerebellum as a seed point to explore the normal language network.
Our study also showed a positive FC between the left PMTG and the left middle temporal gyrus (BA21), inferior temporal gyrus (BA20), fusiform gyrus (BA37), the inferior frontal gyrus (BA47\45\44), supramarginal gyrus (BA39), right middle temporal gyrus (BA21), right orbital frontal gyrus (BA47), and the right middle frontal gyrus (BA46). Compared to the healthy controls, our study showed that late-stage patients significantly decreased connections between left PMTG and right middle temporal gyrus networks, which was not discovered in the early stage of aphasia after stroke. The decrease is likely due to the loss of FC between the nodes. In addition, this might reflect the progression of aphasia after stroke and decreased functional activity occurs gradually not only in the regions with brain lesions but also in the associated regions in the right hemisphere. This might be the consequence of neuroplasticity, which the brain activity can be transferred to a different location.32
Electrical stimulation to the left fusiform gyrus (BA37) will produce different symptoms of aphasia.29 Price reviewed language processing and found that meaningful speech will lead to activation of medial and inferior temporal gyrus.30 The inferior frontal gyrus is involved in the semantic processing of sentences. BA44 will be kept in continual activation when the sentence becomes harder to understand, such as ambiguous sentences,31 abstract sentence,33 and sentence involving grammar.34,35 BA45 will be activated in word retrieval.36 BA47 will be activated upon syntactic and semantic processing.37 It is well known that damage to the supramarginal gyrus and its subcortical fiber bundle will lead to conduction aphasia. Supramarginal gyrus has been reported to involve working memory related to phonemes,38 and this can explain why conduction aphasia exhibits phonemic paraphasia.
Van Ettinger-Veenstra et al found that performance in both reading and high-level language tests was positively correlated with the increased right-hemispheric activation in the inferior frontal gyrus (specifically BA47), the dorsolateral prefrontal cortex, and the medial temporal gyrus (BA21). This indicates that the right temporal lobe and frontal lobe might play a positive role in the regulation of language.39 Rhythm change might produce various semantics in Chinese speakers. Various studies have confirmed that rhythm exhibits right lateralization.40 Moreover, Ethofer et al found that the right middle temporal and the right inferior frontal gyrus are involved in emotional prosody sequences.41
In summary, the decreased ALFF values were found in left PMTG, left MPFG, and right cerebellum of the chronic aphasic patients. ALFF values in these brain regions were positively correlated with the severity of aphasia as indicated by AQ scores. Compared with other examined brain regions, ALFF value of the left PMTG has the largest correlation with AQ scores. We speculate that the left PMTG might play an important role in language dysfunction of aphasia. The decreased ALFF value of left PMTG neurons could be used as a novel biomarker to evaluate the severity of aphasia, thereby evaluating the prognosis and deterioration of aphasic patients.
Acknowledgment
This work was partially supported by National Science Foundation of China (grant no 81628008).
Disclosure
The authors report no conflicts of interest in this work.
References
Yourganov G, Smith KG, Fridriksson J, Rorden C. Predicting aphasia type from brain damage measured with structural MRI. Cortex. 2015;73:203–215. | ||
John AA, Javali M, Mahale R, Mehta A, Acharya PT, Srinivasa R. Clinical impression and Western Aphasia Battery classification of aphasia in acute ischemic stroke: is there a discrepancy? J Neurosci Rural Pract. 2017;8:74–78. | ||
Kertesz A, Poole E. The aphasia quotient: the taxonomic approach to measurement of aphasic disability. Can J Neurol Sci. 2004;31:175–184. | ||
Biswal B, Yetkin FZ, Haughton VM, et al. Functional connectivity in the motor cortex of resting human brain using echo-planar MRI. Magn Reson Med. 1995;34:537–541. | ||
Deng Z, Chandrasekaran B, Wang S, Wong PC. Resting-state low-frequency fluctuations reflect individual differences in spoken language learning. Cortex. 2016;76:63–78. | ||
Greicius MD, Krasnow B, Reiss AL, et al. Functional connectivity in the resting brain: a network analysis of the default mode hypothesis. Proc Natl Acad Sci U S A. 2003;100:253–258. | ||
Xu J, Yin X, Ge H, et al. Attentional performance is correlated with the local regional efficiency of intrinsic brain networks. Front Behav Neurosci. 2015;9:200. | ||
Fox MD, Corbetta M, Snyder AZ, et al. Spontaneous neuronal activity distinguishes human dorsal and ventral attention systems. Proc Natl Acad Sci U S A. 2006;103:10046–10051. | ||
Greicius MD, Srivastava G, Reiss AL, et al. Default-mode network activity distinguishes Alzheimer’s disease from healthy aging: evidence from functional MRI. Proc Natl Acad Sci U S A. 2004;101:4637–4642. | ||
Sorg C, Riedl V, Muhlau M, et al. Selective changes of resting-state networks in individuals at risk for Alzheimer’s disease. Proc Natl Acad Sci U S A. 2007;104:18760–18765. | ||
Gilaie-Dotan S, Hahamy-Dubossarsky A, Nir Y, Berkovich-Ohana A, Bentin S, Malach R. Resting state functional connectivity reflects abnormal task-activated patterns in a developmental object agnosic. Neuroimage. 2013;70:189–198. | ||
Zhu D, Chang J, Freeman S, et al. Changes of functional connectivity in the left frontoparietal network following aphasic stroke. Front Behav Neurosci. 2014;8:167. | ||
Balaev V, Petrushevsky A, Martynova O. Changes in functional connectivity of default mode network with auditory and right frontoparietal networks in poststroke aphasia. Brain Connect. 2016;6:714–723. | ||
Sandberg CW. Hypoconnectivity of resting-state networks in persons with aphasia compared with healthy age-matched adults. Front Hum Neurosci. 2017;11:91. | ||
Zang YF, He Y, Zhu CZ, et al. Altered baseline brain activity in children with ADHD revealed by resting-state functional MRI. Brain Dev. 2007;29:83–91. | ||
Yang H, Long XY, Yang Y, et al. Amplitude of low frequency fluctuation within visual areas revealed by resting-state functional MRI. Neuroimage. 2007;36:144–152. | ||
Han Y, Wang J, Zhao Z, et al. Frequency-dependent changes in the amplitude of low-frequency fluctuations in amnestic mild cognitive impairment: a resting-state fMRI study. Neuroimage. 2011;55:287–295. | ||
Zhang Z, Lu G, Zhong Y, et al. fMRI study of mesial temporal lobe epilepsy using amplitude of low-frequency fluctuation analysis. Hum Brain Mapp. 2010;31:1851–1861. | ||
Yang M, Li J, Li Y, et al. Altered intrinsic regional activity and interregional functional connectivity in post-stroke aphasia. Sci Rep. 2016;6:24803. | ||
Harston GW, Minks D, Sheerin F, et al. Optimizing image registration and infarct definition in stroke research. Ann Clin Transl Neurol. 2017;4:166–174. | ||
Zhang Z, Lu G, Zhong Y, et al. Altered regional synchronization in epileptic patients with generalized tonic-clonic seizures. Epilepsy Res. 2011;97(1–2):83–91. | ||
Cao X, Cao Q, Long X, et al. Abnormal resting-state functional connectivity patterns of the putamen in medication-naive children with attention deficit hyperactivity disorder. Brain Res. 2009;1303:195–206. | ||
Torta DM, Costa T, Luda E, et al. Nucleus accumbens functional connectivity discriminates medication-overuse headache. Neuroimage Clin. 2016;11:686–693. | ||
Liberman MD, Cunningham WA. Type I and II error concerns in fMRI research: rebalancing the scale. Soc Cogn Affect Neurosci. 2009;4:423–428. | ||
Dronkers NF, Wilkins DP, Van Valin RJ, et al. Lesion analysis of the brain areas involved in language comprehension. Cognition. 2004;92:145–177. | ||
Turken AU, Dronkers NF. The neural architecture of the language comprehension network: converging evidence from lesion and connectivity analyses. Front Syst Neurosci. 2011;5:1. | ||
Binder JR, Desai RH, Graves WW, et al. Where is the semantic system? A critical review and meta-analysis of 120 functional neuroimaging studies. Cereb Cortex. 2009;19:2767–2796. | ||
Marien P, Baillieux H, De Smet HJ, et al. Cognitive, linguistic and affective disturbances following a right superior cerebellar artery infarction: a case study. Cortex. 2009;45:527–536. | ||
Luders H, Lesser RP, Hahn J, et al. Basal temporal language area demonstrated by electrical stimulation. Neurology. 1986;36:505–510. | ||
Lemieux F, Lanthier S, Chevrier MC, et al. Insular Ischemic Stroke: Clinical Presentation and Outcome. Cerebrovasc Dis Extra. 2012;2: 80–87. | ||
Whitney C, Huber W, Klann J, et al. Neural correlates of narrative shifts during auditory story comprehension. Neuroimage. 2009;47:360–366. | ||
Shah PP, Szaflarski JP, Allendorfer J, Hamilton RH. Induction of neuroplasticity and recovery in post-stroke aphasia by non-invasive brain stimulation. Front Hum Neurosci. 2013;7:888. | ||
Desai RH, Binder JR, Conant LL, et al. Activation of sensory-motor areas in sentence comprehension. Cereb Cortex. 2010;20:468–478. | ||
Friederici AD, Kotz SA, Scott SK, et al. Disentangling syntax and intelligibility in auditory language comprehension. Hum Brain Mapp. 2010;31:448–457. | ||
Newman SD, Lee D, Ratliff KL. Off-line sentence processing: what is involved in answering a comprehension probe? Hum Brain Mapp. 2009;30:2499–2511. | ||
Jeon HA, Lee KM, Kim YB, et al. Neural substrates of semantic relationships: common and distinct left-frontal activities for generation of synonyms vs. antonyms. Neuroimage. 2009;48:449–457. | ||
Schafer RJ, Constable T. Modulation of functional connectivity with the syntactic and semantic demands of a noun phrase formation task: a possible role for the default network. Neuroimage. 2009;46:882–890. | ||
Woodward TS, Cairo TA, Ruff CC, et al. Functional connectivity reveals load dependent neural systems underlying encoding and maintenance in verbal working memory. Neuroscience. 2006;139:317–325. | ||
Van Ettinger-Veenstra H, Ragnehed M, McAllister A, et al. Right-hemispheric cortical contributions to language ability in healthy adults. Brain Lang. 2012;120:395–400. | ||
Wildgruber D, Riecker A, Hertrich I, et al. Identification of emotional intonation evaluated by fMRI. Neuroimage. 2005;24:1233–1241. | ||
Ethofer T, Anders S, Erb M, et al. Cerebral pathways in processing of affective prosody: a dynamic causal modeling study. Neuroimage. 2006;30:580–587. |
 © 2017 The Author(s). This work is published and licensed by Dove Medical Press Limited. The
full terms of this license are available at https://www.dovepress.com/terms
and incorporate the Creative Commons Attribution
- Non Commercial (unported, 3.0) License.
By accessing the work you hereby accept the Terms. Non-commercial uses of the work are permitted
without any further permission from Dove Medical Press Limited, provided the work is properly
attributed. For permission for commercial use of this work, please see paragraphs 4.2 and 5 of our Terms.
© 2017 The Author(s). This work is published and licensed by Dove Medical Press Limited. The
full terms of this license are available at https://www.dovepress.com/terms
and incorporate the Creative Commons Attribution
- Non Commercial (unported, 3.0) License.
By accessing the work you hereby accept the Terms. Non-commercial uses of the work are permitted
without any further permission from Dove Medical Press Limited, provided the work is properly
attributed. For permission for commercial use of this work, please see paragraphs 4.2 and 5 of our Terms.