Back to Journals » Diabetes, Metabolic Syndrome and Obesity » Volume 14
The Profile and Function of Gut Microbiota in Diabetic Nephropathy
Authors Chen W, Zhang M ![]() , Guo Y, Wang Z, Liu Q, Yan R, Wang Y, Wu Q, Yuan K, Sun W
, Guo Y, Wang Z, Liu Q, Yan R, Wang Y, Wu Q, Yuan K, Sun W
Received 18 May 2021
Accepted for publication 13 August 2021
Published 19 October 2021 Volume 2021:14 Pages 4283—4296
DOI https://doi.org/10.2147/DMSO.S320169
Checked for plagiarism Yes
Review by Single anonymous peer review
Peer reviewer comments 2
Editor who approved publication: Prof. Dr. Juei-Tang Cheng
Weihong Chen,1 Mengjiu Zhang,1 Yan Guo,1 Zhen Wang,1 Qingqing Liu,1 Runze Yan,1 Yi Wang,1 Qiaoru Wu,1 Kai Yuan,2 Weiwei Sun1
1Department of Nephrology, Dongzhimen Hospital, Beijing University of Chinese Medicine, Beijing, 100700, People’s Republic of China; 2School of Life Sciences, Beijing University of Chinese Medicine, Beijing, 100029, People’s Republic of China
Correspondence: Kai Yuan; Weiwei Sun Email [email protected]; [email protected]
Introduction: Dysbiosis of gut microbiota impairs the homeostasis of immune and metabolic systems. Although previous studies have revealed the correlation between gut microbiota and various diseases, the function between gut microbiota and diabetic nephropathy (DN) has not been discovered distinctly. In this study, we tried to investigate the profile and function of gut microbiota in DN.
Methods: A total of 100 people were enrolled in this study. Twenty were healthy people, 20 were diabetes patients, and 60 were DN patients. The DN patients were divided into three stages including stage III, IV, and V. We conducted taxonomic analyses in different groups. The distributions of phyla, classes, orders, families, and genera in different groups and samples were investigated. We also evaluated the correlations between clinical parameters and gut microbiota in 60 DN patients.
Results: The gut microbiota in the healthy group, diabetes group, and DN group had 1764 operational taxonomic units (OTUs) in total. The healthy group had 1034 OTUs, the diabetes group had 899 OTUs, and the DN group had 1602 OTUs. The diversity of gut microbiota in the stage III DN group was smaller than that in the other groups. 24-h urinary protein was positively correlated with Alistipes and Subdoligranulum, cholesterol was positively correlated with Bacteroides and Lachnoclostridium, and estimated glomerular filtration rate was negatively correlated with Ruminococcus torques group.
Discussion: The gut microbiota might play an important role in the development and pathogenesis of DN. A change in gut microbiota diversity is correlated with disease progression. Some kinds of gut microbiota including Alistipes, Bacteroides, Subdoligranulum, Lachnoclostridium, and Ruminococcus torques group might be detrimental factors in DN.
Keywords: diabetic nephropathy, gut microbiota, genus, progression
Introduction
Diabetic nephropathy (DN) is characterized by kidney function loss caused by diabetes mellitus.1 Almost one-third of patients with diabetes have DN, and the prevalence of DN is increasing worldwide.2 DN is one of the most important factors of chronic kidney disease and end-stage renal disease (ESRD). The signs and symptoms of DN include nocturia, proteinuria, fatigue, vomiting, nausea, appetite loss, and leg swelling.3 The risk factors for DN include uncontrolled high blood pressure, uncontrolled blood glucose, cigarette use, and family history.4 There are 5 (stages I to V) stages of DN depending on the glomerular filtration rate (GFR) and albuminuria. The progression of DN involves hyperfiltration, microalbuminuria, macroalbuminuria, nephrotic proteinuria, and ESRD. The final complication of DN is renal fibrosis with multiple mechanisms, such as oxidative stress, inflammatory processes, and glucose abnormalities. Haemodynamic and metabolic factors are two main factors in the pathophysiology of DN.5 Regarding haemodynamic factors, the renin-angiotensin-aldosterone system (RAAS) is overactivated, and intraglomerular pressure is increased. Regarding metabolic factors, advanced glycation end products are formed, leading to cardiovascular complications. The treatments for DN include blood pressure control, RAAS inhibition, glycaemic control, and cardiovascular risk reduction.6 Because the pathogenesis of DN has not been investigated clearly, the management of DN is not currently specific.
Gut microbiota are microorganisms such as archaea and bacteria living in the digestive tract.7 Compared with other areas, the gut microbiota has the largest abundance of species and numbers of bacteria in the body, and almost 60% of the dry mass of faeces is bacteria. The composition of the gut microbiota is different depending on age, diet, and geography.8 There have 4 dominant phyla of bacteria including Proteobacteria, Firmicutes, Actinobacteria, and Bacteroidetes in upper gastrointestinal tract.9 The genera of gut bacteria include Peptostreptococcus, Eubacterium, Faecalibacterium prausnitzii, and Clostridium. The correlation between gut microbiota with disease is very complicated. Some types of gut microbiota are beneficial, while other types of gut microbiota are harmful to humans. Regarding the beneficial aspects, gut microbiota can defend against pathogens, metabolize indigestible compounds, and maintain immune homeostasis.10 Apart from the beneficial aspects, the gut microbiota is also correlated with various diseases, such as obesity, colon cancer, and inflammatory bowel disease, diabetes and DN.11,12 In diabetes patients, butyrate-producing bacteria including Roseburia intestinalis and Faecalibacterium prausnitzii concentrations were lower compared with healthy population.13 In DN patients, Enterobacteriaceae and Proteobacteriaceae could increase production of pro-inflammatory substances.14 Kikuchi et al found that gut microbiome-derived phenyl sulfate contributes to albuminuria and might be considered as disease marker in DN.15 Li et al explored that gut microbiota including Allobaculum, Anaerosporobacter, and Blautia were involved in modulating renal function in experimental DN murine models.16 Mosterd et al inferred that microbiota structure in DN patients is disrupted and intestinal microbes create large quantities of uremic solutes leading to renal damage.17
Multiple factors are involved in the function of gut microbiota in disease. Dysbiosis of gut microbiota impairs the homeostasis of immune and metabolic systems.18 Faecal microbiota transplantation has been a novel method in the treatment of Clostridioides difficile infection in recent years.19 Although previous studies have revealed the correlation between gut microbiota and various diseases, the connection between gut microbiota and diabetic nephropathy has not been distinctly uncovered.
In this study, we investigated the profile of gut microbiota in healthy people, diabetes patients, and diabetic kidney disease (DN) patients. In addition, we also identified the profile and differentiation of gut microbiota in different stages of DN patients. Furthermore, we revealed the correlation between clinical parameters and gut microbiota in DN patients. We hoped to provide a useful picture of the profile and function of the gut microbiota in DN.
Methods
Patients
A total of 100 people were enrolled in this study. Of the 100 people, 20 were healthy subjects, 20 were diabetes patients, and 60 were diabetic kidney disease (DN) patients. The DN patients were divided into three stages: stage III, stage IV, and stage V. Stage III was Early stage of DN. Stage IV was established stage of DN. Stage V was advanced stage of DN. The numbers of stage III, stage IV, and stage V patients were 13, 35, and 12, respectively. The criteria of DN were as follows: stage III, urinary microalbumin excretion rate (UAER) of 30–300 mg/24 h or urinary albumin-to-creatinine ratio (ACR) of 30–300 mg/g; stage IV, UAER > 300 mg/24 h or ACR > 300 mg/g, or 24-h urinary protein (24-hUP) > 0.5 g; and stage V, eGFR <20 mL/min/1.73 m2. The other clinical parameters of DN patients included age, sex, body mass index (BMI), blood pressure, serum creatinine (Scr), estimated glomerular filtration rate (eGFR), blood urea nitrogen (BUN), uric acid (UA), albumin (ALB), 24-hour urine protein (24-h UTP), C-reactive protein (CRP), serum cholesterol, and triglyceride. Patients who had severe diseases in other systems were excluded. The faecal samples were stored at −80°C before further experiments. All patients signed informed consent prior to participation in the study. This study was approved by the Ethics Committee of Dongzhimen Hospital, Beijing University of Chinese Medicine (No. DZMEC-KY-2016-95). The details about the participants are shown in Table 1.
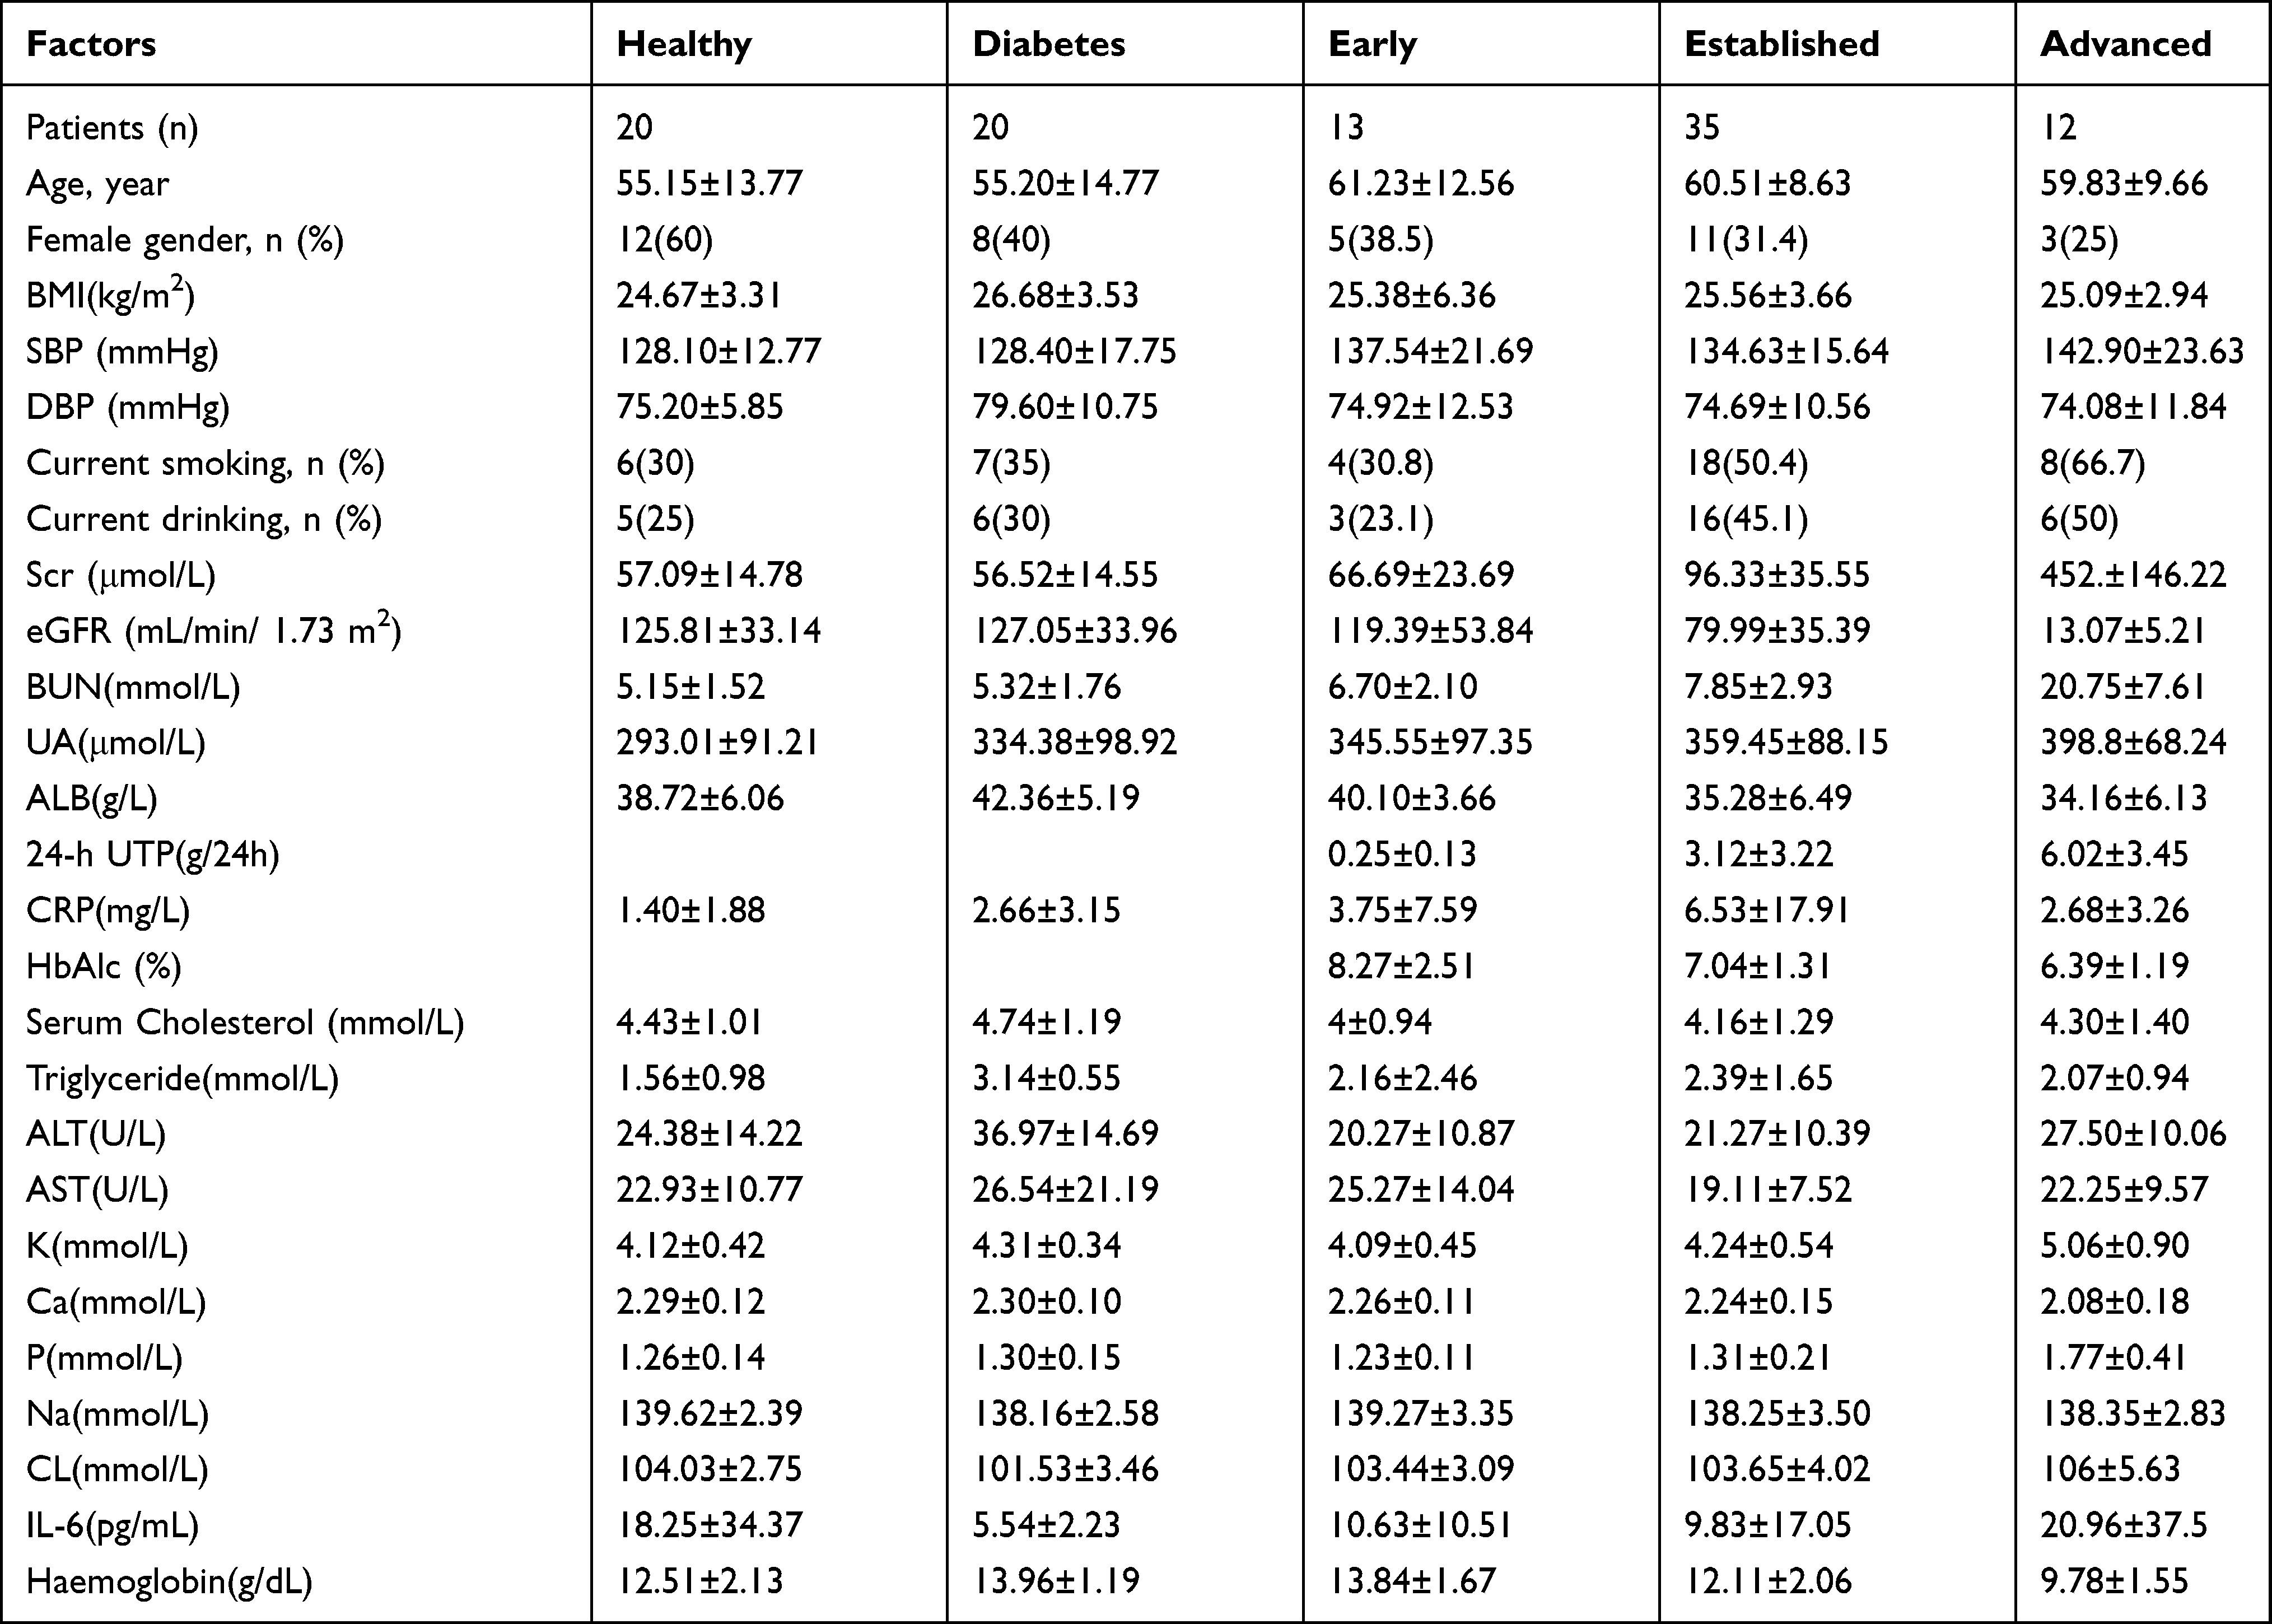 |
Table 1 Baseline Characteristics of Participants |
DNA Extraction and PCR Amplification
The total DNA of the gut microbiota was extracted with a DNA isolation kit according to the manual. The DNA was isolated from PowerSoil®DNA Isolation Kit (12888-50). The PowerSoil® DNA Isolation Kit does not require homogenization using a high velocity bead beater. A NanoDrop spectrophotometer (Thermo Scientific) and 1% agarose gels were used to check the quality and purity of genomic DNA. Then, the bacterial 16S rRNA gene V3-4 hypervariable region was amplified with the following primers: ACTCCTACGGGAGGCAGCAG and GGACTACHVGGGTWTCTAAT. In each sample, a barcode sequence was added to the primers (Allwegene Company, Beijing). The total reaction volumes were 25 μL, including 5 µL of DNA (30 ng of total template quantity), 12.5 μL of 2*Taq plus master mix, 1 µL of forward primer (5 µM), 1 µL of reverse primer (5 µM), and 5.5 µL of ddH2O. The cycling parameters were 94°C for 5 min, followed by 28 cycles of approximately 94°C for 30 s, 55°C for 30 s, and 72°C for 60 s. The final extension was 72°C for 10 min.
High-Throughput Sequencing
We used the MiSeq platform at Allwegene Company to conduct deep sequencing. The Illumina Analysis Pipeline Version 2.6 was used to conduct image analysis, base calling and error estimation.
Data Analysis
Data were presented as mean±standard for continuous variables, and proportions for categorical variables. The analysis of variance (ANOVA) and Chi-squared test were conducted to measure the significance in the current study. Spearman correlation was used to calculate the correlation between clinical parameters and gut microbiota in DN patients. Operational taxonomic units (OTUs) were clustered using Vsearch (v2.7.1) software with a similarity level of 97% for the sequences. Then, rarefaction curves were generated, and the richness was calculated. The Ribosomal Database Project (RDP) Classifier tool was used to classify all sequences into different taxonomic groups against the Silva128 database. PCA and clustering analysis were conducted to explore the similarity between different samples depending on the OTU data with every sample. Bray Curtis algorithms were used to evaluate the evolution distances of microbial communities with the samples. Then, the unweighted pair group method with arithmetic mean (UPGMA) clustering tree was used to reveal the dissimilarity with multiple samples. Furthermore, the Newick formatted tree was constructed by this method. Finally, a heat map was constructed to describe the top 20 OTUs with Mothur so that the structure and relationships could be compared among different samples.
Results
Baseline Characteristics of Patients
In our study, a total of 100 patients were enrolled: 20 were healthy subjects, 20 were diabetes patients, and 60 were diabetic kidney disease (DN) patients. The average age of 20 healthy control (12 females, 8 males) was 55.15±13.77 years. The average age of 20 diabetes patients (8 females, 12 males) was 55.20±14.77 years. The average age of 60 DN patients (19 females, 41 males) was 60.53±9.62 years. In the total 60 DN patients, average age of stage III DN patients (n=13) was 61.23±12.56 years, average age of stage IV DN patients (n=35) was 60.51±8.63 years, average age of stage V DN patients (n=12) was 59.83±9.66 years. The parameters of healthy subjects and diabetes patients included age, BMI, SBP, DBP, Scr, BUN, UA, ALB, 24-h UTP, CRP, and HbA1c. Detailed information on the healthy people and diabetes patients was listed in Table 1. The 60 DN patients were divided into three stages: stage III, stage IV, and stage V. The clinical parameters of DN patients included age, BMI, SBP, DBP, Scr, eGFR, BUN, UA, ALB, 24-h UTP, CRP, serum cholesterol, and triglyceride. The levels of Scr were significantly increased from stage III to stage V (66.69 ± 23.69, 96.33 ± 35.55, and 452 ± 146.22, respectively, P = 0.000). eGFR was significantly decreased from stage III to stage V (119.39 ± 53.84, 79.99 ± 35.39, and 13.07 ± 5.21, P = 0.000). The levels of BUN were significantly increased from stage III to stage V (6.7 ± 2.1, 7.85 ± 2.93, and 20.75 ± 7.61, P = 0.000). ALB was significantly decreased from stage III to stage V (40.1 ± 3.66, 35.28 ± 6.49, and 34.16 ± 6.13, P = 0.025). The 24-h UTP was significantly increased from stage III to stage V (0.25 ± 0.13, 3.12 ± 3.22, and 6.02 ± 3.45, P = 0.000). HbA1c was significantly decreased from stage III to stage V (8.27 ± 2.51, 7.04 ± 1.31, and 6.39 ± 1.19, P = 0.016). The levels of K were significantly increased from stage III to stage V (4.09 ± 0.45, 4.24 ± 0.54, and 5.06 ± 0.9, P = 0.000). The levels of Ca significantly decreased from stage III to stage V (2.26 ± 0.11, 2.24 ± 0.15, and 2.08 ± 0.18, P = 0.004). The levels of P were significantly increased from stage III to stage V (1.23 ± 0.11, 1.31 ± 0.21, and 1.77 ± 0.41, P = 0.000). The levels of haemoglobin decreased from stage III to stage V (13.84 ± 1.67, 12.11 ± 2.06, and 9.78 ± 1.55, P = 0.000).
Gut Microbiota Structure and Alpha Diversity Analysis
A total of 100 patient samples were enrolled to test gut microbiota. The Venn graph results indicated that the gut microbiota in the three groups (healthy subjects, diabetes patients, and DN patients) had 1764 OTUs in total (Figure 1). Among the three groups, the healthy subjects group had 1034 OTUs, the diabetes group had 899 OTUs, and the DN group had 1602 OTUs. The Shannon-Wiener curves tended to be stable, indicating that the samples were enough to reflect the diversity of gut microbiota (Figure 2A). Rank-abundance curves showed the species abundance and species uniformity (Figure 2B). In the horizontal direction, the abundance of species is reflected by the width of the curve; the higher the abundance of the species is, the larger the range of the curve on the horizontal axis. The shape (smoothness) of the curve reflects the uniformity of the species in the sample; the smoother the curve is, the more homogeneous the species distribution.
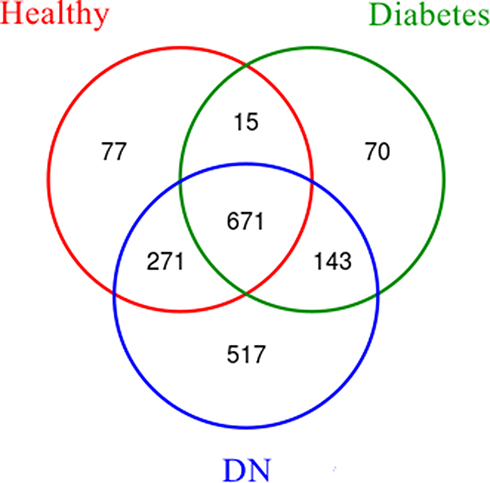 |
Figure 1 Venn diagram of shared OTUs in the healthy subjects group, diabetes group, and DN group. Healthy subjects group had 1034 OUTs. Diabetes group had 899 OUTs. DN group had 1602 OUTs. Healthy subjects group and diabetes group shared 686 OUTs. Healthy subjects group and DN group shared 942 OUTs. Diabetes group and DN group shared 814 OUTs. The three groups shared 671 OUTs. |
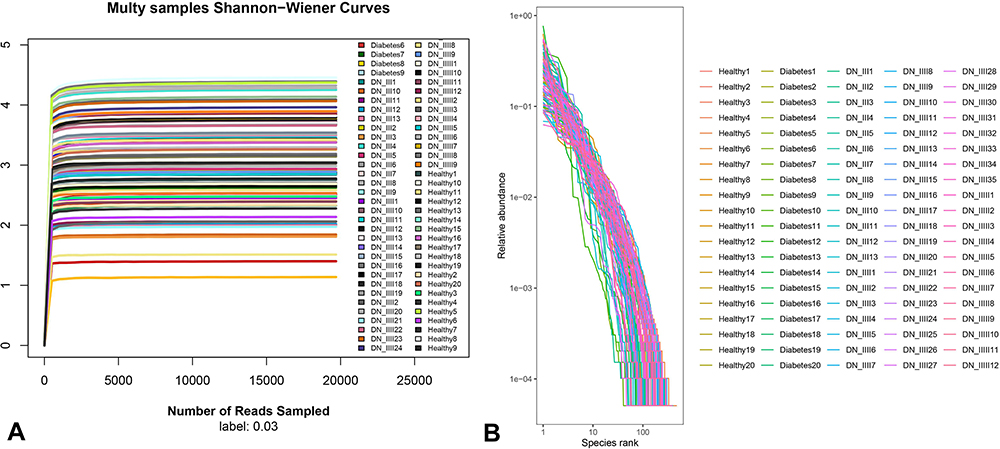 |
Figure 2 Alpha diversity analysis. (A) Shannon-Wiener curves. Shannon-Wiener is an index that reflects the microbial diversity in the group. It reflected the microbial diversity of each sample at different sequencing amounts. When the curve tends to be flat, it indicates that the amount of sequencing data is large enough to reflect most of the microbial information in the group. (B) Rank-abundance curves. The Rank-abundance curve can be used to explain two aspects of diversity, namely species abundance and species evenness. |
Next, we divided the DN group into 3 groups from stage III to stage V. We evaluated the alpha diversity index of the healthy subjects group, diabetes group, stage III DN group, stage IV DN group, and stage V DN group. As shown in Figure 3, the number of species of gut microbiota in the stage III DN patient group was smaller than that in the other groups. Chao1, PD whole tree, and Shannon analyses also showed that the diversity of gut microbiota in the stage III DN group was smaller than that in the other groups in our study. Thus, reduced diversity of gut microbiota might be the symbol of stage III DN. It might be an important indicator in the progression and development of DN.
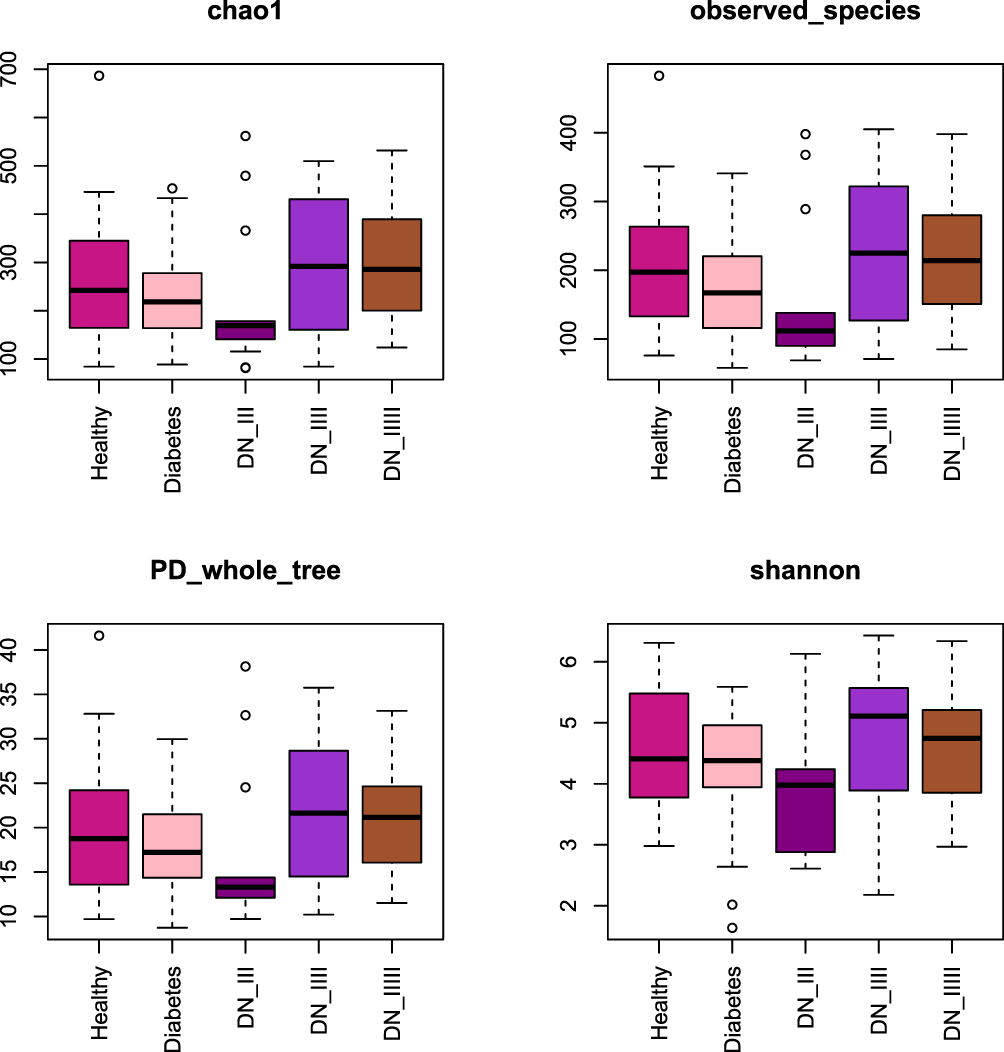 |
Figure 3 Chao1, observed species, PD whole tree, and Shannon analyses of the healthy subjects group, diabetes group, stage III DN group, stage IV DN group, and stage V DN group. Chao1 is the bacterial species richness index used to estimate the number of OTUs in the community. Observed species is the number of OTUs actually observed as the depth of sequencing increases. PD whole tree is a diversity index that takes into account species abundance and evolutionary distance. It is a diversity index calculated based on the phylogenetic tree. Shannon analysis is used to estimate one of the microbial diversity indexes in the group. The larger value of Shannon had the higher community diversity. |
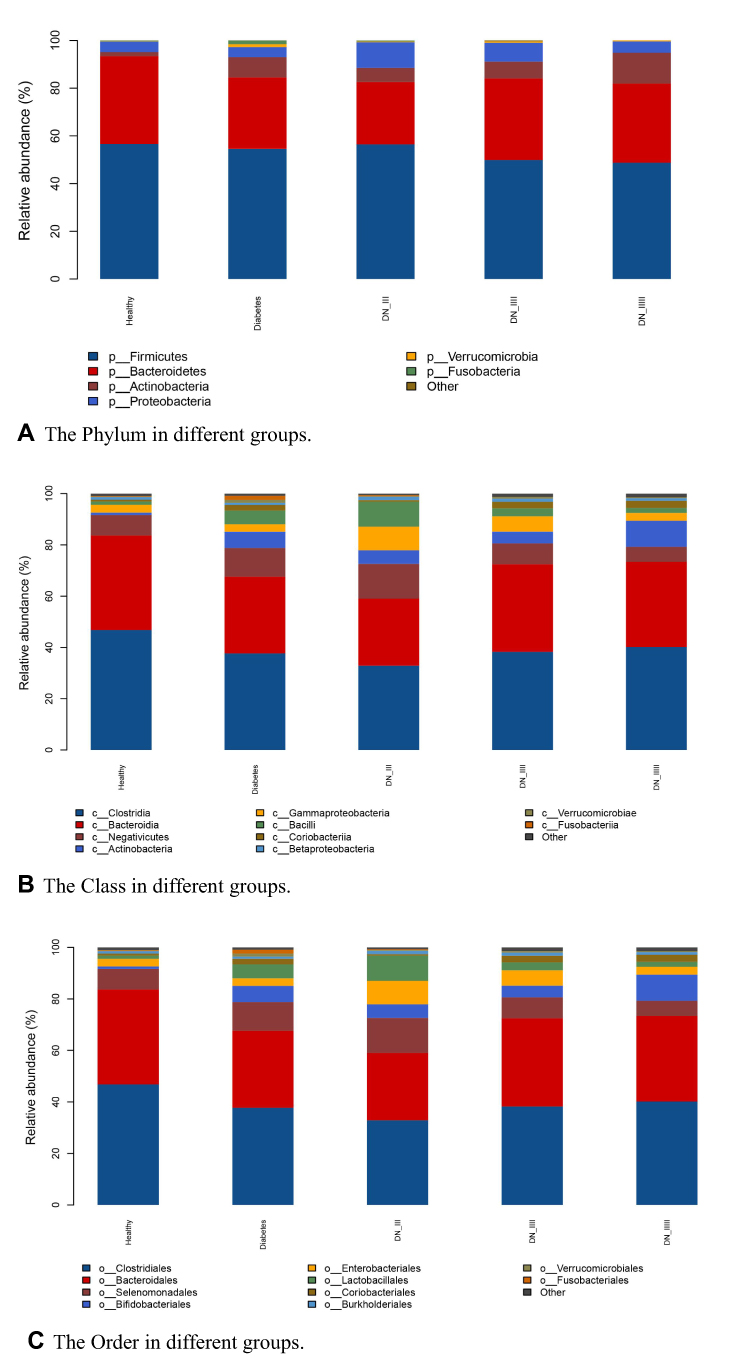 |
Figure 4 Continued. |
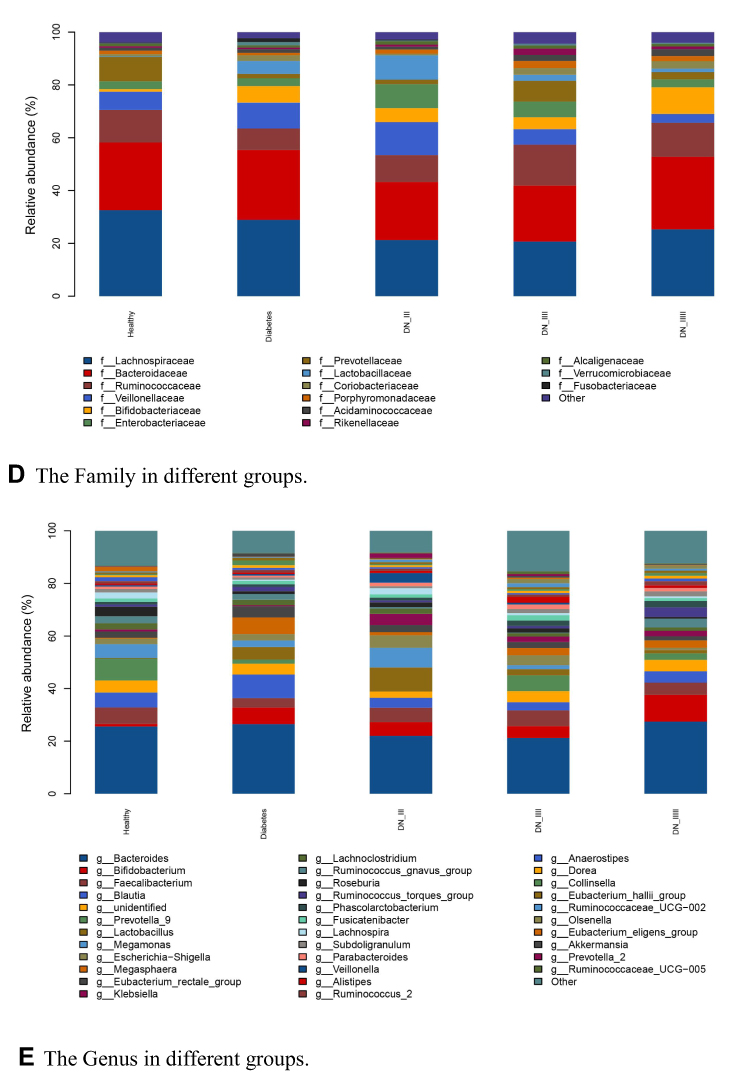 |
Figure 4 Taxonomic analyses in different groups. (A) The phyla in different groups. (B) The classes in different groups. (C) The orders in different groups. (D) The families in different groups. (E) The genera in different groups. The taxonomic comparison of different groups at each classification level were revealed. The information of taxonomic analyses included kinds of microorganisms in the group and the relative abundance of each microorganism. Here we use a histogram to visualize the species composition of different groups. |
Taxonomic Analysis
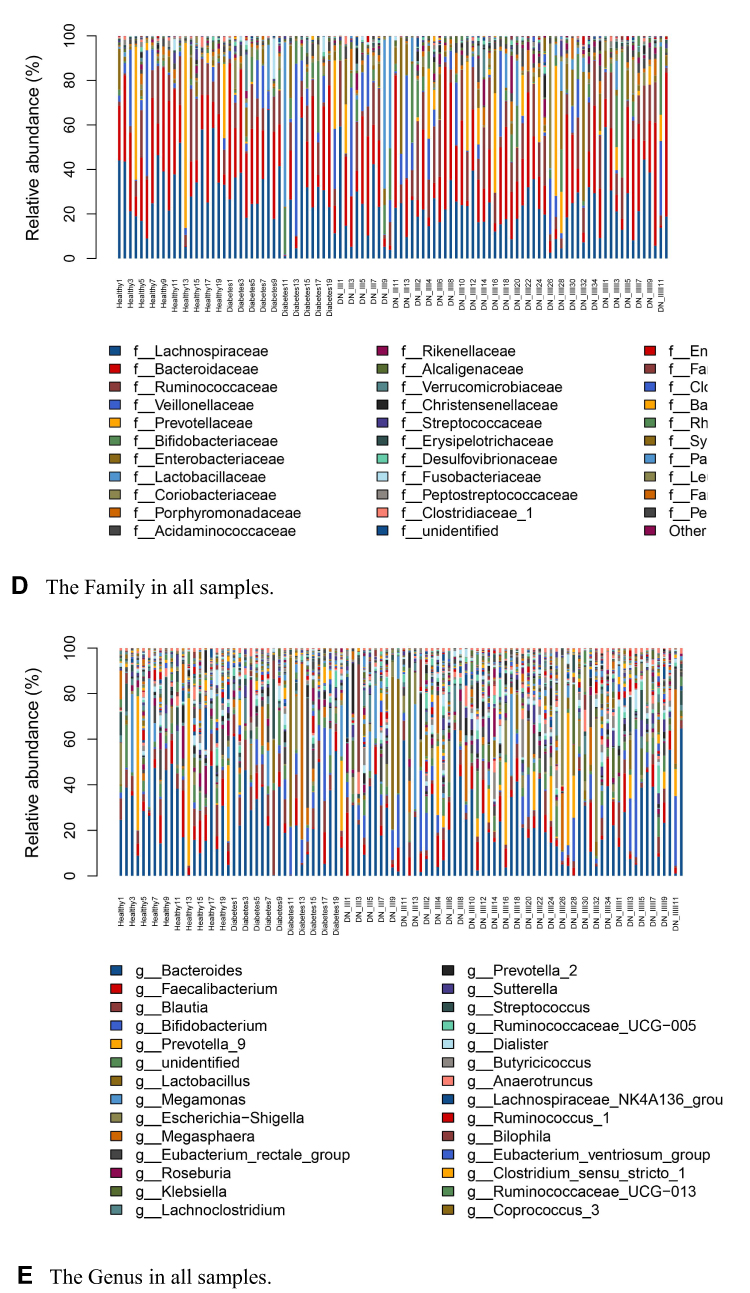
We conducted taxonomic analyses in different groups. The phyla in the different groups included Firmicutes, Bacteroidetes, Actinobacteria, Proteobacteria, Verrucomicrobia, and Fusobacteria (Figure 4). The classes in different groups included Clostridia, Bacteroidia, Negativicutes, Actinobacteria, Gammaproteobacteria, Bacilli, Coriobacteriia, Betaproteobacteria, Verrucomicrobia, and Fusobacteria. The orders in different groups included Clostridiales, Bacteroidales, Selenomonadales, Bifidobacteriales, Enterobacteriales, Lactobacillales, Coriobacteriales, Burkholderiales, Verrucomicrobiales, and Fusobacteriales. The families in different groups included Lachnospiraceae, Bacteroidaceae, Ruminococcaceae, and Veillonellaceae. The genera in different groups included Bacteroides, Bifidobacterium, Faecalibacterium, and Blautia. Furthermore, we conducted taxonomic analysis of the samples. The phyla included Actinobacteria, Proteobacteria, Firmicutes, Bacteroidetes, Verrucomicrobia, and Fusobacteria (Figure 5). The classes included Negativicutes, Actinobacteria, Gammaproteobacteria, Clostridia, Bacilli, and Bacteroidia. The orders included Selenomonadales, Bifidobacteriales, Enterobacteriales, Clostridiales, Lactobacillales, and Bacteroidales. The families in different groups included Lachnospiraceae, Bacteroidaceae, Ruminococcaceae, Veillonellaceae, and Prevotellaceae. The genera in different groups included Bacteroides, Faecalibacterium, Blautia, Bifidobacterium, and Lactobacillus. So, the distribution of phylum, class, order, family, and genus in different groups were investigated with taxonomic analysis. Figure 5 Continued. Figure 5 Taxonomic analyses in all samples. (A) The phyla in all samples. (B) The classes in all samples. (C) The orders in all samples. (D) The families in all samples. (E) The genera in all samples. The taxonomic comparison of all samples at each classification level were discovered.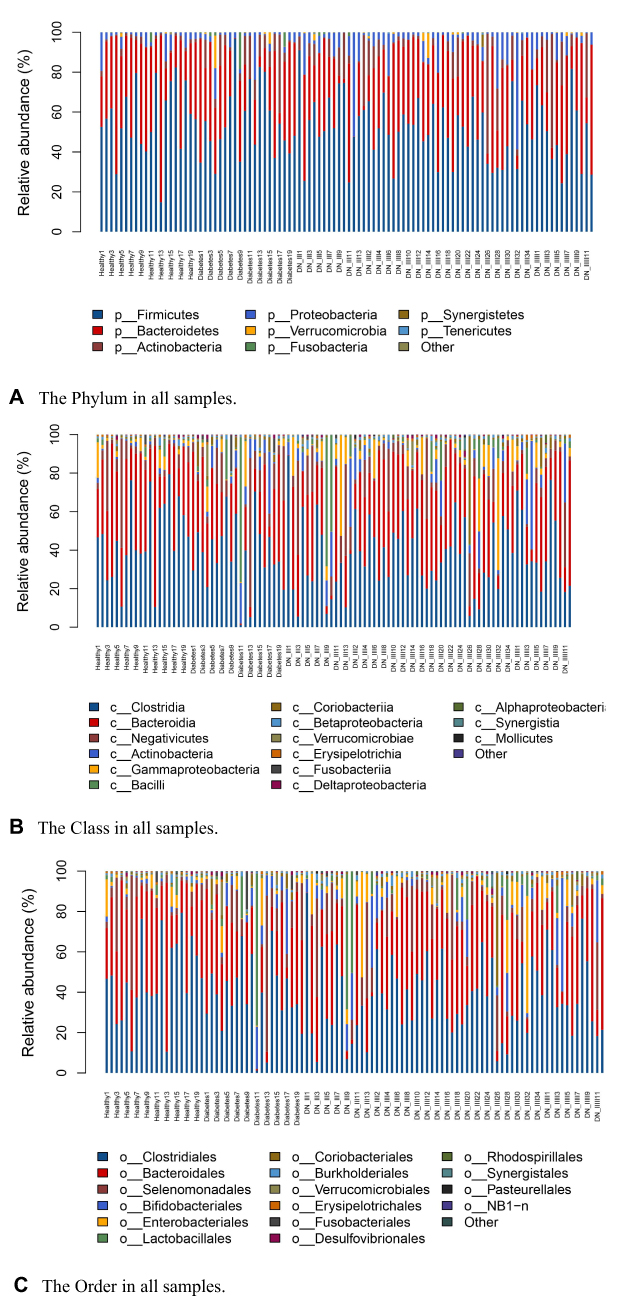
The Features of Gut Microbiota from the Differential Regulation Aspects Among Different Groups
We divided the 60 patients to male group (n = 41) and female group (n = 19). The Venn graph result was showed as follows (Supplementary Figure 1). The OTUs of male group were more than female group. 812 OTUs were shared in male and female group. Then, we evaluated the alpha diversity index of male group and female group (Supplementary Figure 2). The number of species of gut microbiota in male group was more than female group.
Secondly, we divided groups based on body mass index (BMI). BMI>24 was considered as overweight. Four groups were healthy without overweight group, healthy overweight group, DN without overweight group, DN overweight group. The Venn graph result was showed in Supplementary Figure 3. The results showed that the OTUs in DN overweight group were more than DN without overweight group. In addition, the OTUs in healthy overweight group were more than healthy without overweight group, either. Then, we evaluated the alpha diversity index of healthy without overweight group, healthy overweight group, DN without overweight group, DN overweight group (Supplementary Figure 4). The number of species of gut microbiota in DN without overweight group was less compared with healthy without overweight group. The number of species of gut microbiota in DN overweight group was highest compared with other groups.
Correlations Between Clinical Parameters and Gut Microbiota in DN Patients
We evaluated the correlations between clinical parameters and gut microbiota in 60 DN patients. The top 20 genera in 60 DN patients were calculated by taxonomic analysis. The top 20 genera included Bacteroides, Bifidobacterium, Faecalibacterium, Prevotella 9, Lactobacillus, Blautia, Escherichia Shigella, and Klebsiella. The results showed that 24-h UP was positively correlated with Alistipes (r = 0.271, P = 0.0037) and Subdoligranulum (r = 0.37, P = 0.036) (Figure 6). Cholesterol was positively correlated with Bacteroides (r = 0.33, P = 0.0098) and Lachnoclostridium (r = 0.33, P = 0.01). Triglycerides were positively correlated with Lachnoclostridium (r = 0.41, P = 0.001), Bacteroides (r = 0.33, P = 0.010), and Parabacteroides (r = 0.29, P = 0.02). ALB was negatively correlated with Alistipes (r = −0.33, P = 0.009) and Bacteroides (r = −0.26, P = 0.048). CRP was negatively correlated with Klebsiella (r = −0.27, P = 0.038). eGFR was negatively correlated with Ruminococcus torques group (r = −0.34, P = 0.0077). IL-6 was negatively correlated with Megasphaera (r = −0.28, P = 0.032). Hb was negatively correlated with Bacteroides (r = −0.38, P = 0.0026) and Ruminococcus torques group (r = −0.30, P = 0.021). We inferred that detrimental gut microbiota genus in DN might include Alistipes, Bacteroides, Subdoligranulum, Lachnoclostridium, and Ruminococcus torques group.
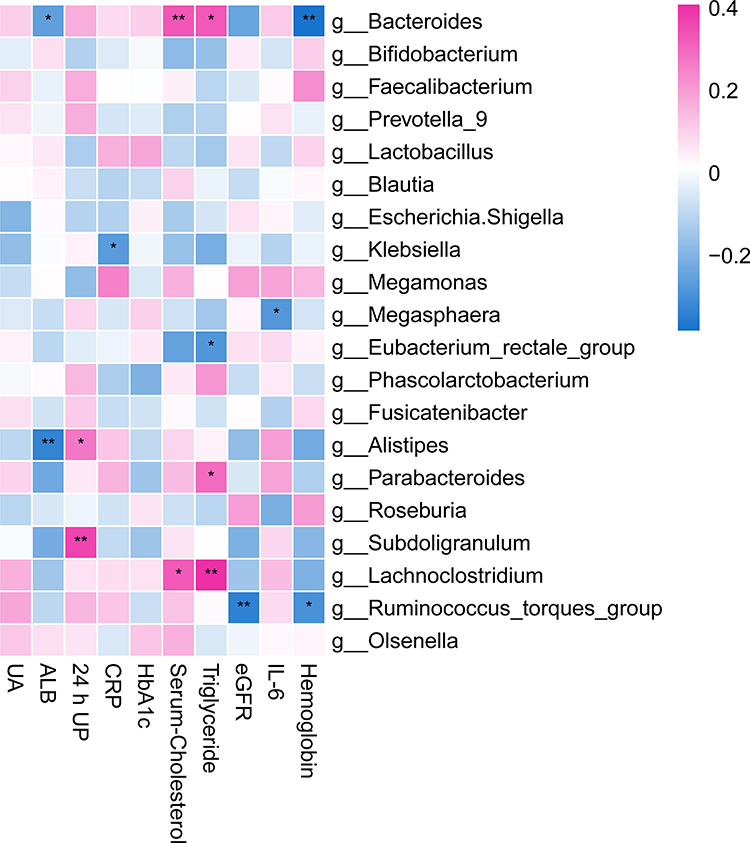 |
Figure 6 Correlations between clinical parameters and the top 20 gut microbiota in DN patients. The clinical parameters included uric acid (UA), albumin (ALB), 24-hour urine protein (24-h UP), C-reactive protein (CRP), haemoglobin A1c (HbA1c), serum cholesterol, triglycerides, estimated glomerular filtration rate (eGFR), interleukin 6 (IL-6), and haemoglobin. The gut microbiota included Bacteroides, Lactobacillus, Blautia, Klebsiella, etc. Pink indicates a positive correlation, blue indicates a negative correlation, while white indicates no correlation. *Indicates P < 0.05. **Indicates P < 0.01. |
Discussion
Gut microbiota are microorganisms living in the digestive tract of humans.20 The gut microbiota has the largest bacterial numbers in the body compared with other parts. Previous studies have investigated the relationship between diabetes and gut microbiota.21 Dysbiosis of the gut microbiota plays important roles in the pathogenesis and development of diabetes.22 First, some bacteria in the gut microbiota produce lipopolysaccharides (LPS) to induce the aggregation of inflammation. Diabetes is correlated with upregulated inflammatory cytokines and chemokines.23 Therefore, gut microbiota dysbiosis could increase the inflammatory status in diabetes. Second, gut microbiota dysbiosis might lead to enhanced intestinal permeability in diabetes.24 Enhanced intestinal permeability might cause metabolic endotoxaemia to exacerbate diabetes. Third, some kinds of bacteria in the gut microbiota could directly influence insulin resistance and glucose homeostasis in diabetes patients.25 Fourth, gut microbiota dysbiosis is correlated with increased oxidation of fatty acids.26
Previous studies already considered microbiota in diabetic nephropathy. Yu et al discovered the composition of the gut microbiota in Diabetic kidney disease (DKD) and membranous nephropathy (MN) patients. They found that the gut microbiota was different in DKD and MN patients. The related microbiome-associated markers were useful to distinguish DKD and MN.27 Lu et al used rat diabetic nephropathy model to discovered abnormal intestinal microflora might produce excessive acetate induce kidney injury in early DN.28 Gradisteanu et al conducted a pilot study including diabetes/DN patients and healthy controls. They revealed phyla abundance and relative abundance of specific bacterial groups. The relationship between microbiota and treatment with DN was investigated, either.29 Singh et al found significant gut microbiome changed in DN patients compared with control subjects.30 Sabatino et al cited that intestinal dysbiosis was correlated with endotoxemia and chronic inflammation.31 Furthermore, Kikuchi explored microbiome-derived phenyl sulfate promoted albuminuria in animal models of DN.15
In this study, we investigated the profile and function of the gut microbiota in diabetic kidneys. We found that the diversity of gut microbiota in the stage III DN group was smaller than that in the other groups in our study. Stage III DN was the forerunner of overt DN, which could be measured by radioimmunoassay.32 Stage III DN is characterized by abnormal urinary albumin excretion. Because stage III DN is a forerunner of overt DN, this stage is a pivotal point in the progression of DN. Stage III DN was correlated with reduced diversity of gut microbiota. Thus, it could be considered that reduced diversity of gut microbiota was an important indicator in the progression and development of DN.
We also analyzed from the differential regulation aspect based on gender and BMI. We found that male patients have more species of gut microbiota compared with female patients. Overweight patients have more species of gut microbiota compared without overweight patients. In DN disease, the disease progress of male and overweight patients was worse compared with female and without overweight patients. Thus, we inferred that more species of gut microbiota was symbol of bad disease progress in DN patients.
Next, we conducted taxonomic analyses in different groups. The distributions of phyla, classes, orders, families, and genera in different groups and samples were investigated. Finally, we evaluated the correlation between clinical parameters and gut microbiota in 60 DN patients. The results showed that some types of bacteria in the gut microbiota were positively correlated with clinical parameters, while other types of bacteria in the gut microbiota were negatively correlated with clinical parameters. ALB was negatively correlated with Alistipes and Bacteroides. ALB belongs to the globular protein family and is the main protein in human blood plasma. Low levels of ALB (microalbuminuria) are features of DN in the early stage.33 The Alistipes and Bacteroides genera are gut bacteria that were correlated with cancer, inflammation, and mental diseases. The Alistipes genus contributes to epithelial changes and inflammation formation in hypertension.34 The genus Bacteroides might also contribute to inflammation formation to coincide with Alistipes. In this study, we found that the Alistipes genus was negatively correlated with ALB and positively correlated with 24-h UP. A high level of ALB was a beneficial factor, while a high level of 24-h UP was an injurious factor in DN. Therefore, we inferred that the Alistipes genus was a detrimental factor in DN. The Bacteroides genus was positively correlated with cholesterol and triglycerides and negatively correlated with ALB and haemoglobin. Cholesterol is an independent risk factor in DN, and low cholesterol contributes to a favourable prognosis in DN.35 High levels of triglycerides are also an independent risk factor in the pathogenesis and development of DN.36 Furthermore, anaemia, with a low level of haemoglobin, is associated with a low quality of life and poor disease outcome in patients with DN. Reasonable management of anaemia in DN patients is also an important strategy in the treatment of DN.37 High levels of haemoglobin are a beneficial factor in DN. Therefore, our study revealed that the Bacteroides genus was a detrimental factor in DN. Apart from the Alistipes and Bacteroides genera, Subdoligranulum was positively correlated with 24-h UP. Therefore, Subdoligranulum might be a detrimental factor in DN. Lachnoclostridium was positively correlated with serum cholesterol and triglycerides, while Ruminococcus torques group was negatively correlated with eGFR and haemoglobin. Thus, Lachnoclostridium and Ruminococcus torques group might also be detrimental factors in DN. In brief, the genera Alistipes, Bacteroides, Subdoligranulum, Lachnoclostridium, and Ruminococcus torques group might be detrimental factors in DN.
Conclusion
In this study, we investigated the profile and function of the gut microbiota in DN patients. The diversity of gut microbiota in the stage III DN group was smaller than that in the other groups in our study. Therefore, reduced diversity of gut microbiota was an important indicator of the progression and development of early-stage DN. Next, we conducted alpha diversity analyses and taxonomic analyses in different groups. The distributions of phyla, classes, orders, families, and genera in different groups and samples were investigated. We also evaluated the correlation between clinical parameters and gut microbiota in 60 DN patients. We found that the genera Alistipes, Bacteroides, Subdoligranulum, Lachnoclostridium, and Ruminococcus torques group might be detrimental factors in the development and progression of DN. In the future, a more detailed mechanism of the correlation between gut microbiota and DN needs to be investigated.
Data Sharing Statement
The data that support the findings of this study are available from the corresponding authors.
Ethics Approval and Consent to Participate
This study was approved by the Ethics Committee of Dongzhimen Hospital affiliated with Beijing University of Chinese Medicine (No. DZMEC-KY-2016-95). Every patient and healthy control subject signed informed consent forms.
Author Contributions
Weiwei Sun and Kai Yuan took part in drafting the article, Weihong Chen contributed to study design, Mengjiu Zhang, Yan Guo, Zhen Wang, Qingqing Liu, Runze Yan contributed to acquisition of data, Yi Wang and Qiaoru Wu performed the statistical analysis. All authors made substantial contributions to conception and design, took part in revising the article critically for important intellectual content, agreed to submit to the current journal, gave final approval of the version to be published and agreed to be accountable for all aspects of the work.
Funding
This work was supported by projects of the Fundamental Research Funds for the Central Universities (2018-JYB-JS056).
Disclosure
The authors declare no conflicts of interest for this work.
References
1. Khoshjou F. A glimpse of diabetic nephropathy. J Nephropharmacol. 2016;6(1):1–2.
2. Umanath K, Lewis JB. Update on diabetic nephropathy: core curriculum 2018. Am J Kidney Dis. 2018;71(6):884–895. doi:10.1053/j.ajkd.2017.10.026
3. Alicic RZ, Rooney MT, Tuttle KR. Diabetic kidney disease: challenges, progress, and possibilities. Clin J Am Soc Nephrol. 2017;12(12):2032–2045. doi:10.2215/CJN.11491116
4. Tziomalos K, Athyros VG. Diabetic nephropathy: new risk factors and improvements in diagnosis. Rev Diabet Stud. 2015;12(1–2):110–118. doi:10.1900/RDS.2015.12.110
5. Zheng S, Powell DW, Zheng F, Kantharidis P, Gnudi L. Diabetic nephropathy: proteinuria, inflammation, and fibrosis. J Diabetes Res. 2016;2016:5241549.
6. Waanders F, Visser FW, Gans RO. Current concepts in the management of diabetic nephropathy. Neth J Med. 2013;71(9):448–458.
7. Barko PC, McMichael MA, Swanson KS, Williams DA. The gastrointestinal microbiome: a review. J Vet Intern Med. 2018;32(1):9–25. doi:10.1111/jvim.14875
8. Bibbò S, Ianiro G, Giorgio V, et al. The role of diet on gut microbiota composition. Eur Rev Med Pharmacol Sci. 2016;20(22):4742–4749.
9. Nardone G, Compare D, Rocco A. A microbiota-centric view of diseases of the upper gastrointestinal tract. Lancet Gastroenterol Hepatol. 2017;2(4):298–312. doi:10.1016/S2468-1253(16)30108-X
10. Rooks MG, Garrett WS. Gut microbiota, metabolites and host immunity. Nat Rev Immunol. 2016;16(6):341–352. doi:10.1038/nri.2016.42
11. Patterson E, Ryan PM, Cryan JF, et al. Gut microbiota, obesity and diabetes. Postgrad Med J. 2016;92(1087):286–300. doi:10.1136/postgradmedj-2015-133285
12. Garrett WS. The gut microbiota and colon cancer. Science. 2019;364(6446):1133–1135. doi:10.1126/science.aaw2367
13. Tilg H, Moschen AR. Microbiota and diabetes: an evolving relationship. Gut. 2014;63(9):1513–1521. doi:10.1136/gutjnl-2014-306928
14. Fernandes R, Viana S, Nunes S, Reis F. Diabetic gut microbiota dysbiosis as an inflammaging and immunosenescence condition that fosters progression of retinopathy and nephropathy. Biochim Biophys Acta Mol Basis Dis. 2019;1865(7):1876–1897.
15. Kikuchi K, Saigusa D, Kanemitsu Y, et al. Gut microbiome-derived phenyl sulfate contributes to albuminuria in diabetic kidney disease. Nat Commun. 2019;10(1):1835. doi:10.1038/s41467-019-09735-4
16. Li Y, Su X, Gao Y, et al. The potential role of the gut microbiota in modulating renal function in experimental diabetic nephropathy murine models established in same environment. Biochim Biophys Acta Mol Basis Dis. 2020;1866(6):165764. doi:10.1016/j.bbadis.2020.165764
17. Mosterd CM, Kanbay M, van den Born BJH, et al. Intestinal microbiota and diabetic kidney diseases: the role of microbiota and derived metabolites inmodulation of renal inflammation and disease progression. Best Pract Res Clin Endocrinol Metab. 2021;35(3):101484. doi:10.1016/j.beem.2021.101484
18. Peterson C, Sharma V, Elmén L, Peterson SN. Immune homeostasis, dysbiosis and therapeutic modulation of the gut microbiota. Clin Exp Immunol. 2015;179(3):363–377. doi:10.1111/cei.12474
19. Liubakka A, Vaughn BP. Clostridium difficile infection and fecal microbiota transplant. AACN Adv Crit Care. 2016;27(3):324–337. doi:10.4037/aacnacc2016703
20. Valdes AM, Walter J, Segal E, Spector TD. Role of the gut microbiota in nutrition and health. BMJ. 2018;361:k2179. doi:10.1136/bmj.k2179
21. Muñoz-Garach A, Diaz-Perdigones C, Tinahones FJ. Gut microbiota and type 2 diabetes mellitus. Endocrinol Nutr. 2016;63(10):560–568. doi:10.1016/j.endonu.2016.07.008
22. Li X, Watanabe K, Kimura I. Gut microbiota dysbiosis drives and implies novel therapeutic strategies for diabetes mellitus and related metabolic diseases. Front Immunol. 2017;8:1882. doi:10.3389/fimmu.2017.01882
23. Chen P, Zhang Q, Dang H, et al. Antidiabetic effect of Lactobacillus casei CCFM0412 on mice with type 2 diabetes induced by a high-fat diet and streptozotocin. Nutrition. 2014;30(9):1061–1068. doi:10.1016/j.nut.2014.03.022
24. Cani PD, Amar J, Iglesias MA, et al. Metabolic endotoxemia initiates obesity and insulin resistance. Diabetes. 2007;56(7):1761–1772. doi:10.2337/db06-1491
25. Kim S, Huh C, Choi I, et al. The anti-diabetic activity of Bifidobacterium lactis HY8101 in vitro and in vivo. J Appl Microbiol. 2014;117(3):834–845. doi:10.1111/jam.12573
26. Houmard JA. Intramuscular lipid oxidation and obesity. Am J Physiol Regul Integr Comp Physiol. 2008;294(4):R1111–R1116. doi:10.1152/ajpregu.00396.2007
27. Yu W, Shang J, Guo R, et al. The gut microbiome in differential diagnosis of diabetic kidney disease and membranous nephropathy. Ren Fail. 2020;42(1):1100–1110. doi:10.1080/0886022X.2020.1837869
28. Lu C, Hu Z, Wang R, et al. Gut microbiota dysbiosis-induced activation of the intrarenal renin-angiotensin system is involved in kidney injuries in rat diabetic nephropathy. Acta Pharmacol Sin. 2020;41(8):1111–1118. doi:10.1038/s41401-019-0326-5
29. Gradisteanu GP, Stoica RA, Petcu L, Picu A, Suceveanu AP. Microbiota signatures in type-2 diabetic patients with chronic kidney disease – a pilot study. J Mind Med Sci. 2019;6(1):130–136.
30. American Society of Nephrology (ASN). Gut Microbiota Changes in Diabetic Kidney Disease Contribute to Chronic Inflammation and Vascular Complications. ScienceDaily; 2015.
31. Sabatino A, Regolisti G, Cosola C, et al. Intestinal microbiota in type 2 diabetes and chronic kidney disease. Curr Diab Rep. 2017;17(3):16. doi:10.1007/s11892-017-0841-z
32. Wada J, Makino H. Inflammation and the pathogenesis of diabetic nephropathy. Clin Sci (Lond). 2013;124(3):139–152. doi:10.1042/CS20120198
33. Kishore L, Kaur N, Singh R. Distinct biomarkers for early diagnosis of diabetic nephropathy. Curr Diabetes Rev. 2017;13(6):598–605. doi:10.2174/1573399812666161207123007
34. Parker B, Wearsch P, Veloo A, Rodriguez-Palacios A. The genus alistipes: gut bacteria with emerging implications to inflammation, cancer, and mental health. Review Front Immunol. 2020;11:906. doi:10.3389/fimmu.2020.00906
35. Sun H, Yuan Y, Sun Z. Cholesterol contributes to diabetic nephropathy through SCAP-SREBP-2 pathway. Int J Endocrinol. 2013;2013:592576. doi:10.1155/2013/592576
36. Russo G, Cosmo S, Viazzi F, et al. Plasma triglycerides and HDL-C levels predict the development of diabetic kidney disease in subjects with type 2 diabetes: the AMD annals initiative. Observ Stud Diabetes Care. 2016;39(12):2278–2287. doi:10.2337/dc16-1246
37. Bajaj S, Makkar B, Abichandani V, et al. Management of anemia in patients with diabetic kidney disease: a consensus statement. Rev Indian J Endocrinol Metab. 2016;20(2):268–281. doi:10.4103/2230-8210.176348
 © 2021 The Author(s). This work is published and licensed by Dove Medical Press Limited. The
full terms of this license are available at https://www.dovepress.com/terms
and incorporate the Creative Commons Attribution
- Non Commercial (unported, 3.0) License.
By accessing the work you hereby accept the Terms. Non-commercial uses of the work are permitted
without any further permission from Dove Medical Press Limited, provided the work is properly
attributed. For permission for commercial use of this work, please see paragraphs 4.2 and 5 of our Terms.
© 2021 The Author(s). This work is published and licensed by Dove Medical Press Limited. The
full terms of this license are available at https://www.dovepress.com/terms
and incorporate the Creative Commons Attribution
- Non Commercial (unported, 3.0) License.
By accessing the work you hereby accept the Terms. Non-commercial uses of the work are permitted
without any further permission from Dove Medical Press Limited, provided the work is properly
attributed. For permission for commercial use of this work, please see paragraphs 4.2 and 5 of our Terms.