Back to Journals » Infection and Drug Resistance » Volume 19
The Predictive Value of Dynamic Changes in Procalcitonin and C-Reactive Protein in Evaluating Response of Patients with Pulmonary Tuberculosis in the Early Treatment
Authors Kong X, Pan S, Huang B, Zhao L
Received 4 October 2025
Accepted for publication 16 January 2026
Published 2 February 2026 Volume 2026:19 566150
DOI https://doi.org/10.2147/IDR.S566150
Checked for plagiarism Yes
Review by Single anonymous peer review
Peer reviewer comments 3
Editor who approved publication: Dr Hazrat Bilal
Xiangzhou Kong,1– 3,* Suxiang Pan,4,* Bangmin Huang,3,* Lei Zhao1
1Department of Respiratory and Critical Care Medicine, the First Affiliated Hospital North District of Anhui Medical University, Hefei, 230011, People’s Republic of China; 2Department of Respiratory and Critical Care Medicine, Anhui Public Health Clinical Center, Hefei, 230011, People’s Republic of China; 3Department of Tuberculosis, Anhui Chest Hospital, Hefei, 230031, People’s Republic of China; 4Neonatal Intensive Care Unit, Affiliated Hospital of Putian University, Putian, 351146, People’s Republic of China
*These authors contributed equally to this work
Correspondence: Lei Zhao, Email [email protected]
Objective: To explore the predictive value of dynamic changes in procalcitonin (PCT) and C-reactive protein (CRP) in evaluating early treatment response in patients with pulmonary tuberculosis (PTB).
Methods: A retrospective study was conducted on 168 PTB patients from June 2022 to June 2024. Based on early treatment efficacy, patients were divided into an effective group (136 cases, 80.95%) and an ineffective group (32 cases, 19.05%). Clinical data of the two groups were compared, and variables showing significant differences were analyzed using logistic regression analysis. The predictive value was evaluated through ROC curves, nomograms, and calibration curves. The dynamic changes in PCT and CRP and their correlations with treatment outcomes were also analyzed.
Results: Significant differences were observed between the ineffective and effective groups in terms of the number of lung fields involved and pulmonary cavitary lesions (P < 0.05). Additionally, baseline levels of PCT, CRP and IL-6 were significantly higher in the ineffective group than in the effective group (P < 0.05). The number of lung fields involved, pulmonary cavitary lesions, PCT, CRP, and IL-6 were identified as independent factors influencing early treatment efficacy in PTB patients. PCT, CRP, and IL-6 demonstrated high predictive value for treatment outcomes. On days 1, 5, and 7 after treatment, PCT and CRP levels were significantly lower in the effective group than in the ineffective group (P < 0.05), with the most pronounced difference observed on day 1. Greater reductions in PCT and CRP levels were associated with better treatment outcomes and larger lesion absorption area (P < 0.05).
Conclusion: The number of lung fields involved, pulmonary cavitary lesions, PCT, CRP, and IL-6 all influence early treatment efficacy in PTB patients. Among these, dynamic changes in PCT and CRP exhibit high predictive value, providing a reliable basis for clinical assessment.
Keywords: pulmonary tuberculosis, procalcitonin, C-reactive protein, interleukin-6, pulmonary cavitary lesions
Introduction
Pulmonary tuberculosis (PTB), a prevalent chronic infectious disease caused by Mycobacterium tuberculosis, exhibits a high transmission rate, predominantly via respiratory droplets or contaminated surfaces.1 The primary clinical manifestations include cough, fever, chest tightness and night sweats. In severe cases, patients may experience respiratory symptoms such as dyspnea. In recent years, the global incidence of tuberculosis has been rising annually, with China being the second most affected country, ranking first in both incidence and mortality among infectious diseases.2 The treatment of PTB is a prolonged and intricate process, necessitating strict adherence to anti-tuberculosis medications while closely monitoring treatment efficacy and adjusting the therapeutic regimen as needed.3 Previous study4 has underscored the critical importance of early and accurate assessment of treatment response to optimize therapeutic strategies, reduce the emergence of drug resistance, improve cure rates, and enhance patient prognosis. However, traditional assessment methods often have certain limitations and may not meet the need for early and precise clinical evaluation. The improvement of clinical symptoms tends to be delayed, usually becoming apparent only after several weeks of treatment, which makes it difficult to promptly determine the effectiveness of the initial treatment regimen. Chest imaging can reflect overall changes in lesions, but short-term absorption or reduction in lesions is often not evident, potentially leading to delays in treatment adjustments. Sputum smear or culture for Mycobacterium tuberculosis conversion to negative remains the traditional gold standard, yet culture requires a long period of 4–8 weeks, which is time-consuming and subject to variations in specimen quality and detection techniques, thereby failing to provide timely support for early treatment decisions. These limitations may not only increase the risk of drug-resistant tuberculosis but also prolong the infectious period and aggravate the disease burden for patients. Hence, there is an urgent need to identify more timely and sensitive early assessment indicators.5
Procalcitonin (PCT) and C-reactive protein (CRP) are commonly used clinical inflammatory biomarkers, have gained widespread attention in the field of diagnosis and treatment monitoring of infectious diseases. CRP has been utilized for over 40 years, while PCT has gradually become a core indicator for infection assessment in the past two decades.6 Both play significant roles in the diagnosis, disease monitoring, and prognosis evaluation of infectious diseases.7 PCT is a precursor of the hormone calcitonin secreted primarily by C cells of the thyroid gland. In healthy individuals, serum PCT levels are typically maintained at a low baseline. However, in the context of systemic bacterial infections, sepsis, and other severe infectious conditions, PCT synthesis is markedly upregulated, and its serum concentration can rise sharply within hours. The magnitude of this increase is closely associated with the severity of infection and prognosis. CRP, an acute-phase reactant synthesized by the liver, exhibits a rapid increase in response to inflammation, infection, and tissue damage, with significant changes detectable within several hours post-inflammation. The fluctuation in CRP levels serves as a sensitive indicator of the degree of inflammatory activity and treatment efficacy.8 Previous studies have explored the application of biomarkers in the evaluation of PTB treatment. However, some indicators are limited by insufficient specificity or a lack of dynamic monitoring data, and the predictive value of combined dynamic monitoring of PCT and CRP in the early treatment response of PTB has not yet reached a consensus, with a scarcity of large-scale clinical data to support it. Therefore, this study focuses on the dynamic patterns of PCT and CRP, integrating clinicopathological features and other inflammatory factors, to further clarify their predictive efficacy and provide more precise references for early clinical intervention.
Research9 indicates that during anti-tuberculosis therapy in PTB patients, the inflammatory response evolves as treatment progresses, potentially correlating with treatment effectiveness. Monitoring the dynamic changes in PCT and CRP levels provides a valuable basis for assessing the early treatment response in PTB patients from an inflammatory perspective. Additionally, tracking PCT and CRP levels at various time points can ascertain early treatment efficacy, promptly identify treatment failures, and detect drug resistance, thereby guiding clinicians in adjusting therapeutic strategies. This study not only aims to enhance the treatment success rate of PTB but also seeks to mitigate its transmission, which holds significant practical implications for global tuberculosis prevention and control.10,11 To achieve this objective, a retrospective data analysis was conducted to thoroughly investigate the predictive value of dynamic changes in PCT and CRP levels in assessing the early treatment of PTB patients. By continuously monitoring serum PCT and CRP levels throughout the treatment process, a comprehensive analysis of their dynamic patterns was performed. The goal is to optimize the PTB treatment management strategies, thereby improving patient quality of life and prognosis, and providing a scientific and accurate reference for PTB treatment.
Materials and Methods
General Information
A total of 168 PTB patients admitted to our hospital between June 2022 and June 2024 were retrospectively selected for this study. The study received approval from the Medical Ethics Committee of Anhui Chest Hospital (Approval No.: Ky20250907), and all procedures adhered to the ethical standards of the 1964 Declaration of Helsinki and its amendments. Informed consent was obtained from each participant.
Inclusion Criteria
(1) Meeting the diagnostic criteria for PTB in the “WHO Guidelines on Tuberculosis Infection Prevention and Control”,12 including clinical symptoms, chest imaging examination, positive Mycobacterium tuberculosis in sputum smear or sputum culture, etc. (2) Newly diagnosed patients who have not received anti-tuberculosis treatment before. (3) Aged between 18 and 70 years old. (4) Those who can communicate normally in language and have no cognitive impairment. (5) Patients and their families were fully informed and gave consent for this study. All diagnoses and efficacy evaluations in this study strictly followed the WHO Guidelines on Tuberculosis Infection Prevention and Control, ensuring standardized procedures and international comparability of the assessment process.
Exclusion Criteria
(1) Complicated with other severe infectious diseases, malignant tumors. (2) Severe abnormalities in liver and kidney functions. (3) Patients with autoimmune diseases or those taking medications potentially affecting immune function. (4) Pregnant or lactating women. (5) Those with severe visual or auditory impairment. (6) Patients with cancer. (7) Patients with extrapulmonary infectious diseases (such as active tuberculous pleurisy, tuberculous lymphadenitis, or tuberculous meningitis) that may affect inflammatory markers (PCT, CRP, IL-6) or the efficacy of anti-tuberculosis treatment. (8) Poor treatment compliance, resulting in failure to complete the prescribed course of treatment.
Treatment Method
All participants received the standard anti-tuberculosis treatment regimen, which comprised a quadruple therapy of rifampicin, isoniazid, pyrazinamide, and ethambutol. Rifampicin (Changzhou Pharmaceutical Factory Co., Ltd., National Drug Approval No. H32021677, specification: 0.15g) was administered before meals once daily at a dosage of 10 mg/kg, not exceeding 450 mg per day. Isoniazid (Shanghai New Yellow River Pharmaceutical Co., Ltd., National Drug Approval No. H31020495, specification: 100mg) was taken after meals daily at a dosage of 10 mg/kg, with a maximum of 300 mg per day. Pyrazinamide (Shenyang Hongqi Pharmaceutical Co., Ltd., National Drug Approval No. H21022352, specification: 0.25g) was administered once daily at a dosage of 20–30 mg/kg. Ethambutol (Hangzhou Minsheng Pharmaceutical Co., Ltd., National Drug Approval No. H33021602, specification: 0.25g) was also administered once daily at a dosage of 20–30 mg/kg. During the intensive treatment phase, spanning two months, and the subsequent consolidation treatment phase, lasting four to six months, the treatment regimen is modified in response to changes in the patient’s condition and any adverse drug reactions.
Data Collection
Clinical data and disease-related characteristics of all patients were collected through the hospital’s electronic medical record management system. These included gender, age, body mass index, place of residence, smoking history, drinking history, Acute Physiology and Chronic Health Evaluation II (APACHE II) score, clinical symptoms, combined underlying diseases (such as diabetes, hypertension, coronary heart disease, and other non-infectious chronic diseases), combined extrapulmonary diseases (specifically non-infectious diseases outside the lungs, such as thyroid disorders, non-infectious gastrointestinal diseases, and autoimmune diseases; extrapulmonary infectious diseases were already covered in the exclusion criteria), number of lung fields involved, pulmonary cavitary lesions, PCT, CRP, IL-6, and tumor necrosis factor-α (TNF-α).
Laboratory Examinations
Peripheral venous blood (5 mL) was collected from patients under fasting conditions before treatment (on the day of treatment initiation) and on days 1, 5, and 7 after treatment. The blood samples were placed in vacuum tubes without anticoagulant. Serum was isolated after allowing the sample to equilibrate at room temperature for 30 minutes, utilizing a centrifuge (Jiangsu Yunyu Medical Technology Co., Ltd., Mic30), set at 3000 r/min for a duration of 10 minutes. The supernatant venous blood was then transferred to a centrifuge tube (EPeppendorf, EP) and stored at −80°C for subsequent analysis. Serum PCT levels were quantified using an electrochemiluminescence immunoassay, employing the Roche Cobas e601 fully automated electrochemiluminescence immunoanalyzer, with the corresponding Roche reagent kit. The normal reference range for PCT is <0.5 ng/mL. Serum CRP levels were measured via immunoturbidimetry, using the Beckman Coulter AU5800 fully automated biochemical analyzer, along with the appropriate Beckman Coulter reagent kit. The normal reference range for CRP is 0–10 mg/L. All steps of sample collection, processing, storage, and testing were performed in strict accordance with standardized protocols. Centrifugation parameters, storage conditions, instrument models, and reagent brands were clearly documented to ensure the reproducibility of experimental procedures and the consistency of results.
Criteria for Efficacy Evaluation
After 8 weeks of treatment, the therapeutic efficacy was assessed using a composite endpoint. Patients were classified into an effective group or an ineffective group based on the combined results of the following three independent categories of indicators: (1) Microbiological indicators: Results of sputum smear acid-fast bacilli examination and sputum Mycobacterium tuberculosis culture, with conversion to negative serving as the achievement criterion. (2) Clinical symptoms and signs: Improvement in symptoms such as cough, expectoration, hemoptysis, fever, night sweats, and fatigue, as well as the resolution of lung rales) and other physical signs. Significant improvement was regarded as the achievement criterion. (3) Chest imaging Indicators: Observation of lesions absorption and cavity closure/reduction via chest X-ray or CT scan. Absorption of lesion area ≥50% was used as the achievement criterion. Judgment criteria: If all three categories of indicators met the achievement criteria, the case was judged as effective treatment. If any of the following occurred, the case was judged as ineffective treatment: persistent positivity of microbiological indicators, no improvement or worsening of clinical symptoms/signs, or chest imaging showing no change or progression of lesions (absorption area < 50% or enlargement).
The APACHE II Scoring Standard
The APACHE II13 scoring system, utilized for evaluating the severity of a patient’s condition, is computed within the first 24 hours following admission. This system assesses the severity by integrating multiple physiological parameters, age, and prior health status. The APACHE II score comprises three components: acute physiology score, the age score, and the chronic health score. Specifically, the acute physiology score is a weighted calculation derived from 12 physiological parameters, including body temperature, mean arterial pressure, heart rate, and respiratory rate. The age score is adjusted based on the patient’s age, while the chronic health score accounts for any history of severe organ dysfunction or immunosuppression. The APACHE II score ranges from 0 to 71, with higher scores, indicating more severe conditions and an elevated risk of mortality. The scale demonstrates good reliability and validity, as evidenced by an overall Cronbach’s α coefficient of 0.892, and a split-half reliability coefficient of 0.906.
Observation Indicators
Clinical data from all PTB patients were collected, and their clinical characteristics were observed. Based on the early clinical treatment outcomes, patients were divided into groups. The general demographic data were compared between the groups, and the items showing significant differences were calculated by multivariate Logistic regression to identify factors influencing early treatment efficacy. Based on these results, a nomogram, calibration curve, and ROC curve were constructed to analyze the predictive value of the dynamic changes in PCT and CRP in evaluating early treatment response in PTB patients. After constructing the nomogram model, internal validation was performed using the bootstrap resampling method with 1,000 repetitions. The discrimination ability of the model was assessed by calculating the concordance index (C-index), and a calibration curve was plotted to compare the agreement between predicted and observed values, thereby validating the predictive accuracy of the model. Dynamic changes in PCT and CRP levels at different time points were compared, and the correlation between these dynamic changes and treatment efficacy was analyzed.
Statistical Processing
Data analysis in this study was calculated using SPSS version 25.0. Categorical data were presented as [n (%)] and analyzed using the chi-square test. The Shapiro–Wilk test was employed to assess whether the measurement data adhered to a normal distribution. Data conforming to a normal distribution were presented as mean ± standard deviation (SD), and comparisons between two groups were conducted using an independent samples t-test. For intra-group comparison, a paired sample t-test was utilized. In cases where the data did not conform to a normal distribution, they were expressed as [M (P25, P75)] and a non-parametric test was applied. Statistical significance was determined at a threshold of P < 0.05.
Overall Evaluation of Research Methodology
This study adopted a retrospective cohort design and strictly adhered to observational research reporting guidelines. The research framework is comprehensive, encompassing subject selection, well-defined inclusion and exclusion criteria, standardized treatment protocols, detailed clinical and laboratory data collection procedures, standardized testing methods and equipment specifications, a composite efficacy evaluation system, and a sound statistical analysis strategy. All drug dosages, manufacturers, and instrument models were clearly specified to enhance methodological reproducibility and transparency. We believe that this methodological design is capable of addressing the research question in a clear and systematic manner, thereby providing a reliable foundation for subsequent analyses.
Results
Condition of Treatment Effect
The study included a total of 168 patients with PTB, who were categorized into groups based on the early treatment response. Of these, 136 patients (80.95%) were classified into the effective group, with a lesion absorption area of (68.25±10.76)%. The remaining 32 patients (19.05%) were classified into the ineffective group, with a lesion absorption area of (35.14±10.68)%.
Comparison of Clinical Data Among Different Groups
Comparison of the clinical data between the two groups revealed that the proportion of “≥3 lung fields involved” was significantly higher in the ineffective group than in the effective group (χ2 = 12.089, P = 0.001). The proportion of patients with cavitary lesions was significantly higher in the ineffective group than in the effective group (χ2= 11.366, P = 0.001). PCT was significantly higher in the ineffective group than in the effective group (Z = –7.614, P < 0.001). CRP was significantly higher in the ineffective group than in the effective group (Z = –8.747, P < 0.001). IL-6 was significantly higher in the ineffective group than in the effective group (t = 8.339, P < 0.001, Table 1).
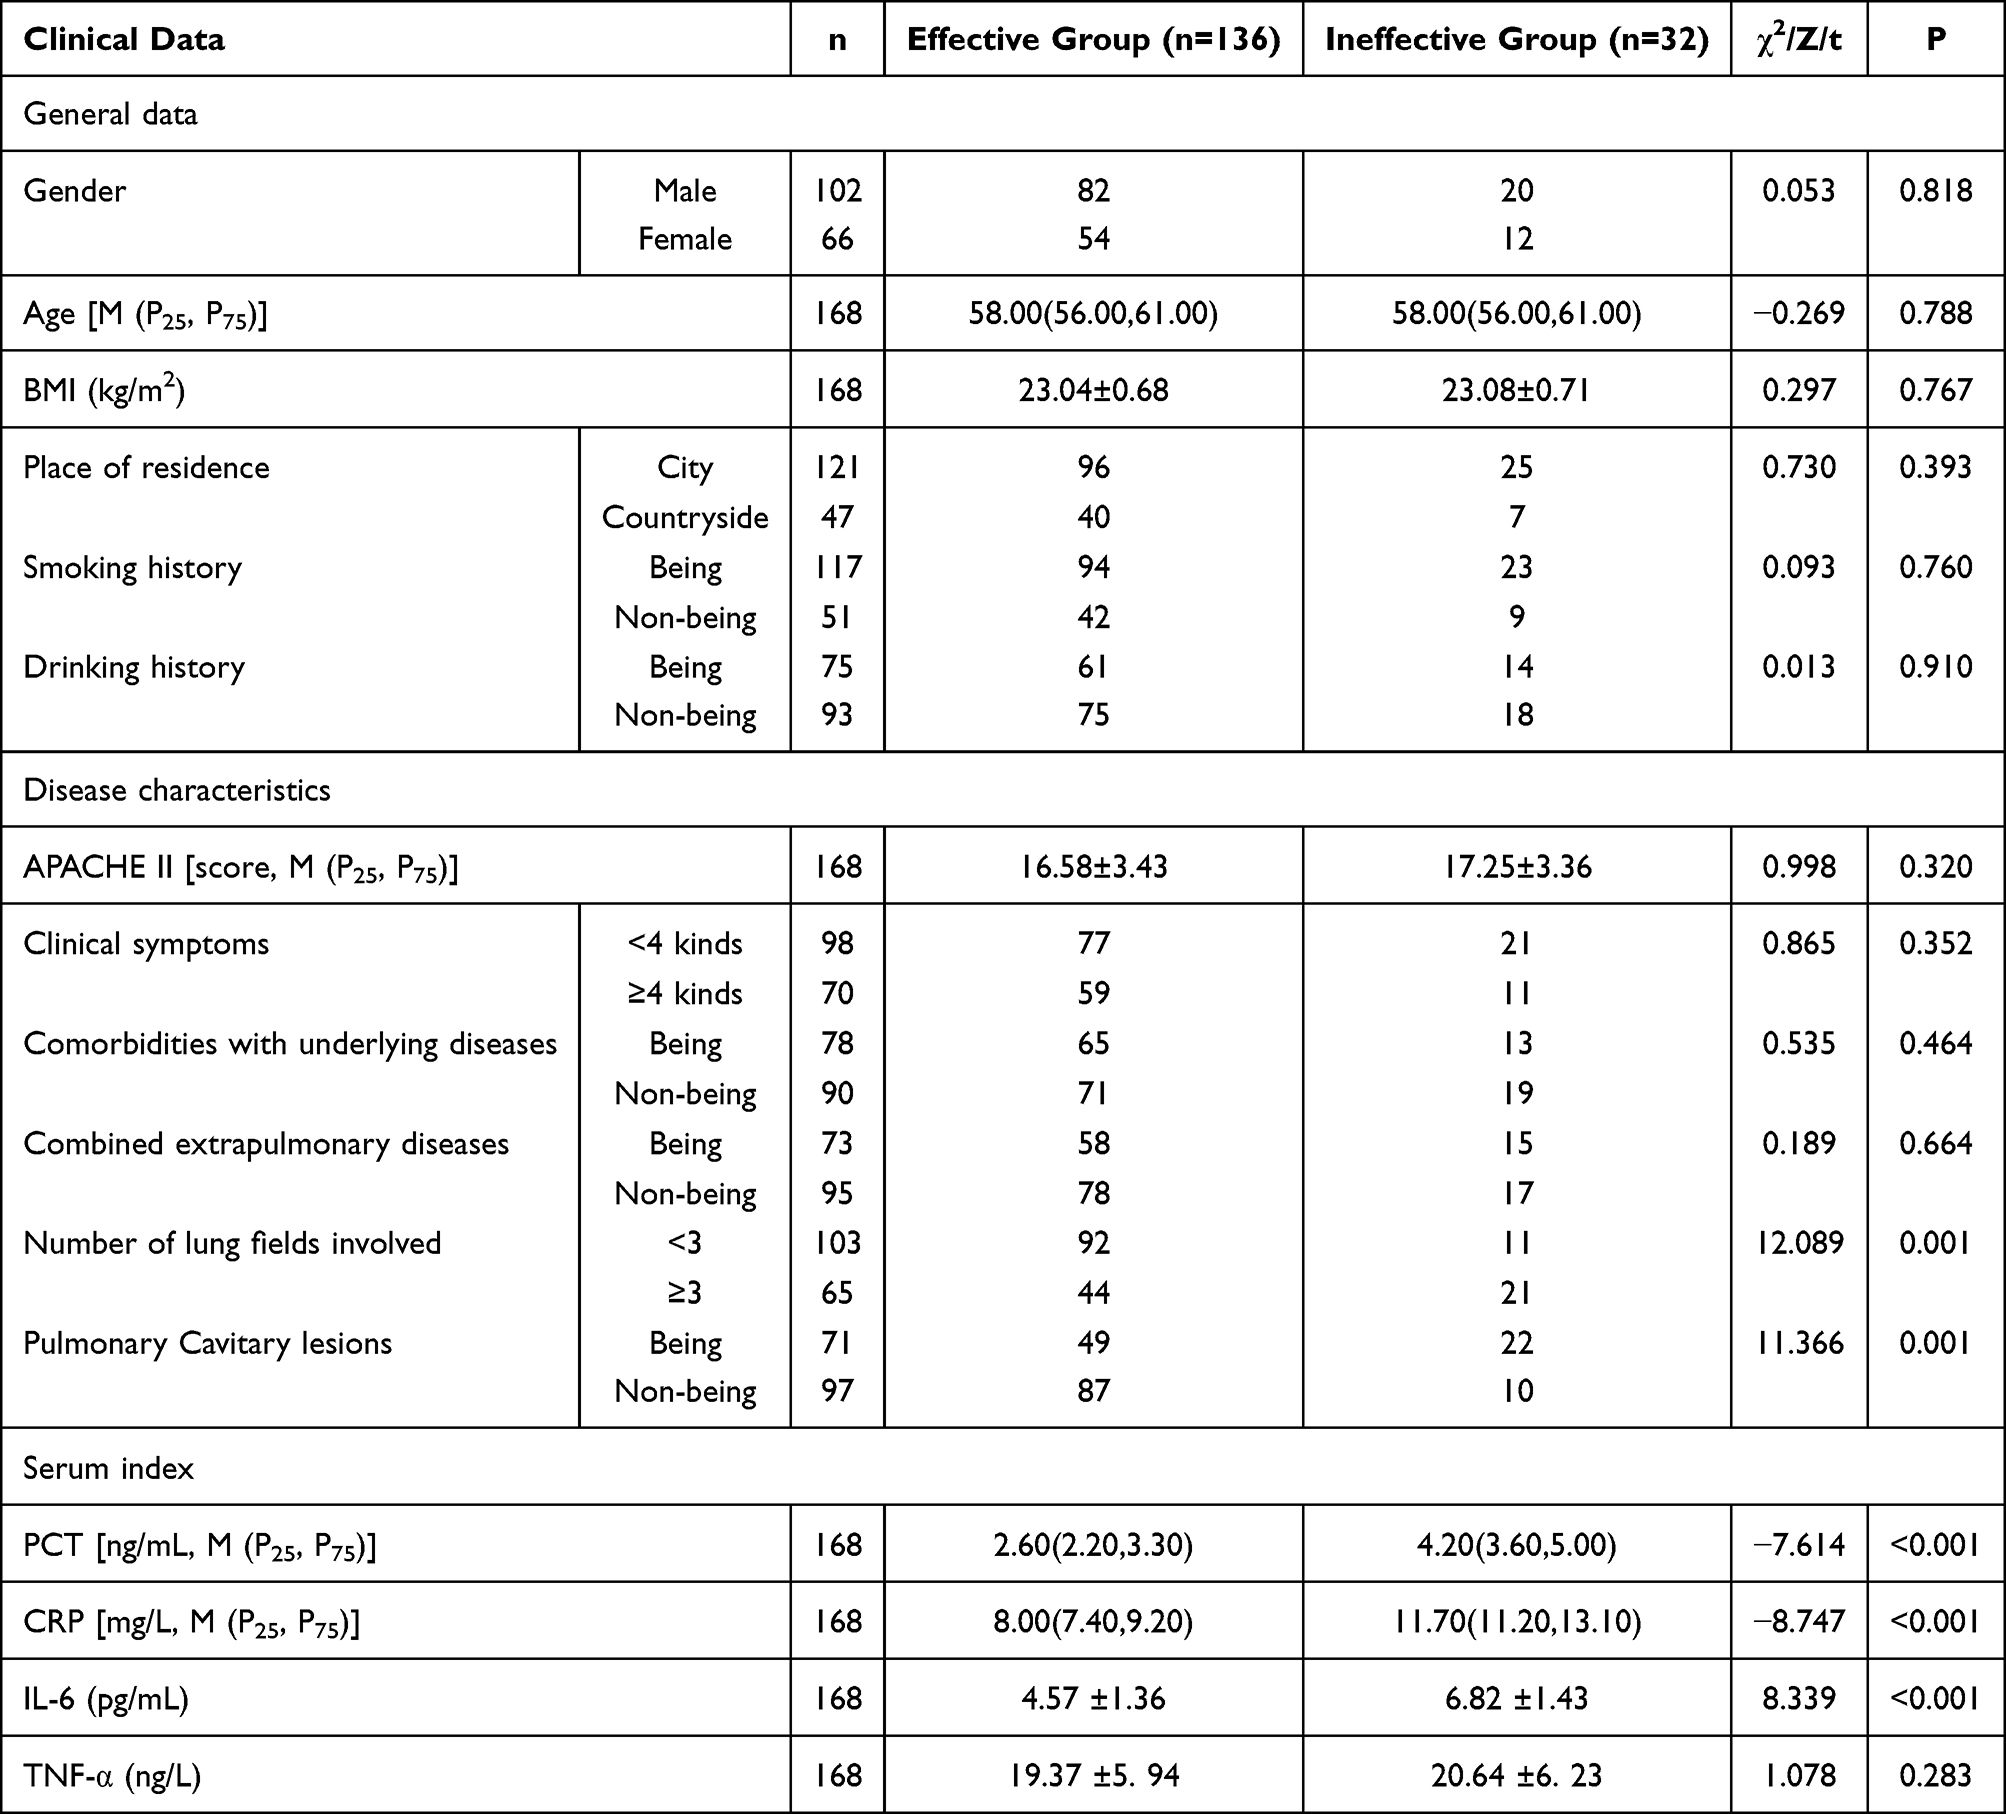 |
Table 1 Comparison of Clinical Data of Each Group (n=168) |
Independent Variable Assignment Table
In this study, the early treatment outcome in PTB patients is designated as the dependent variable (Y), while the number of lung fields involved (X1), pulmonary cavitary lesions (X2), PCT (X3), CRP (X4), and IL-6 (X5) are considered independent variables (Table 2).
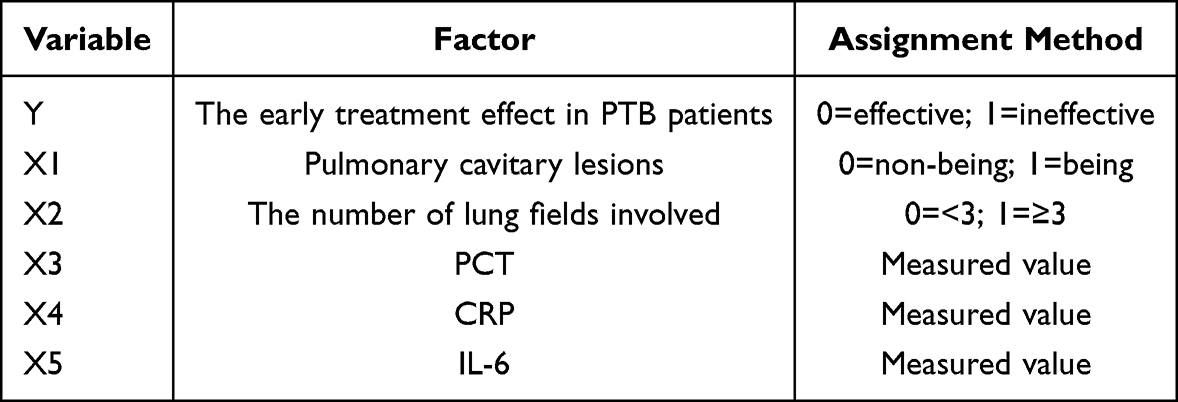 |
Table 2 Independent Variable Assignment Table |
Collinearity Analysis
Collinearity analysis of these differential indicators, identified through univariate analysis, demonstrated no collinearity among the variables (Variance Inflation Factor [VIF] ≤ 10, tolerance ≥ 0.1). This suggests that these indicators are suitable for inclusion in the logistic regression model analysis (Table 3).
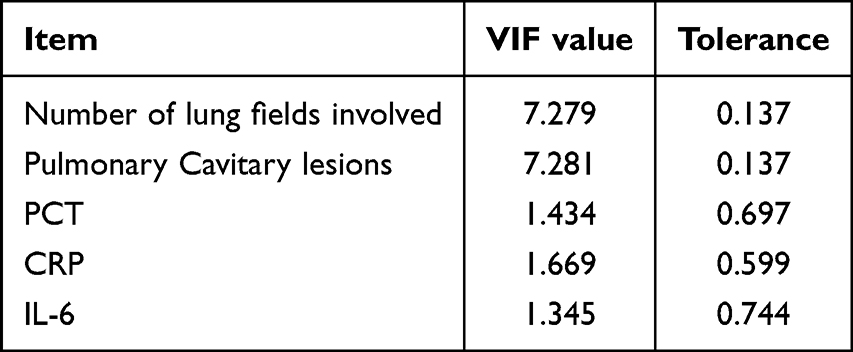 |
Table 3 Collinearity Analysis |
Multifactorial Analysis of Factors Affecting the Early Treatment Effect in PTB Patients
Following the application of logistic regression analysis, the odds ratios (OR) for variables exhibiting differences, namely, the number of lung fields involved, pulmonary cavitary lesions, and levels of PCT, CRP, and IL-6 were determined to be 3.992, 3.906, 17.380, 15.296, and 3.470 respectively. These findings suggest that these variables are independent factors influencing the early treatment outcomes in PTB patients. It is recommended that these factors be incorporated into models designed to predict treatment efficacy in PTB patients (Table 4).
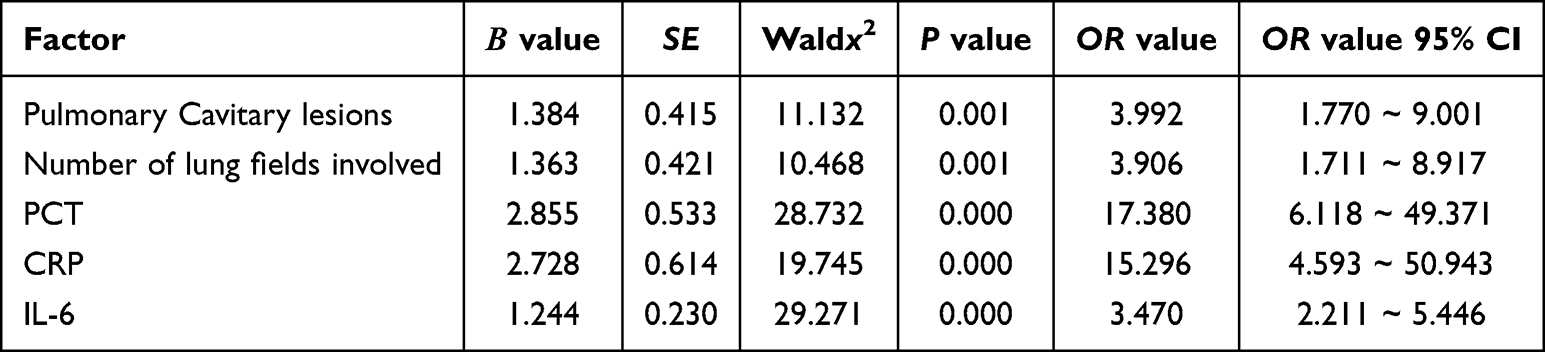 |
Table 4 Multifactorial Analysis of Factors Affecting the Early Treatment Effect in PTB Patients |
Nomograms and Calibration Curves for Predicting the Treatment Effect in PTB Patients
Based on the above results, a nomogram and a calibration curve were plotted. The nomogram model was internally validated using the Bootstrap resampling method (with 1,000 repetitions). The results showed that the model’s concordance index (C-index) was 0.896 (95% CI: 0.842–0.950), indicating a good ability to distinguish between effective and ineffective treatment in PTB patients. The Hosmer-Lemeshow goodness-of-fit test was further used to assess the model’s calibration. The results suggested no statistically significant difference between the predicted probabilities and the actual probabilities of treatment ineffectiveness, demonstrating good calibration of the nomogram model. The predicted risks were highly consistent with the actual clinical outcomes, further confirming the reliable predictive performance of the nomogram (Figures 1 and 2).
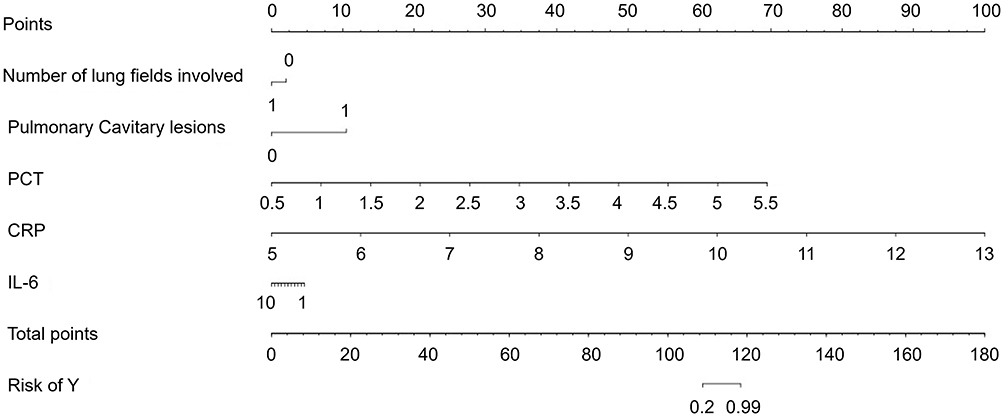 |
Figure 1 Nomogram for predicting the treatment effect in PTB patients. Abbreviations: PCT, Procalcitonin; CRP, C-reactive protein; IL-6, Interleukin-6. |
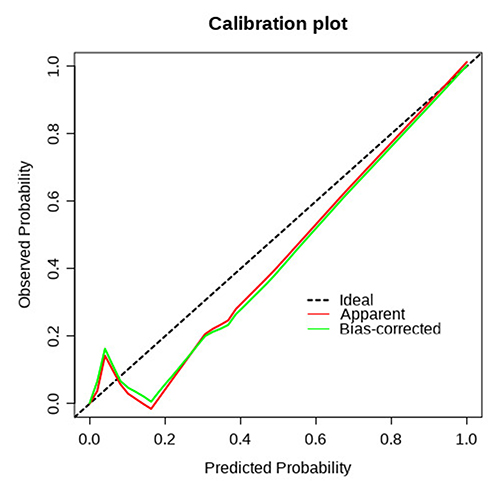 |
Figure 2 Calibration curve for predicting the treatment effect in PTB patients. |
ROC Analysis of Various Factors Predicting the Treatment Effect on PTB Patients
The AUC values for the number of lung fields involved, pulmonary cavitary lesions, and levels of PCT, CRP, and IL-6 were 0.666, 0.664, 0.934, 0.986, and 0.878, respectively, indicating their substantial utility in forecasting treatment outcomes in PTB patients (Table 5, Figure 3).
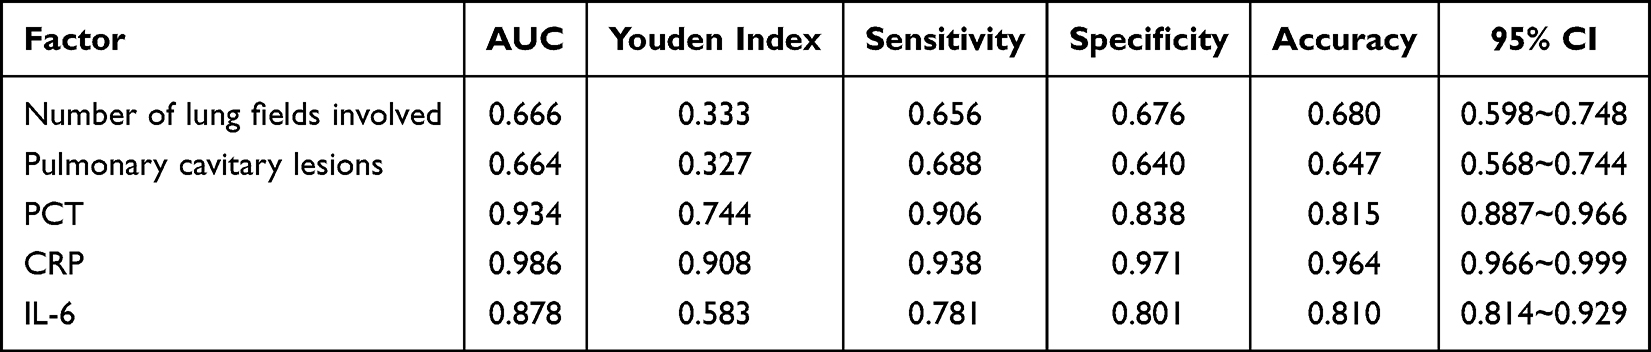 |
Table 5 ROC Analysis of Various Factors Predicting the Treatment Effect in PTB Patients |
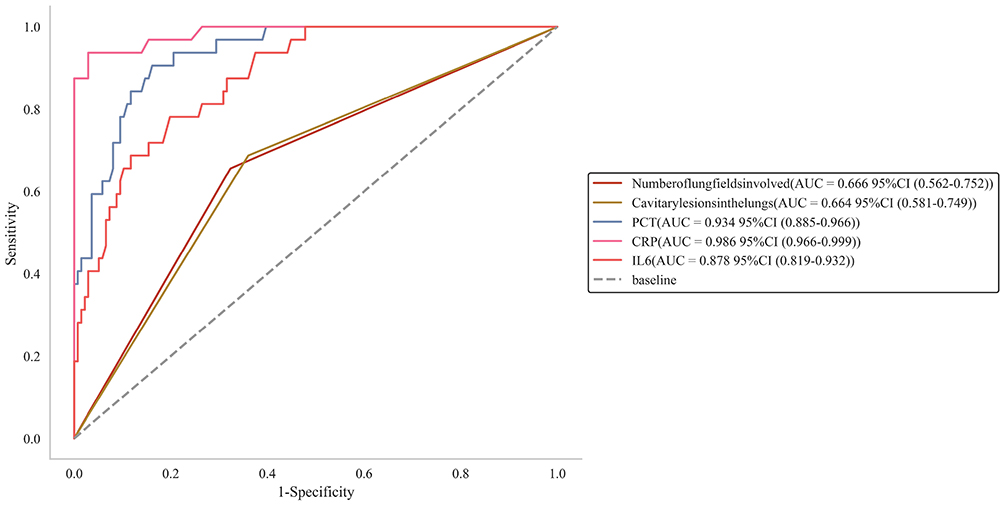 |
Figure 3 ROC analysis of various factors predicting the treatment effect in PTB patients. Abbreviations: PCT, Procalcitonin; CRP, C-reactive protein; IL-6, Interleukin-6. |
The Dynamic Changes in PCT and CRP Levels
On days 1, 5 and 7 after treatment, both PCT and CRP levels in the effective group were significantly lower than those in the ineffective group (all P < 0.001). Moreover, the extent of intergroup differences showed a pattern characterized by an “early peak followed by gradual attenuation”: the difference in PCT and CRP levels between the two groups reached its maximum on day 1 after treatment. Although statistically significant differences persisted on days 5 and 7, the magnitude of these differences decreased compared to that on day 1. The dynamic change trend suggests that inflammatory markers in the effective group declined rapidly during the early phase of treatment, whereas levels in the ineffective group remained elevated but did not show a continuous increase (Figure 4).
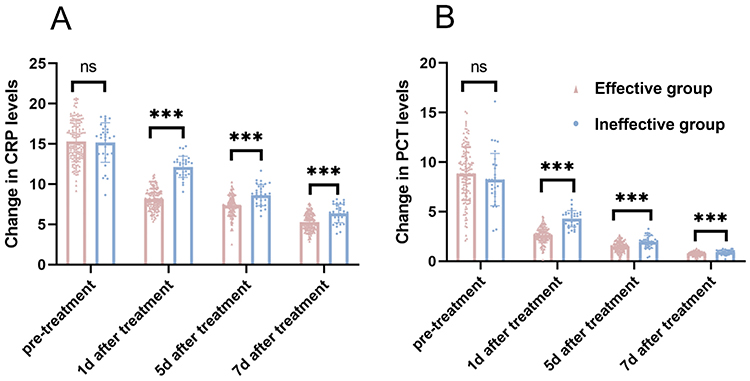 |
Figure 4 Comparison of dynamic changes in PCT and CRP levels at different time points. (A) is the changes in CRP levels; (B) is the changes in PCT levels). ns: not shown (baseline differences reported in Table 1); ***P<0.001 for post-treatment comparisons between groups. Abbreviations: PCT, Procalcitonin; CRP, C-reactive protein. |
The Correlation Between the Dynamic Changes in PCT and CRP Levels and the Absorption Area of Lesions in PTB Patients
A Pearson correlation model was conducted to examine the relationship between the dynamic changes of serum PCT and CRP levels in PTB patients and the area of lesion absorption. The findings indicate that the dynamic changes in serum PCT levels in both the ineffective and effective groups are negatively associated with the lesion absorption area (r = −0.49, −0.65, −0.31, −0.52, −0.63, −0.43, −0.64, −0.59, P < 0.05). Similarly, the dynamic changes in serum CRP levels in these groups are also negatively associated with the lesion absorption area (r = −0.70, −0.66, −0.52, −0.75, −0.67, −0.74, −0.49, −0.62, P < 0.05, Figures 5 and 6).
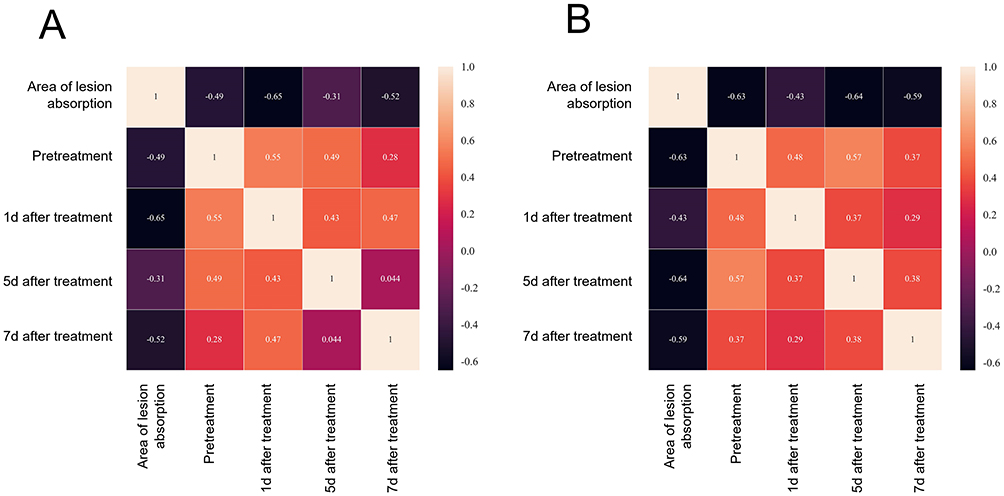 |
Figure 5 Correlation between the serum PCT dynamic changes and the absorption area of lesions (A) is the correlation between serum PCT dynamic changes and lesion absorption area in the ineffective group; (B) is the correlation between serum PCT dynamic changes and lesion absorption area in the effective group). Abbreviation: PCT, Procalcitonin. |
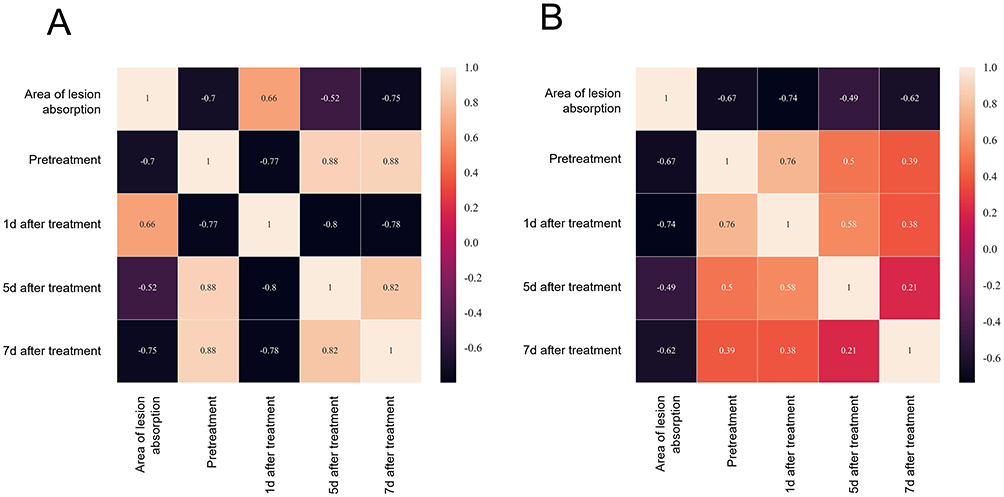 |
Figure 6 Correlation between dynamic changes in CRP level and lesion absorption area (A) is the correlation diagram between dynamic changes in CRP in the ineffective group and lesion absorption area; (B) is the correlation diagram between dynamic changes in CRP in the effective group and lesion absorption area). Abbreviation: CRP, C-reactive protein. |
Discussion
PTB lesions are located in the lungs, where damage caused by Mycobacterium tuberculosis, leads to significant impairment of the respiratory system and pulmonary function, subsequently resulting in pathological changes in lung tissue structure.14 If patients do not receive timely intervention, progression of the disease can lead to complications such as pulmonary, posing a serious threat to the patient’s life.15 Clinical study has shown that early diagnosis and treatment contribute to rapid control of bacterial replication and transmission, effectively reduce the risk of drug resistance, and improve the rates of sputum culture conversion and lesion reduction.16 Despite the clinical validation of early treatment efficacy, some patients still exhibit suboptimal response to initial therapy. This study included 168 PTB patients, of whom 136 (80.95%) were categorized into the responsive group, and 32 (19.05%) into the invalid group. These findings are consistent with previous clinical research. Therefore, when formulating an early treatment plan, it is essential to comprehensively consider influencing factors, monitor the treatment process, evaluate the early treatment response, and assist clinicians in promptly adjusting therapeutic strategies to improve treatment success rates and patient prognosis.
This study, through collinearity and logistic regression model analysis, identified the number of lung fields involved, pulmonary cavitary lesions and levels of PCT, CRP, and IL-6 as significant factors associated with suboptimal early treatment responses in PTB patients. A retrospective study17 further revealed that among elderly patients with pneumonia, the proportions of multiple underlying diseases, hypoproteinemia, and involvement of multiple lung lobes were significantly higher in the ineffective group. This suggests that the number of lung fields involved is greater in the ineffective group. The item “lung field” refers to the area of the lung, and a greater number of lung fields involved in patients with PTB indicates a more extensive range of lung lesions. Due to the extensive range of Mycobacterium tuberculosis infections, pharmacological interventions must exhibit both bactericidal and bacteriostatic effects across a broad area. However, the distribution of these drugs may not be uniform within extensive lesion areas, potentially resulting in the incomplete clearance of some bacterial populations. Furthermore, the involvement of larger lung fields indicates significant impairment of pulmonary function, thereby diminishing the patient’s respiratory capacity and disrupting physiological processes such as oxygen exchange, which adversely affects the efficacy of early treatment.18,19 Pulmonary cavities represent a particularly severe form of pathological alteration in PTB. The structural characteristics of the cavity wall and the pathological changes in the surrounding tissues may influence the distribution and penetration of anti-tuberculosis medications within the lesion. Drugs have difficulty fully reaching the interior of the cavity, making it impossible to effectively kill the tubercle bacilli inside the cavity and affecting the effectiveness of treatment. Pulmonary cavitary lesions can also trigger stronger and more complex immune responses. Excessive inflammatory responses may lead to tissue damage, which is not conducive to the repair and healing of lesions and thus delays the improvement of the condition in the early stage of treatment.20 The dynamic changes of PCT and CRP in tuberculous inflammatory responses carry distinct biological significance, which also forms the core of their predictive value. As a pro-hormone without hormonal activity, PCT maintains very low serum levels under normal physiological conditions, yet its synthesis increases rapidly and correlates with the severity of infection in systemic inflammation induced by bacterial infections. Although Mycobacterium tuberculosis is not a typical bacterium, the necrosis and liquefaction processes of pulmonary lesions in PTB patients may be accompanied by localized bacterial-like inflammatory reactions or secondary bacterial infections, leading to elevated PCT levels. CRP, as an acute-phase protein synthesized by the liver, rises rapidly and is highly sensitive to inflammation, allowing it to increase promptly following immune activation triggered by tuberculosis infection. Unlike PCT, CRP lacks bacterial specificity but can reflect the overall improvement of inflammatory status during PTB treatment. IL-6, as a key pro-inflammatory cytokine in the immune responses, plays a dual role in the pathological progression of PTB. IL-6 activates T and B lymphocytes, promotes antibody and inflammatory cytokine secretion, and participates in the host defense against Mycobacterium tuberculosis. However, if the infection is not effectively controlled, persistently activated inflammatory responses can lead to sustained high expression of IL-6. This induces excessive infiltration of inflammatory cells into lung tissue, exacerbates parenchymal damage, impairs lesion repair, and adversely affects early clinical treatment outcomes in PTB patients.21,22
The construction of the nomogram and calibration curve in this study revealed that the number of lung fields involved, pulmonary cavitary lesions, and the levels of PCT, CRP, and IL-6 have predictive significance for the treatment outcome in PTB patients, although the predictive efficacy of each indicator varies. The ROC analysis showed that the AUC values for the number of lung fields involved and pulmonary cavitary lesions were 0.666 and 0.664, respectively, indicating moderate predictive value. In contrast, the AUC values for PCT (AUC=0.934), CRP (AUC=0.986), and IL-6 (AUC=0.878) were all greater than 0.8. Among these, PCT and CRP demonstrated significantly higher sensitivity (0.906 and 0.938, respectively) and specificity (0.838 and 0.971, respectively), showcasing strong predictive performance. Furthermore, the dynamic changes in PCT and CRP levels were associated with the treatment efficacy in PTB patients. The nomogram, as a visualized tool for predicting and evaluating the risk of clinical events, is widely applied in medical research. By utilizing a nomogram to evaluate the risk of early treatment outcomes in PTB patients, multiple independent risk factors can be integrated into a graphical model, helping clinicians and researchers better understand the patient’s treatment status.23 The ROC curve is a graphical tool for evaluating the performance of classification models. It illustrates the predictive performance of each indicator in assessing early treatment outcomes in PTB patients, with the AUC value calculated to assess the accuracy of the predictive model. The results showed that PCT and CRP have higher predictive value.24 As inflammatory markers, the roles of PCT and CRP in assessing early responses to PTB have gained increasing attention. Previous study25 has suggested that persistently elevated CRP levels without a significant decrease in PCT levels may indicate uncontrolled infection or secondary bacterial infection. PCT has high specificity for bacterial infections, particularly in severe bacterial infections and sepsis, where its level rises significantly. In contrast, CRP is more sensitive to inflammatory responses, increasing not only in bacterial infections but also in non-bacterial infectious inflammatory conditions such as viral infections and autoimmune diseases, although the degree of elevation is typically less pronounced than in bacterial infections. In PTB patients, although Mycobacterium tuberculosis is not a typical bacterial infectious pathogen, PCT and CRP levels may still change during disease progression due to the activation of the host immune response and potential secondary bacterial infections.26
Research has found27 that during the early stages of PTB treatment, PCT and CRP levels exhibit different dynamic trends, which are closely related to the treatment response. In patients who respond effectively to treatment, as anti-tuberculosis therapy progresses, the inflammatory reaction gradually comes under control. CRP levels typically begin to decline within the first week of treatment, reflecting an overall improvement in the inflammatory state. This reduction occurs as anti-tuberculosis drugs inhibit the growth and reproduction of Mycobacterium tuberculosis, decreasing bacteria stimulation of the immune system and thereby reducing CRP synthesis in the liver.28 Meanwhile, PCT levels usually remain relatively low in the early stages of PTB treatment. A sudden increase in PTB during treatment may indicate co-infection with other bacteria, serving as an important early warning sign for timely clinical detection and management of complications.29 If PCT and CRP levels remain persistently elevated or fail to decline significantly during early treatment, it may suggest the need to reassess the treatment regimen and adjust therapeutic strategies to improve clinical outcomes. Therefore, the dynamic changes of PCT and CRP hold important predictive value in evaluating early treatment responses in PTB patients. They provide timely and effective information to clinicians, aiding in the formulation of precise treatment decisions, optimizing treatment processes, and improving the success rate of PTB treatment as well as patients’ quality of life.30,31
The innovation of this study lies in clarifying the predictive value of dynamic monitoring of PCT and CRP through a large-sample retrospective analysis, addressing the research gap in early assessment time windows; constructing a nomogram model that incorporates PCT, CRP, and lesion characteristics, with calibration curves demonstrating good predictive consistency, providing a visual assessment tool for clinical practice; and confirming the quantitative association between dynamic changes in PCT and CRP and lesion absorption area, offering objective, quantifiable evidence for evaluating treatment efficacy. Although this study has achieved certain results, it still has some limitations. This retrospective cohort design inherently carries unmeasured confounding factors, which may influence the accuracy of the predictive model and the interpretation of the relationship between biomarkers and treatment outcomes. Additionally, the study sample only included patients from a specific medical institution, which may not fully represent broader population characteristics, thereby affecting the generalizability and external validity of the findings. Furthermore, PCT and CRP levels may be influenced by other factors, and these should be considered when interpreting the results. The value of frequent and long-term dynamic monitoring also requires further exploration. Future clinical studies should involve larger-scale, multicenter research to explore the roles of PCT and CRP in the pathogenesis of PTB and their interactions with the immune system. Combining these biomarkers with other cytokines, chemokines, and novel biomarkers may help establish a more comprehensive and accurate evaluation system for PTB treatment efficacy.
Conclusion
In summary, the number of lung fields involved, the presence of pulmonary cavitary lesions, and the levels of PCT, CRP, and IL-6 are significantly associated with early treatment outcomes in PTB patients, all serving as important indicators for predicting early treatment responses. Among these, the dynamic changes in PCT and CRP demonstrate high predictive value, providing timely and objective reflections of treatment response. They offer a reliable reference for clinical evaluation of treatment efficacy and optimization of therapeutic strategies.
Data Sharing Statement
Data is available from the corresponding author in reasonable request.
Disclosure Statement
The authors declare that they have no competing interests in this work.
References
1. Tao Y, Zhao J, Cui H, Liu L, He L. Exploring the impact of socioeconomic and natural factors on pulmonary tuberculosis incidence in China (2013–2019) using explainable machine learning: a nationwide study. Acta Trop. 2024;253:107176. doi:10.1016/j.actatropica.2024.107176
2. Pando C, Hazel A, Tsang LY, et al. A social network analysis model approach to understand tuberculosis transmission in remote rural Madagascar. BMC Public Health. 2023;23(1):1511. doi:10.1186/s12889-023-16425-w
3. Jackson S, Kabir Z, Comiskey C. Effects of migration on tuberculosis epidemiological indicators in low and medium tuberculosis incidence countries: a systematic review. J Clin Tuberc Other Mycobact Dis. 2021;23:100225. doi:10.1016/j.jctube.2021.100225
4. Xiang ZB, Leng EL, Cao WF, et al. A systematic review and meta-analysis of the diagnostic accuracy of metagenomic next-generation sequencing for diagnosing tuberculous meningitis. Front Immunol. 2023;14:1223675. doi:10.3389/fimmu.2023.1223675
5. Liu Q, Ji Y, Martinez L, et al. Combined tests with Xpert MTB/RIF assay with bronchoalveolar lavage fluid increasing the diagnostic performance of smear-negative pulmonary tuberculosis in Eastern China. Epidemiol Infect. 2020;149:e5. doi:10.1017/S095026882000309X
6. Black S, Kushner I, Samols D. C-reactive Protein. J Biol Chem. 2004;279(47):48487–14. doi:10.1074/jbc.R400025200
7. Sato H, Ito S, Nakazono K, et al. False-positive semiquantitative immunochromatography assays for procalcitonin in three patients with rheumatoid arthritis-A case series. Clin Case Rep. 2020;8(9):1704–1707. doi:10.1002/ccr3.2968
8. Zhang Y, Cui B, Yang H, et al. Morphological feature and mapping inflammation in classified carotid plaques in symptomatic and asymptomatic patients: a hybrid 18F-FDG PET/MR study. Front Neurosci. 2023;17:1144248. doi:10.3389/fnins.2023.1144248
9. Cilliers K, Menezes A, Webber T, et al. Mycobacterium tuberculosis-stimulated whole blood culture to detect host biosignatures for tuberculosis treatment response. Tuberculosis. 2021;128:102082. doi:10.1016/j.tube.2021.102082
10. Zhao R, Wang C, Li F, Zeng Z, Hu Y, Dong X. Elevated level of multibranched complex glycan reveals an allergic tolerance status. Clin Proteomics. 2024;21(1):40. doi:10.1186/s12014-024-09491-8
11. Russo A, Venditti M, Ceccarelli G, Mastroianni CM, d’Ettorre G. Procalcitonin in daily clinical practice: an evergreen tool also during a pandemic. Intern Emerg Med. 2021;16(3):541–543. doi:10.1007/s11739-021-02659-2
12. Christof C, Nussbaumer-Streit B, Gartlehner G. WHO guidelines on tuberculosis infection prevention and control. Gesundheitswesen. 2020;82(11):885–889. doi:10.1055/a-1241-4321. WHO-Leitlinie: Pravention und Kontrolle von Tuberkulose-Infektionen.
13. Hwang H, Choi SM, Lee J, et al. Validation of age, PaO2/FlO2 and plateau pressure score in Korean patients with acute respiratory distress syndrome: a retrospective cohort study. Respir Res. 2020;21(1):94. doi:10.1186/s12931-020-01357-5
14. Yu Z, Shang Z, Huang Q, Wen F, Patil S. Integrating systemic immune-inflammation index, fibrinogen, and T-SPOT.TB for precision distinction of active pulmonary tuberculosis in the era of mycobacterial disease research. Front Microbiol. 2024;15:1382665. doi:10.3389/fmicb.2024.1382665
15. Villa S, Riccardi N, Canetti D, et al. From the past, a long way to future challenges for a greater control of tuberculosis. Tuberculosis. 2020;123:101948. doi:10.1016/j.tube.2020.101948
16. Iruedo JO, Pather MK. Time-to-treatment initiation in a decentralised community-care model of drug-resistant tuberculosis management in the OR Tambo district municipality of South Africa. Int J Environ Res Public Health. 2023;20(14):6423. doi:10.3390/ijerph20146423
17. Zhang L, Han X, Ge Q, et al. Treatment outcomes of retreated patients with isoniazid/rifampicin resistant pulmonary tuberculosis. BMC Infect Dis. 2024;24(1):7. doi:10.1186/s12879-023-08909-2
18. Ma J-B, Zeng L-C, Ren F, et al. Development and validation of a prediction model for unsuccessful treatment outcomes in patients with multi-drug resistance tuberculosis. BMC Infect Dis. 2023;23(1):289. doi:10.1186/s12879-023-08193-0
19. Lu C, Xu Y, Li X, et al. Nutritional status affects immune function and exacerbates the severity of pulmonary tuberculosis. Front Immunol. 2024;15:1407813. doi:10.3389/fimmu.2024.1407813
20. Mohammadnabi N, Shamseddin J, Emadi M, et al. Mycobacterium tuberculosis: the mechanism of pathogenicity, immune responses, and diagnostic challenges. J Clin Lab Anal. 2024;38(23):e25122. doi:10.1002/jcla.25122
21. Leboueny M, Maloupazoa Siawaya AC, Bouanga LDJ, Mvoundza Ndjindji O, Mveang Nzoghe A, Djoba Siawaya JF. Changes of C-reactive protein and procalcitonin after four weeks of treatment in patients with pulmonary TB. J Clin Tuberc Other Mycobact Dis. 2023;31:100348. doi:10.1016/j.jctube.2023.100348
22. Luo P, Long Y, Ma L, Tao Y, Gou S. The sustained and marked elevation of serum procalcitonin in a hemodialysis patient with tuberculous lymphadenitis, but without the evidence of sepsis: a case report. Infect Drug Resist. 2022;15:5161–5166. doi:10.2147/IDR.S378894
23. Lei H, Tao D, Zhang N, et al. Nomogram prediction for the risk of venous thromboembolism in patients with lung cancer. Cancer Cell Int. 2023;23(1):40. doi:10.1186/s12935-023-02882-1
24. Wu D, Zhang H, Huang H, et al. Establishment of a prognostic signature for patients with advanced lung squamous cell carcinoma based on tumor-infiltrating immune cells. Transl Cancer Res. 2023;12(10):2706–2716. doi:10.21037/tcr-23-545
25. Yang R, Guan X, Niu Z, et al. Establishment of sex-specific predictive models for critical illness in Chinese people with the Omicron variant. Front Microbiol. 2024;14:1224132. doi:10.3389/fmicb.2023.1224132
26. Abdelkader A, Abdelkhalek R, Hosny H, Emara MH, Elshamy M. Bacterial infections and fever after hepatocellular carcinoma ablation therapy: predictive role of procalcitonin. Clin Exp Hepatol. 2023;9(2):122–128. doi:10.5114/ceh.2023.127400
27. Stefanescu S, Cocos R, Turcu-Stiolica A, et al. Prediction of treatment outcome with inflammatory biomarkers after 2 months of therapy in pulmonary tuberculosis patients: preliminary results. Pathogens. 2021;10(7):789. doi:10.3390/pathogens10070789
28. Travlos A, Bakakos A, Vlachos KF, Rovina N, Koulouris N, Bakakos P. C-reactive protein as a predictor of survival and length of hospital stay in community-acquired pneumonia. J Pers Med. 2022;12(10):1710. doi:10.3390/jpm12101710
29. Lee H, Kim I, Kang BH, Um SJ. Prognostic value of serial neutrophil-to-lymphocyte ratio measurements in hospitalized community-acquired pneumonia. PLoS One. 2021;16(4):e0250067. doi:10.1371/journal.pone.0250067
30. Thu VTA, Dat LD, Jayanti RP, et al. Advancing personalized medicine for tuberculosis through the application of immune profiling. Front Cell Infect Microbiol. 2023;13:1108155. doi:10.3389/fcimb.2023.1108155
31. Gadoev J, Asadov D, Harries AD, et al. Factors associated with unfavourable treatment outcomes in patients with tuberculosis: a 16-year Cohort study (2005-2020), Republic of Karakalpakstan, Uzbekistan. Int J Environ Res Public Health. 2021;18(23):12827. doi:10.3390/ijerph182312827
 © 2026 The Author(s). This work is published and licensed by Dove Medical Press Limited. The
full terms of this license are available at https://www.dovepress.com/terms
and incorporate the Creative Commons Attribution
- Non Commercial (unported, 4.0) License.
By accessing the work you hereby accept the Terms. Non-commercial uses of the work are permitted
without any further permission from Dove Medical Press Limited, provided the work is properly
attributed. For permission for commercial use of this work, please see paragraphs 4.2 and 5 of our Terms.
© 2026 The Author(s). This work is published and licensed by Dove Medical Press Limited. The
full terms of this license are available at https://www.dovepress.com/terms
and incorporate the Creative Commons Attribution
- Non Commercial (unported, 4.0) License.
By accessing the work you hereby accept the Terms. Non-commercial uses of the work are permitted
without any further permission from Dove Medical Press Limited, provided the work is properly
attributed. For permission for commercial use of this work, please see paragraphs 4.2 and 5 of our Terms.