")
Back to Journals » International Journal of Nanomedicine » Volume 18
The Potential of Novel Synthesized Carbon Dots Derived Resveratrol Using One-Pot Green Method in Accelerating in vivo Wound Healing
Authors Cheng H, Zhao Y, Wang Y, Hou Y, Zhang R, Zong M, Sun L, Liu Y, Qi J, Wu X, Li B
Received 5 August 2023
Accepted for publication 9 November 2023
Published 18 November 2023 Volume 2023:18 Pages 6813—6828
DOI https://doi.org/10.2147/IJN.S434071
Checked for plagiarism Yes
Review by Single anonymous peer review
Peer reviewer comments 2
Editor who approved publication: Dr Yan Shen
Huaiyi Cheng,* Yifan Zhao,* Yue Wang,* Yuxi Hou, Ran Zhang, Mingrui Zong, Lingxiang Sun, Yingyu Liu, Jin Qi, Xiuping Wu, Bing Li
School and Hospital of Stomatology, Shanxi Medical University, Shanxi Province Key Laboratory of Oral Diseases Prevention and New Materials, Shanxi Medical University, Taiyuan, 030001, People’s Republic of China
*These authors contributed equally to this work
Correspondence: Bing Li; Xiuping Wu, Email [email protected]; [email protected]
Background: Carbon dots (CDs), a novel nanomaterial, have gained significant attention over the past decade due to their remarkable fluorescence properties, low toxicity, and biocompatibility. These characteristics make them promising in various applications, especially in biomedicine. However, most CDs are currently synthesized using chemical materials, and their biocompatibility falls short of natural compounds. Research on extracting CDs from natural sources is limited, and their potential in biomedicine remains largely unexplored.
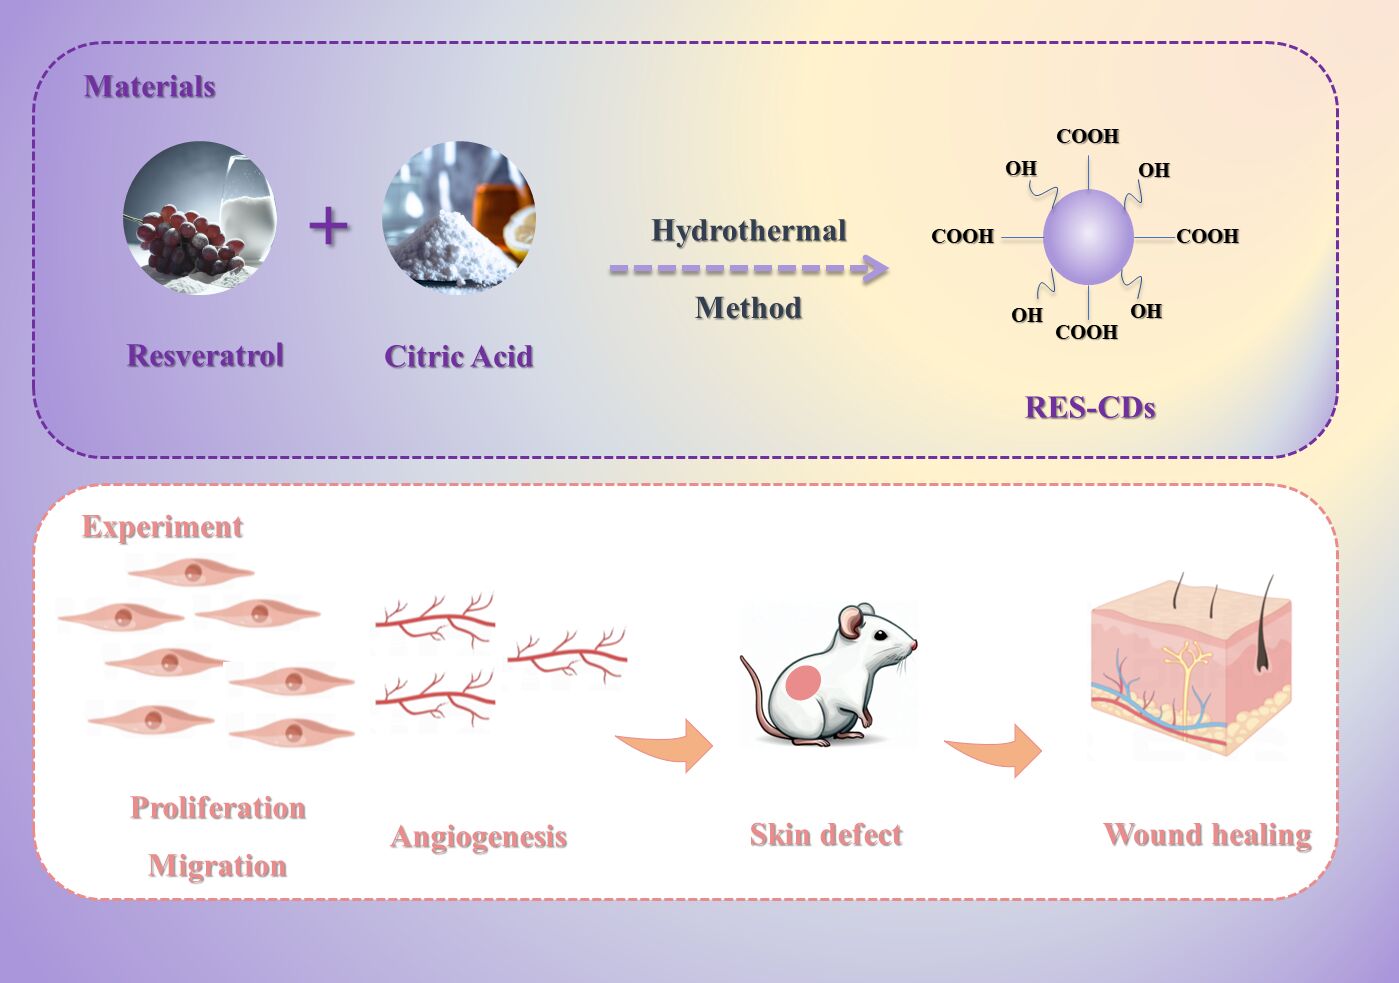
Methods: We extracted CDs from resveratrol, a natural plant compound, and enhanced their water solubility using citric acid. Characterization of resveratrol-based carbon dots (RES-CDs) was carried out using various techniques, including UV-Vis, SEM, TEM, FTIR, XRD, and fluorescence spectroscopy. Extensive biocompatibility tests, wound healing assays, cell migration studies, and angiogenesis experiments were conducted using human umbilical vein endothelial cells (HUVEC). In addition, we investigated the biocompatibility and wound healing potential of RES-CDs in an in vivo rat model of inflammation.
Results: RES-CDs exhibited stable yellow-green fluorescence under 365-nanometer ultraviolet light and demonstrated excellent biocompatibility. In wound healing experiments, RES-CDs outperformed resveratrol in terms of cell scratch healing, migration, and tube formation. In a rat skin defect model, RES-CDs promoted wound healing and stimulated the formation of blood vessels and tissue regeneration near the wound site, as evidenced by increased CD31 and VEGF expression.
Conclusion: Resveratrol-derived CDs with enhanced water solubility show superior performance in tissue healing compared to resveratrol. This discovery opens new possibilities for the clinical application of resveratrol-based carbon dots.
Keywords: carbon dots, wound healing, resveratrol, fluorescence, bio-imaging, biocompatibility
Graphical Abstract:
Introduction
Nanomaterials are a special class of materials with sizes ranging from 1 to 100 nanometers.1 Compared to traditional materials, nanomaterials exhibit significantly increased surface area-to-volume ratio,2,3 leading to unique physical, chemical, and biological properties. These properties make nanomaterials promising for a wide range of applications in the fields of biology and medicine. Firstly, nanomaterials play a crucial role in biomedical imaging.4 By modifying their surface structures and functionalizing them, nanomaterials can interact effectively with cells, tissues, and other biological entities, applying in medical diagnosis and treatment. For instance, gold nanoparticles can be used for early diagnosis and treatment of cancer,5 while magnetic nanoparticles have demonstrated potential applications in the field of nuclear magnetic resonance imaging (MRI).6,7 Moreover, the optical, magnetic, acoustic, and photoacoustic properties of nanomaterials8–10 offer novel avenues for bioimaging. Secondly, nanomaterials hold great potential in drug delivery. Drug delivery involves transporting drugs to target sites within the body. In addition, nanomaterials have extensive applications in tissue engineering and regenerative medicine. Combining cells with nanomaterials can promote cell growth, differentiation, and regeneration, thus facilitating tissue engineering and regenerative medicine goals. For instance, nanomaterials can be used to enhance bone and neural regeneration.11,12 Nanomaterials offer vast opportunities for applications in biology and medicine. However, there are also challenges associated with their use in medical applications and bioimaging. For example, nanomaterials may exhibit toxicity or adverse effects on the human body or cells, necessitating strict evaluation of their toxicity and biocompatibility. Accumulation of nanomaterials within the body may impact organ functions and potentially release harmful toxins or byproducts. In bioimaging, although nanomaterials can improve imaging resolution and sensitivity, their performance can be limited by factors such as background interference and optical drift. Furthermore, the cost and requirements for specialized equipment and techniques in the fabrication of nanomaterials can restrict their widespread application. Ensuring consistency in the preparation and properties of nanomaterials is also important to ensure their reproducibility and stability.
Carbon dots (CDs), with a diameter of approximately 10 nanometers, are microsphere particles that have gained extensive research attention over the past decade due to their exceptional stability,13–15 fluorescence properties,16–18 tunability,19,20 and biocompatibility.21,22 They find wide-ranging applications in the field of biomedicine, including bioimaging, drug delivery, photodynamic and photothermal therapies, electrocatalysis, and photocatalysis.23–25 CDs fluorescence imaging is a non-invasive, highly sensitive, and high-resolution bioimaging technique suitable for microscopy of cells and biological entities. Its applications encompass drug molecule tracking, cellular molecular imaging, tumor diagnosis, and treatment, among others. Carbon dots exhibit high fluorescence quantum yields and stability, offering enhanced imaging signal intensity and prolonged imaging time window. Moreover, their small size and large surface area make them highly responsive to biological molecules, thereby improving imaging sensitivity. The methods for CDs synthesis can be categorized as top-down and bottom-up approaches. The bottom-up methods are relatively straightforward, do not necessitate special reagents, and utilize natural carbon sources, making them particularly attractive to researchers, especially in the context of the green chemistry movement.
Resveratrol (RES), also known as 3.4’,5-trihydroxystilbene, is an endogenous polyphenolic compound of non-flavonoid origin. It is a colorless needle-shaped crystal that is insoluble in water but soluble in ether, chloroform, and alcohol solvents. Resveratrol is found in various natural plants such as grapes, Polygonum cuspidatum, peanuts, and fruit seeds.26 Currently, plant extracts containing resveratrol are mainly used for their anti-inflammatory, antioxidant, anticancer, and angiogenesis-promoting properties. However, certain characteristics of resveratrol, such as poor water solubility,27 low oral bioavailability, and limited absorption in the body,28 restrict its application in the body. To improve the drug’s utilization, there is an urgent need to find approaches to enhance its physical properties and biocompatibility. Examples include resveratrol nanoencapsulation in lipid nanocarriers.29 However, most of these methods involve complex procedures and do not allow for easy tracking of its metabolism.
When confronted with infectious agents such as bacteria and viruses, the skin serves as the primary mechanical barrier in the defense against infections,30 playing a crucial role. For instance, it maintains an unfavorable pH level for the proliferation of bacteria and other substances over a prolonged period, and the secretions of sebum, sweat, and keratinocytes.31 These substances contain antimicrobial peptides, enzymes, and other components with antimicrobial activity, capable of inhibiting the growth and dissemination of pathogenic microorganisms. Wound, characterized by the impairment of biological integrity including skin and mucous membranes, has become a prominent subject of medical research. The management of wounds typically involves hemostasis, inflammation reduction, promotion of tissue cell proliferation, and tissue remodeling.32 Regarding the promotion of tissue cell proliferation, commonly employed materials include fibrous proteins and biological collagen. However, challenges remain in terms of their biocompatibility and specific metabolic properties. Carbon-based nanocomposite materials, widely available in the market, have demonstrated excellent biocompatibility, antimicrobial performance, and cell adhesion properties, making the increasingly utilized in the treatment of various types of wounds.
For resveratrol, there have been reports of its use in wound healing with good results. However, its poor water solubility limits its metabolism in the body and makes it challenging to observe tissue healing at a microscopic level in real-time. On the other hand, most CDs have excellent polarity and unique tracking properties. Therefore, we attempted to extract CDs using resveratrol, hoping to combine the wound healing-promoting properties of resveratrol with the excellent metabolic and fluorescent characteristics of CDS.
Subsequently, the cellular uptake of carbon dots in different cells was investigated, followed by conducting wound-related experiments such as cell scratch assay, transwell assay, angiogenesis assay, and immunofluorescence. These experiments evaluated the tissue healing-promoting ability of the CDs, aiming to explore the potential application of this material in the field of wound repair and tracking.
Materials and Methods
Materials
Resveratrol and citric acid were purchased from Shanghai Macklin Reagent Company; DMEM culture medium, Fetal bovine serum (FBS) was purchased from ThermoFisher Scientific (Gibco, USA); Penicillin-Streptomycin-Gentamicin Solution (100×); CCK-8 cell viability assay kit and DAPI staining solution were purchased from Solarbio (Beijing China); AM/PI cell viability staining kit was purchased from Bestbio (Nanjing China); phalloidin staining solution was purchased from Cytoskeleton (USA); and a 1000kDa molecular weight dialysis bag was purchased from Biovake (USA). Mouse preosteoblast cell line (MC3T3-E1 Subclone 4) were purchased from the Cell Bank of the Chinese Academy of Sciences. Human umbilical vein endothelial cells (HUVECs) were sourced from Starfish Bio (Suzhou, China).
Preparation and Physicochemical Characterization of CDs
Resveratrol carbon dots (RES-CDs) were synthesized through a hydrothermal method using a combination of a high-pressure reaction vessel and a heating furnace. Specifically, 1 g of citric acid and 0.5 g of resveratrol were dissolved in 20 mL of deionized water and stirred vigorously. The resulting solution was heated at 180°C for 10 h in a high-pressure vessel lined with polytetrafluoroethylene. After cooling the solution to 20°C, the precipitate was removed by centrifugation at 12,000 rpm, and the liquid portion was collected. Next, the centrifuged solution of CDs was transferred into a dialysis bag with a molecular weight cutoff of 1000 (MWCO=1000) and immersed in a 2-liter beaker filled with deionized water for dialysis. The water was refreshed every 8 hours. The resulting CDs were freeze-dried to obtain a powder for subsequent studies. The absorption peaks of the CDs were identified using UV-vis spectroscopy, and the fluorescence properties of the material were characterized using a fluorescence spectrophotometer and UV-vis absorption spectrophotometer. The chemical elements, functional groups, and composition of the CDs’ surface were characterized using Fourier transform infrared spectroscopy (FT-IR) and X-ray photoelectron spectroscopy (XPS), respectively. Transmission electron microscopy (TEM) was used to observe the morphology and structure of the purified CDs. X-ray diffraction (XRD) was utilized for the characterization of the crystallographic properties of the CDs. Zeta testing was conducted to assess the surface charge, stability, and aggregation tendency of CDs, which provides valuable information on their electrostatic forces, solution stability, and dispersion characteristics.
Characterization of the Stability of Resveratrol CDs
Fluorescence spectroscopy was employed to investigate the fluorescence intensity of CDs under various conditions, thereby evaluating the fluorescence stability of CDs. Different pH acid and alkaline solutions were prepared using deionized water, and CDs powder was dissolved in each solution to obtain solutions with consistent concentrations. Specifically, solutions with pH ranging from 1 to 10 were prepared, each containing 2 mL. The CDs powder was individually dissolved in each solution, resulting in a CDs’ concentration of 1000 μg/mL in each tube. The solutions were allowed to stand for 10 minutes to ensure sufficient reaction. Subsequently, the fluorescence peak and intensity variations of the CDs solutions were observed under a fluorescence spectrometer with excitation light at 372 nm.
Calculation of the Relative Fluorescence Quantum Yield of CDs (QY)
0.56 quinine sulfate (0.1mol/l of H2SO4) is used as a standard reference for fluorescence emission, and the formula for fluorescence quantum yield can be referred to as follows:

Here, ɸx represents the fluorescence quantum yield of the CDs, ɸst represents the quantum yield of a reference fluorescence standard, Ix and Ist denote the fluorescent signals of the CDs and reference standard, respectively, Ƞ2x and Ƞ2st represent the photobleaching factors of the sample and reference standard, and Ast and Ax denote the absorbances of the reference standard and CDs, respectively.
Internalization and Biocompatibility of CDs
CCK-8 Assay
To assess the influence of CDs on cell growth, we assessed the biocompatibility of the CDs using a CCK-8 assay. MC3T3 cells and HUVEC cells were seeded in a 96-well plate at a density of 7×10³ cells per well and 5×10⁴ cells per well, respectively. After 24 hours of cell adhesion, different concentrations of CDs were added, with a concentration of 0 μg/mL serving as the blank control group, and concentrations of 50, 100, 200, and 400 μg/mL serving as experimental groups, with 5 replicates per group. After incubation for 1, 3, and 5 days in a cell incubator, the 96-well plate was removed, the culture medium was discarded, and the wells were rinsed with PBS. Subsequently, 100 μL of basal culture medium was added to each well, followed by the addition of a certain amount of CCK-8 reagent, resulting in a final concentration of 10% CCK-8 in each well, and after a few hours, the 96-well plate was taken out, and the absorbance values of each well were measured at a wavelength of 450 nm using a microplate reader. The cell proliferation rate was calculated by comparing the OD values of the experimental groups with the control group using the formula:
Cell proliferation ratio = (Experimental group OD value / Control group OD value) × 100%.
EDU Assay
HUVEC cells were seeded in a 24-well plate at a density of 1×10⁴ cells per well, respectively. The culture medium consisted of DMEM containing different concentrations of CDs (50, 100, 200, and 400 μg mL⁻¹) and an equal volume of EDU working solution was added for co-cultivation for 4 hours.33 The procedure involved fixing cells with 4% paraformaldehyde and subsequently permeabilizing them using 0.1% Triton-100, and an appropriate amount of reaction solution was added.34 The slides were sealed with an anti-fade mounting medium containing DAPI, and microscopic images capturing the proliferation of CDs were acquired using laser confocal microscopy.
Live-Dead Staining
At the same cell density as the EDU experiment mentioned above, the cells were seeded in the plates. The culture medium consisted of DMEM containing different concentrations of CDs and cells were cultured for 1, 3, or 5 days. The liquid portion was removed, and the cells were washed with PBS, followed by staining with AM live cell dye for 30 minutes at 37°C in a cell incubator. The liquid portion was discarded, and the cells were washed with PBS before observing cell viability under a fluorescence inverted microscope.
Hemolysis Assay of CDs
Collection of fresh blood was obtained from SD rats through a 1 mL syringe via the tail vein. The blood was collected in anticoagulant tubes containing EDTA or sodium citrate and mixed gently. After centrifugation at 3000 rpm for 15 minutes, the blood cells were obtained. Different concentrations of CDs solution (50, 100, 200, and 400 μg mL⁻¹) were prepared. Each 1 mL of the nanomaterial solution was mixed with 1 mL of PBS solution, 1mL deionized water and 20 μL of the blood cells were added and thoroughly mixed. The samples were kept at a temperature of 37°C for 4 hours and then subjected to centrifugation at 3000 rpm for 15 minutes. Then they were arranged on the same horizontal line, and the hemolysis phenomenon was captured using a camera. After taking the photographs, we collected the supernatant and placed it in a 96-well plate. We measured the absorbance at 542 nm to calculate the hemolysis rate of the material, using the following formula:

Here, the sample group contains various concentrations of CDs solutions, the negative group contains PBS solution, and the positive group contains deionized water.
Biocompatibility Testing in vivo
All animal experimental studies were approved by the Animal Ethics Committee of Shanxi Medical University (Taiyuan, China). In order to evaluate the in vivo biocompatibility of CDs, we selected 10 male SD rats aged 6–8 weeks, divided into groups of 5 rats each. Physiological saline and CDs solution were injected into the tail vein of the rats every two days. On the 7th day, all rats were euthanized, and their hearts, livers, spleens, lungs, and kidneys were collected for dehydration, embedding, sectioning, and HE staining. The organs of the rats were observed under the microscope.
FL Imaging of CDs in vitro
The logarithmic growth phase of MC3T3 cells and HUVEC cells was collected, and 1 × 10⁵ cells were seeded in a 24-well plate containing coverslips, respectively. After a 24-hour incubation, the medium was discarded and replaced with 200 µg mL⁻¹ CD-containing medium; cells were incubated in the dark for 12 hours. The solution was discarded, and cells were washed three times with PBS. The cells were fixed with 10% formaldehyde (1 mL) for 15 minutes, the fixative was removed, and cells were washed with PBS. Cells were then incubated with phalloidin dye for 1 hour, the liquid portion was discarded, and the culture medium was washed with PBS solution. Followed by staining with DAPI dye for 30 minutes. The dye was then discarded. Finally, Cellular fluorescence imaging properties were examined using a confocal microscope, employing an excitation wavelength of 488 nm.
Wound Healing Experiments in vitro and Vivo
Assay for Assessing Angiogenic Potential
Add 150 μL of Matrigel (Biosciences, USA) to each well of a 96-well plate and let it stand for 30 minutes. Then, add 3×10³ HUVEC cells to each well and treat with different concentrations of CDs solution (0, 50, 100, 200, 400 μg/mL). Incubate the plate in a cell culture incubator for 6 hours and observe the formation of tube-like structures of the cells under a microscope.
Scratch Assay
Seed 4×10⁵ HUVEC cells in each well of a 6-well plate. After the cells adhere to the bottom of the plate, use a marker pen to draw a line on the bottom of the plate, simulating a wound. Then, add 100 μL of sterile and enzyme-free solution to the wells to mark the scratch area. Rinse the plate three times with PBS and add 2 mL of DMEM containing different concentrations of CDs solution (0, 50, 100, 200, 400 μg/mL). After 12 hours and 14 hours, observe the wound healing situation.
Transwell Migration Assay
Seed 1×10⁴ HUVEC cells in the upper chamber of a 24-well transwell plate. Add 300 μL of culture medium to the upper chamber and 500 μL of complete growth medium containing different concentrations of CDs solution (0, 50, 100, 200, 400 μg/mL) to the lower chamber. After 24 hours, observe the cell migration.
Immunofluorescence Assay
Seed 1×10⁴ cells in a 24-well plate with glass coverslips pre-placed in each well. Add 2 mL of CDs solution containing specific concentrations (0, 50, 100, 200, 400 μg/mL) to each well. After 24 hours, wash the cells three times with PBS, fix them with 4% paraformaldehyde for 30 minutes, and then add VEGF primary antibody and incubate overnight at 4 degrees Celsius. Wash the cells three times again and stain the cell cytoskeleton and nucleus with phalloidin and DAPI, respectively. Finally, observe the secretion of VEGF in the cells using laser confocal microscopy.
In vivo Skin Wound Healing Study
In order to evaluate the effect of CDs on in vivo skin wound healing, we used 10 male SD rats aged 6–8 weeks, divided into two groups with 5 rats each. The first group served as a blank control, while the second group was treated with a specific dosage of CDs. The treatment method involved creating circular wounds with a diameter of 2 cm on the dorsal area of each rat, extending to the muscular layer. The blank control group received no treatment, while the experimental group had a specific number of CDs applied to the wound area for treatment. Photographs of the wounds were taken at 0, 3, 5, 7, 10, and 14 days after the injury. On the 14th day, all rats were sacrificed, and the skin wound sites were collected for histological analysis, including Hematoxylin and Eosin (HE) staining, Masson staining, and immunohistochemical analysis of CD31.
Data Analysis
In this study, all data are presented as mean ± standard deviation and statistical analysis was performed using GraphPad Prism 9 software. The final figures were generated using Origin 2021 and GraphPad Prism software. For all data, a significance level of p < 0.05 (*) was considered statistically significant.
Results
Morphology and Microstructure Study of the as Prepared CDs
Using resveratrol as the raw material and citric acid as the auxiliary material, we synthesized resveratrol CDs through a high-temperature and high-pressure process using a reaction vessel (one-pot hydrothermal method). Observing the crystal structure, grain size, and morphological features of CDs using Transmission Electron Microscopy (TEM). TEM analysis provided clear verification of the morphology of the CDs, revealing excellent dispersibility and spherical structure with uniform distribution of nanoparticles (Figure 1a and b). The particle diameter ranged from 2.794 to 4.959 nm, with an average diameter of 3.688 nm. HRTEM image (Figure 1b) showed a graphite layer spacing of 0.2 nm, indicating a narrow size distribution and uniform particle size. The X-ray diffraction (XRD) pattern of the CDs (Figure 1c) exhibited a distinct diffraction peak at 20.06°, corresponding to the (002) plane of graphitic carbon, indicating a highly graphitized structure at the core of the CDs.
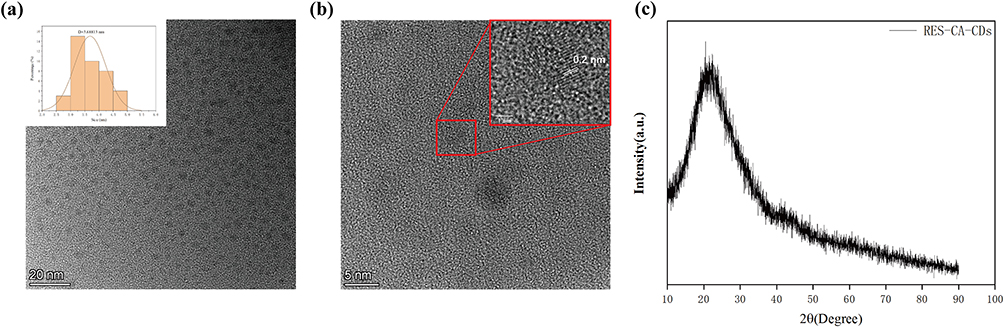 |
Figure 1 (a) TEM images and size distribution histogram of CDs. (b) Image of CDs captured by HRTEM. (c) XRD spectrum of CDs. |
Fourier transform infrared (FTIR) spectroscopy (Figure 2a) provided detailed information about the surface functionalities of the CDs. The peak at 3384 cm^-1 was attributed to the stretching vibration mode of O-H in the CDs. The peak at 1718 cm^-1 was assigned to the stretching vibration of C=O, while the peaks at 1605 cm^-1 and 1509 cm^-1 were attributed to the vibrations of C=C bonds in the aromatic rings. The peaks at 1443cm^-1, 835 cm^-1, 684 cm^-1, and 632 cm^-1 were attributed to the bending vibrations of C-H in the aromatic rings. The peak at 1224 cm^-1 was attributed to the vibration of carboxylic acid (COOH). The peaks at 1149 cm^-1 and 1000 cm^-1 were assigned to the stretching vibrations of C-O bonds. Based on these observations, it can be inferred that the formation of CDs involves the condensation of citric acid and resveratrol, followed by further carbonization to form a graphitic carbon core with hydrophilic functional groups such as -COOH and -OH attached to its surface.
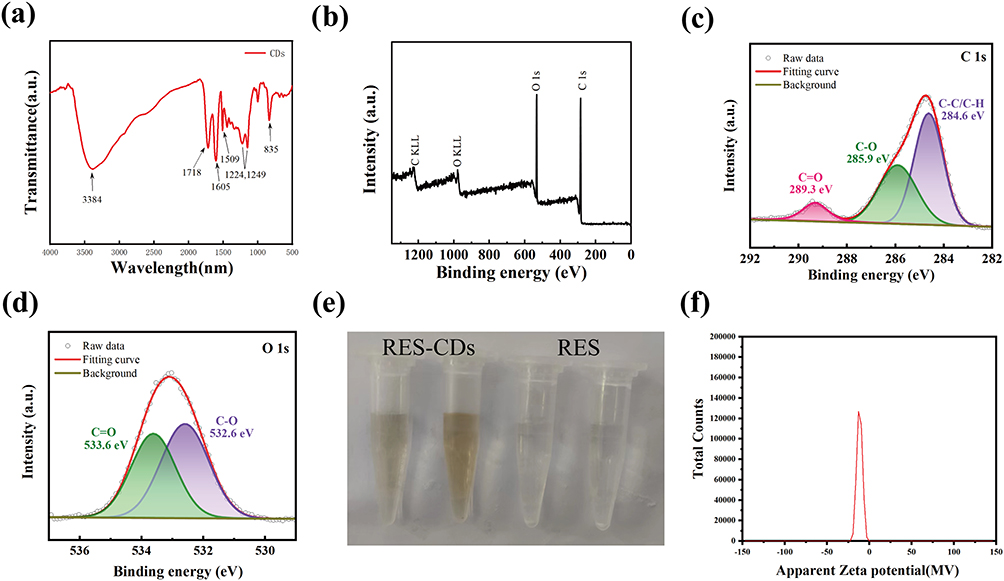 |
Figure 2 (a) FT-IR spectra of CDs. (b) The full XPS spectrum of the CDs. The picture(c) shows the XPS spectrum of C elements in CDs, while (d) represents the spectrum of oxygen elements. (e) CDs and resveratrol were separately dissolved in water. (f) Zeta Potential of CDs. |
X-ray Photoelectron Spectroscopy (XPS) is utilized to investigate the chemical composition, chemical bonding behavior, and other chemical characteristics, such as the electronic energy level distribution on the surface of CDs. The overall XPS spectrum (Figure 2b) revealed that the CDs primarily consisted of carbon (C) and oxygen (O). The high-resolution XPS spectra of C (Figure 2c) showed characteristic peaks at 284.6 eV, 285.9 eV, and 289.3 eV in the C1s spectrum, indicating the presence of C-C, C-O, and C=O vibrations in the CDs.35 The peaks corresponding to the O element (Figure 2d) are observed at 533.6 eV and 532.6 eV, indicating the presence of vibrations associated with O-H and C-O functional groups, respectively. These results confirm the presence of abundant oxygen and carbon functional groups on the surface of the CDs, providing compelling evidence for their remarkable hydrophilicity and excellent water solubility. As shown in Figure 2e, the left two tubes contain CDs solutions with concentrations of 1 mg/mL and 2 mg/mL, exhibiting a light-yellow color without precipitation. The right two tubes contain resveratrol solutions with concentrations of 1 mg/mL and 2 mg/mL, and white precipitates can be observed at the bottom of the tubes, indicating that CDs exhibit good water solubility compared to resveratrol.
Moreover, as illustrated in Figure 2f, the synthesized CDs demonstrate a zeta potential of −12.9 mV in aqueous medium. This can be attributed to the presence of carboxyl and hydroxyl functional groups on the surface, which may create numerous emission traps and contribute to the high photoluminescence (PL) characteristics.
Optical Performance Analysis of CDs
Resveratrol CDs exhibit excellent fluorescence performance, as shown in Figure 3a. The CDs appear as a brownish-yellow liquid under natural light and exhibit a yellow-green color under 365nm UV light irradiation. The UV-Vis absorption spectrum of the CDs solution shows an absorption peak at 267 nm, representing the π-π* transition absorption of aromatic compounds. The peak at 208 nm represents the π-π* transition caused by the sp2 domain’s aromatic structure. The excitation and emission wavelengths of the CDs were tested using a fluorescence spectrometer. The CDs solution was excited with wavelengths ranging from 310 nm to 450 nm, and the corresponding emission spectra were recorded (Figure 3b). It was found that the optimal excitation wavelength for this CDs solution was 372 nm, and the optimal emission wavelength was 470 nm. Subsequently, the fluorescence quantum yield of the CDs was ascertained to be 18.4% by calculating the ratio of the integrated emission intensity at the wavelength of 370nm between the CDs and quinine sulfate, as well as measuring the absorption intensities at the respective maximum absorption peaks in the UV-Vis spectra. This result indicates the CDs’ high fluorescence emission efficiency, demonstrating their promising fluorescence emission capability.
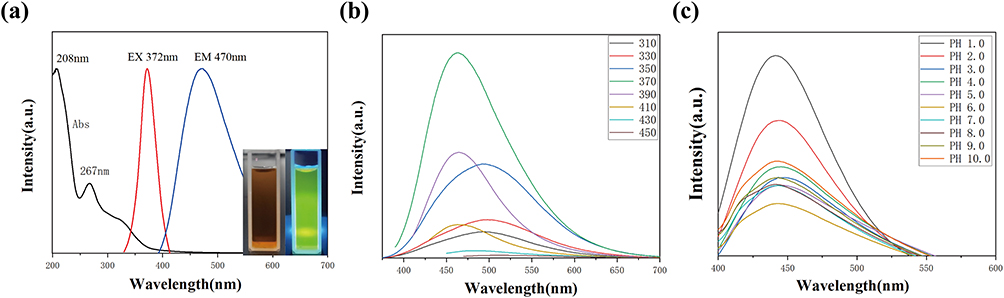 |
Figure 3 (a) Pictures of the CDs solution were taken under 365nm and natural light. The absorption peaks, optimal excitation wavelength, and the optimal emission wavelength was assessed using a UV-VIS and fluorescence spectrophotometer. (b) The emission spectra of CDs under different excitation wavelengths. (c) The emission spectra of CDs at different pH levels. |
PH Stability Assessment of CDs
To assess the stability of CDs at various pH values, we dissolved the CDs in solutions with varying pH and excited the solution at the optimal excitation wavelength. As depicted in Figure 3c, we observed distinct fluorescence intensities of the CDs under different pH conditions. Notably, in acidic environments (pH 1–6), the fluorescence intensity exhibited a significant increase, whereas in alkaline environments (pH 8–10), it displayed a noticeable decrease. These observations indicate that the fluorescence of the CDs demonstrates higher stability in acidic conditions and lower fluorescence intensity in alkaline environments. Importantly, irrespective of the pH variations, the CDs maintained their optimal emission wavelength, signifying their excellent pH stability.
EDU-Cell Proliferation Analysis
To further investigate the proliferation of cells in response to CDs, we performed laser confocal microscopy imaging of the co-culture system of cells and CDs on the third day (Figure 4a), using the EDU dye. The cell nuclei are stained in blue, while the red color indicates cells in active proliferation. The results revealed a significant number of cells in a proliferative state at a concentration of 200 μg/mL, while the cell proliferation decreased at a concentration of 400 μg/mL. However, the number of proliferating cells was still noticeably higher compared to the 50 μg/mL concentration group, indicating the potential of these CDs to promote cell proliferation.
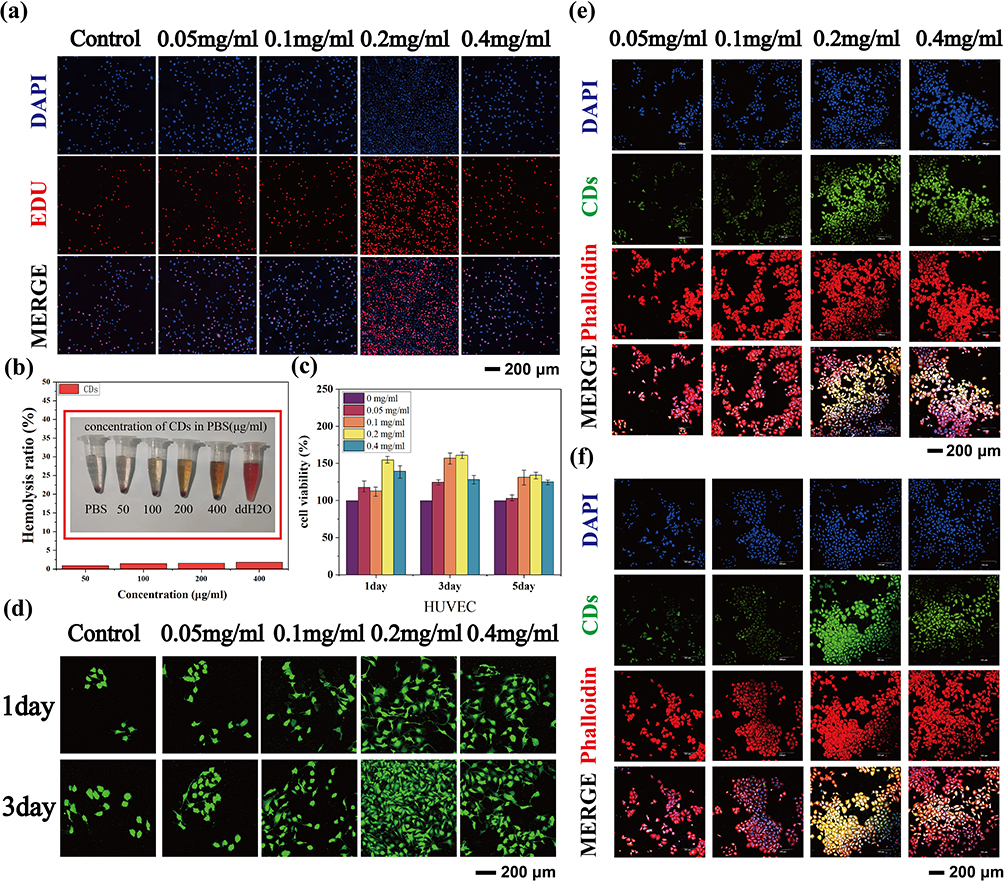 |
Figure 4 (a) EDU assay was performed to detect the HUVEC cell proliferation. (b) Performance of CDs at different concentrations in the hemolysis assay. (c) CCK-8 cell viability assay was performed after 1, 3, and 5 days of co-culturing HUVEC cells with CDs in vitro. (d) Live HUVEC cell staining with calcein AM dye(green) on Day 1 and 3. The uptake of CDs in HUVEC cells was observed at 12h (e) and 48h (f) by laser confocal microscopy. |
Hemolysis Analysis
The compatibility of the CDs with blood cells was verified through a hemolysis assay. As shown in Figure 4b, it can be observed that in the different concentrations of CDs groups, there is no apparent rupture of blood cells compared to the control group (PBS). This indicates that the CDs did not cause significant damage to the red blood cells and maintained their integrity. In the absorbance test of the supernatant, the hemolysis rate in the test group is extremely low, less than 5%. These results demonstrate the excellent biocompatibility of the CDs with blood cells.
Cytotoxic Analysis of CDs
We assessed the biocompatibility of resveratrol CDs in different cells using the CCK-8 assay. As shown in Figure 4c and Supplementary Figure 1, MC3T3 cells and HUVEC cells were used to test the cellular activity of the carbon dots. The results indicate that on the first day, except for a slight decrease in cell activity in the group with a concentration of 400 μg/mL, the activity of both cell types did not change significantly. On the third day, cells in the 200 μg/mL concentration group displayed noticeable proliferation, and on the fifth day, all groups showed a proliferation trend compared to the blank control group (0 μg/mL), especially in HUVEC cells. Even the 400 μg/mL group in HUVEC cells exhibited a proliferation trend. This suggests that these CDs exhibit good biocompatibility and have the capability to promote the proliferation of these cells.
Live-Dead Cell Assay Analysis
According to the plot, it is evident that upon laser stimulation with a wavelength of 495 nm, the viable cells demonstrate a fluorescence emission in the green spectrum. As shown in Figure 4d and Supplementary Figure 2, on the first day, the number of live cells is similar across different concentrations. On the third day, the group with a concentration of 200 μg/mL shows the highest number of live cells, while the group with a concentration of 100 μg/mL has a slightly lower number. On the fifth day, except for the group with a concentration of 400 μg/mL, the number of live cells in all other groups continues to increase. These results are consistent with the previous CCK-8 assay, indicating that the CDs have a certain proliferative effect on the cells.
Cellular Uptake by HUVEC and MC3T3
Using DAPI and phalloidin staining, the distribution of CDs within the cells, specifically in the nucleus and cytoskeleton, was examined. As shown in Figure 4e and f, Supplementary Figure 3, after 12 hours of adding CDs, it was observed that the CDs were evenly distributed in the cytoplasm, with minimal penetration into the central region of the nucleus. This indicates that the CDs can rapidly enter the cells and have minimal impact on the nucleus. After 24 hours (Figure 4e and Supplementary Figure 3a), a significant amount of CDs was observed inside the cells, with higher fluorescence intensity compared to the 12-hour time point. However, the distribution was still limited to the cytoplasm. After 48 hours (Figure 4f and Supplementary Figure 3b), the fluorescence intensity of the CDs was significantly reduced, and they were no longer observed in most cells. Despite this, the cell count remained unchanged. This suggests that the CDs were effectively eliminated from the cells, indicating a retention time of approximately 48 hours. Furthermore, the CDs were well metabolized by the cells, as they did not persist within the cells for an extended period.
Angiogenesis Experiment and Study of CDs in Skin Defect Repair
Angiogenesis refers to the process of sprouting new blood vessels from existing tiny arterioles and capillaries. The process of angiogenesis is extremely complex and generally includes the stages of endothelial matrix degradation, endothelial cell migration, proliferation, microtubule formation, branching to form vascular rings, and neo-basement membrane formation. Therefore, in our study, we used experimental methods include vascular endothelial cell scratch assay, migration assay and microtubule formation assay to test the promotional effect of resveratrol CDs on angiogenesis in vitro.
We first performed a cell scratch test to investigate the cell migration after CDs treatment (Figure 5a). It was clear that the 200 μg/mL CDs-treated group had the best cell migration performance among all groups, with a significant increase in cell migration rate. In addition, the Transwell assay (Figure 5b) showed that the 200 μg/mL treatment group detected more permeable cells at the bottom of the Transwell inserts than the other groups. Both experiments indicated that the 200 μg/mL treatment group had better cell migration promotion properties. As shown, more microvessel lumens were formed in the 200 μg/mL-treated group compared with the other groups (Figure 5c). Statistical analysis of vessel-like structures using ImageJ software showed significant differences in tube length and Nb junctions among the three groups. In addition, VEGF protein expression was detected by immunofluorescence assay (Figure 5d), and the results showed that the 200 μg/mL treatment group significantly promoted VEGF protein expression. The results of cytoskeletal staining of HUVEC showed that the cells of all groups were well stretched, indicating that resveratrol CDs had good biocompatibility. Subsequently, we performed statistical analysis on the HUVEC cell experiments, including the scratch test, migration test, and angiogenesis promotion test. According to Figure 5e, it is evident that the concentration of 0.2 mg/mL CDs exhibited the highest degree of cell scratch healing, significantly outperforming the other concentration groups. As shown in Figures 5f and g, the 0.2 mg/mL CDs solution significantly attracted cell migration at 12 hours and 24 hours. Figures 5h and i demonstrate that CDs at all concentrations to some extent promoted the tube formation of HUVEC cells, with the 0.2 mg/mL carbon dot solution inducing the most prominent tube formation phenomenon. All of the above results indicated that resveratrol CDs treatment at a concentration of 200 μg/mL significantly promoted HUVEC migration and microtubule lumen formation.
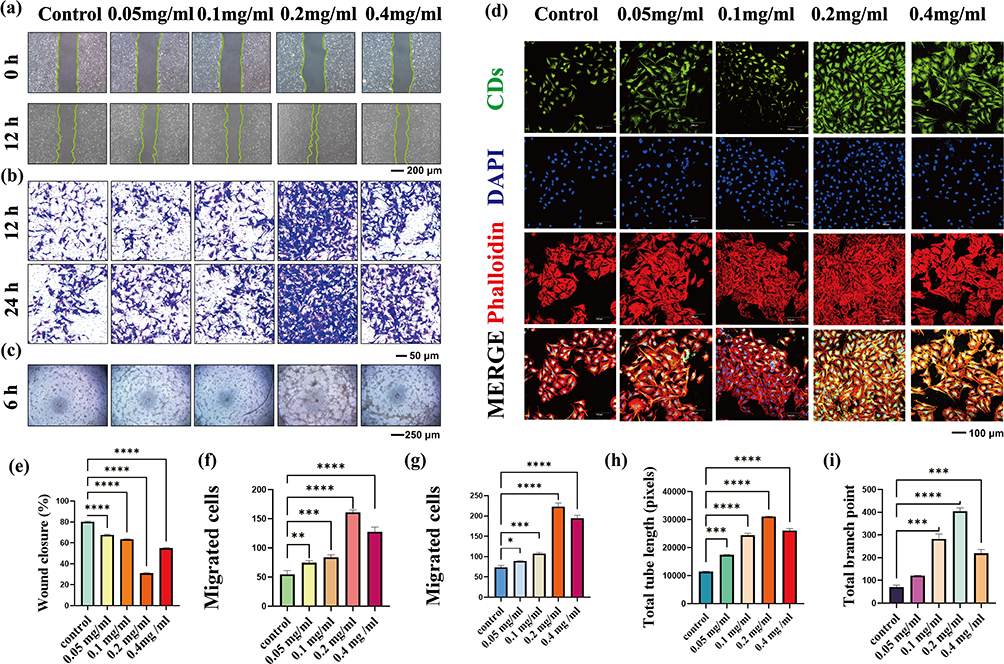 |
Figure 5 The experiments of wound healing include HUVEC cell scratch assay (a), transwell migration assay (b), and tube formation assay (c). (d) The expression of VEGF factor in HUVEC cells. (e) Cell migration area percentage in the scratch assay, (f) and (g) the number of migrated cells in the Transwell migration assay, (h) the total length of formed blood vessels, and (i) the total number of branch points in the angiogenesis assay. *p < 0.05, **p < 0.01, ***p <0.001, ****p <0.0001. |
A series of in vitro experiments have verified that resveratrol CDs have good biocompatibility, promotion of cell proliferation and migration as well as microvascular lumen formation ability. In addition, the 200 μg/mL concentration treatment group showed the most satisfactory effect, so in the in vivo part of the study, we chose this CDs concentration to verify its promotion effect on soft tissue defect repair. The rat skin defect model has been fully validated as a mature and well-established animal experiment for evaluating the effects of therapeutic application of biomaterials and has been widely used. The in vivo part of the experiment observed the wound healing process and healing rate. Our animal experimental protocol is shown in Figure 6a. A circular full-flap skin defect with a diameter of 2 cm was prepared on the dorsal side of each rat.
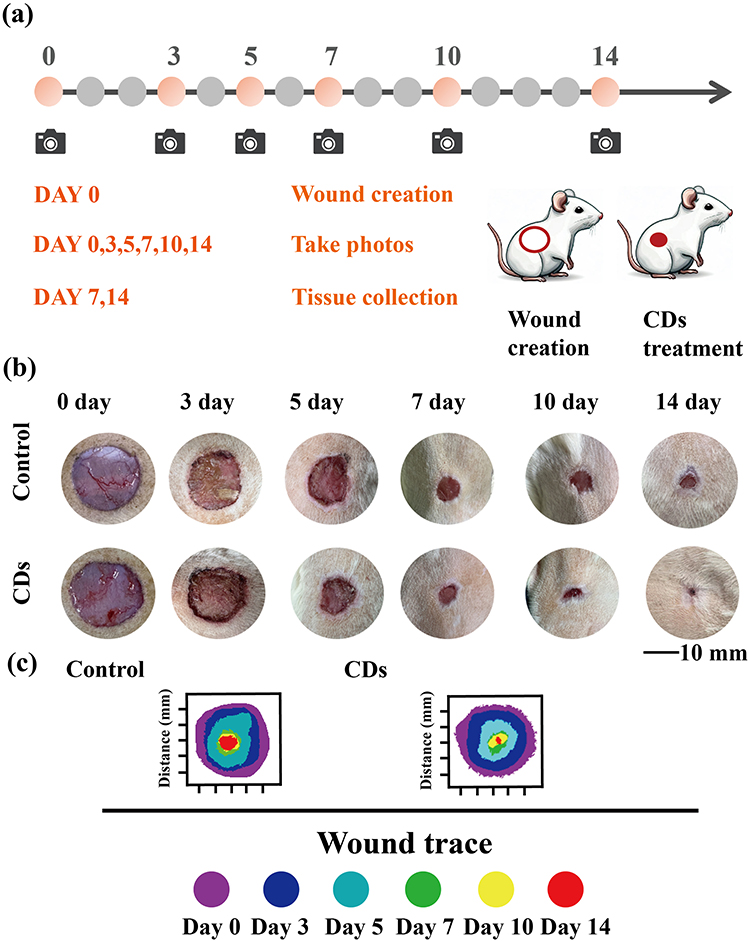 |
Figure 6 (a) Treatment procedure for SD rat skin defect. (b) Comparison of wound healing between control group and experimental group at different time points. (c) Analysis of wound healing between control group and experimental group. |
Wound closure rate is an important reference index for assessing the effectiveness of treatment. We photographed and recorded the changes in wound area at several different time points on the back of the rats. As shown in the Figure 6b, over a period of 14 days, wound contraction was more pronounced and rapid in the 200 μg/mL-treated group compared with the blank-treated group. On day 14, the skin of the 200 μg/mL treatment group was completely healed, while the skin of the blank group was in a crusted state. Quantitative analysis showed that the wound area decreased dramatically in the 200 μg/mL treatment group. The specific wound size measurements at different time points are shown in Figure 6c. These data suggest that resveratrol CDs has a strong therapeutic effect on wound closure.
Histological staining is necessary to detect tissue regeneration in defective skin. Similarly, we also assessed the in vivo safety of CDs before taking skin pathology sections from the rats. We injected the CDs solution into the rats’ tail veins, and 24 hours later, we euthanized the rats to observe changes in various organs. The results, as shown in (Figure 7a), indicate that there were no significant differences between the experimental group and the control group. This suggests that the CDS exhibited good biocompatibility in vivo. In our cell experiments with HUVECs, we observed that resveratrol carbon dots had the ability to promote angiogenesis in HUVEC cells. Furthermore, they facilitated cell proliferation in a cell scratch assay. To validate their in vivo angiogenic effects, we conducted immunohistochemical staining for CD31 on the 14th day at the rat skin defect site. As shown in Figure 7b, the expression of CD31 in the blood vessel walls at the defect site was higher in the CDs group than in the control group. Additionally, the CDs group exhibited a greater number of blood vessel walls compared to the blank control group. This indicates that the endothelial cells in the blood vessel walls at the defect site in the CDs group had higher rates of proliferation and migration, resulting in faster vascular healing. Then, we collected skin samples on days 7 and 14 to assess the degree of re-epithelialisation of the healing skin by H&E staining (Figure 7c). On day 7, healing of the epithelial layer of control skin was significantly incomplete. In contrast, the resveratrol CDs group resulted in complete formation of the epithelial layer. On day 14, the wound site in the CDs group showed a complete stratum corneum with the thickest epidermal recovery and the shortest granulation tissue gap. We next performed Masson staining to assess collagen deposition in the defective skin tissue. As shown in Figure 7d, the tightest alignment and thickest collagen bundles indicated that the resveratrol CDs group performed well in accelerating wound healing. In addition, the group had a large number of neovascularisations, well-organised collagen fibres and the formation of skin appendages such as hair follicles. Collagen staining intensity analysis is shown in Figure 7d.
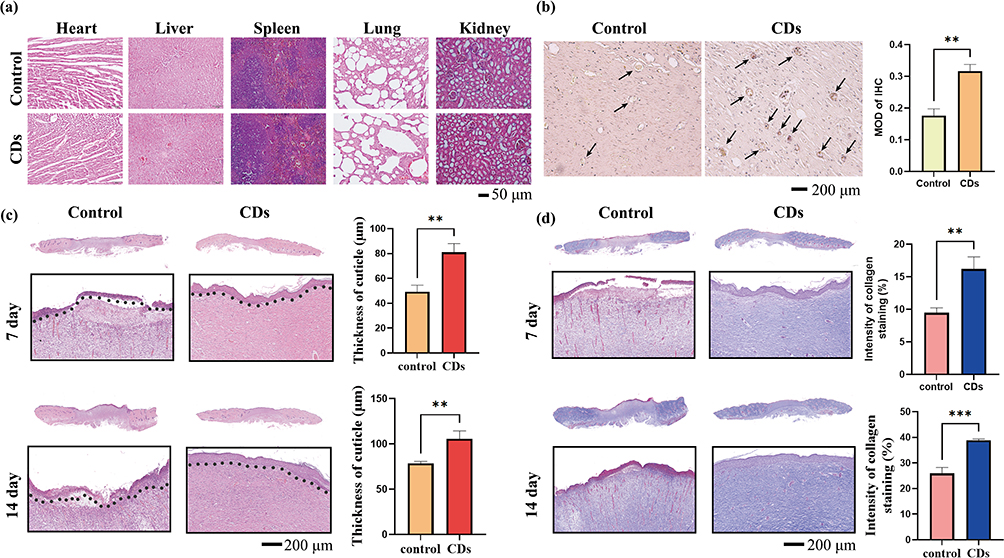 |
Figure 7 (a) HE-stained sections of organs from SD rats after intravenous injection of different solutions. (b) Immunohistochemical staining of CD31 in the rat skin defect site. (The brown-black area pointed by the black arrows represents the region around blood vessels expressing the CD31 factor). (c) Analysis of HE-stained sections and epithelial thickness in different treatment groups of skin defects. (d) Analysis of Masson-stained sections and collagen fiber content in different treatment groups of skin defects. **p < 0.01, ***p <0.001. |
All these in vivo studies showed that resveratrol CDs had good biocompatibility as well as accelerated wound healing properties, and significantly promoted regenerative repair of defective skin tissues. The resveratrol CDs, therefore, are a highly efficient nanomaterial for wound healing.
In the above-mentioned study, we conducted characterizations of resveratrol CDs and found that they possess excellent water solubility and fluorescence properties. Compared to raw resveratrol material, these CDs exhibit new physical properties, broadening their potential applications in the future. In our cell experiments, we initially confirmed that these CDs, with their fluorescent properties, can enter cells for fluorescent imaging. Subsequently, through various methods, we verified that, at a certain concentration, they can promote the proliferation of various types of cells, which is consistent with previous reports. However, the optimal concentration of the CDs we developed is slightly higher than the previously reported safe concentration (10 μ mol/mL).34
Likewise, in experiments aimed at promoting wound healing and angiogenesis, our CDs demonstrated the efficacy of resveratrol, and we determined that 200 μg /mL is the optimal concentration for promoting cell proliferation at the tissue wound site. Through immunofluorescence and immunohistochemistry, we discovered that the resveratrol CDs enhance the expression of factors like VEGF and CD31, thereby promoting tissue vascularization and cell proliferation. These findings indicate that our CDs inherit some of the pharmacological properties of resveratrol while also possessing new characteristics such as water solubility, fluorescence, and enhanced biocompatibility.
These discoveries offer new possibilities in addressing the current limitations of resveratrol, which include low bioavailability, rapid metabolism, and the inability to target specific injury sites. However, some aspects of resveratrol, such as its anti-inflammatory, antioxidant, antimicrobial properties, and the specific mechanisms through which these carbon dots promote tissue healing, have not been verified in this particular study. We plan to explore these aspects in future experiments, further expanding the potential applications of resveratrol and natural compound-based CDs.
Conclusion
In summary, we have developed a water-based, one-step hydrothermal method using natural plant extract resveratrol as the raw material to produce CDs with excellent cell compatibility. The prepared CDs exhibit strong fluorescence properties and excellent pH stability. They demonstrate good cell compatibility and penetration for animal cells. In addition, we investigated the efficacy of these CDs in wound healing, and the results demonstrated their excellent potential for promoting tissue regeneration both in vitro and in vivo. The emergence of resveratrol CDs provides a new approach to address the common use of materials like hydrogels and electrospun fibers for delivering resveratrol in wound healing treatments. Nevertheless, the utilization of naturally occurring polyphenolic compounds for CDs extraction is currently a prominent topic in green organic chemistry. This study provides a foundational understanding of CDs for cellular fluorescence labeling and wound healing, paving the way for potential clinical applications in future trials.
Ethics Approval and Consent to Participate
The animal experiments were conducted in accordance with the “Regulations on the Management of Laboratory Animals” and the “Guidelines for the Care and Use of Laboratory Animals” from the Shanxi Province, following the approval of the Ethics Committee of Shanxi Medical University.
Acknowledgments
This research was funded by Shanxi Province Science and Technology Innovation Key Talent Team (202204051002034); The central government guides local funds for science and technology development (YDZJSX2022C029, YDZJSX2021C011); Scientific research project for returning students in Shanxi Province (2022-120); Key R&D Program of Shanxi Province (202102130501002) and Key national science and technology cooperation project of Shanxi Provincial Department of Science and Technology (20220404110100).
Disclosure
The authors report no conflicts of interest in this work.
References
1. Neupane GP, Zhang LL, Yildirim T, et al. A prospective future towards bio/medical technology and bioelectronics based on 2D vdWs heterostructures. Nano Res. 2020;13(1):1–17. doi:10.1007/s12274-019-2585-3
2. Diez-Pascual AM, Rahdar A. Functional nanomaterials in biomedicine: current uses and potential applications. Chemmedchem. 2022;17(16). doi:10.1002/cmdc.202200142
3. Murali A, Lokhande G, Deo KA, Brokesh A, Gaharwar AK. Emerging 2D nanomaterials for biomedical applications. Mater Today. 2021;50:276–302. doi:10.1016/j.mattod.2021.04.020
4. Ge JX, Zhang QY, Zeng JF, Gu Z, Gao MY. Radiolabeling nanomaterials for multimodality imaging: new insights into nuclear medicine and cancer diagnosis. Biomaterials. 2020;2020:228.
5. Fan M, Han Y, Gao S, et al. Ultrasmall gold nanoparticles in cancer diagnosis and therapy. Theranostics. 2020;10(11):4944. doi:10.7150/thno.42471
6. Li Z, Guo J, Zhang M, Li G, Hao L. Gadolinium-coated mesoporous silica nanoparticle for magnetic resonance imaging. Front Chem. 2022;2022:10.
7. Boss A, Heeb L, Vats D, et al. Assessment of iron nanoparticle distribution in mouse models using ultrashort‐echo‐time MRI. NMR Biomed. 2022;35(6):e4690. doi:10.1002/nbm.4690
8. Li M, Singh R, Wang Y, Marques C, Zhang B, Kumar S. Advances in novel nanomaterial-based optical fiber biosensors—A review. Biosensors. 2022;12(10):843. doi:10.3390/bios12100843
9. Shahriar R, Hoque KS, Tristant D, Zubair A. Vacancy induced magnetism and electronic structure modification in monolayer hexagonal boron arsenide: a first-principles study. Appl Surf Sci. 2022;600:154053. doi:10.1016/j.apsusc.2022.154053
10. Thangam R, Paulmurugan R, Kang H. Functionalized nanomaterials as tailored theranostic agents in brain imaging. Nanomaterials. 2022;12(1):18. doi:10.3390/nano12010018
11. Hou Y, Zhang R, Cheng H, et al. Mg2+-doped carbon dots synthesized based on Lycium ruthenicum in cell imaging and promoting osteogenic differentiation in vitro. Colloids Surf a Physicochem Eng Asp. 2023;656:130264. doi:10.1016/j.colsurfa.2022.130264
12. Kurian AG, Singh RK, Patel KD, Lee J-H, Kim H-W. Multifunctional GelMA platforms with nanomaterials for advanced tissue therapeutics. Bioact Mater. 2022;8:267–295. doi:10.1016/j.bioactmat.2021.06.027
13. Li S, Li L, Tu HY, et al. The development of carbon dots: from the perspective of materials chemistry. Mater Today. 2021;51:188–207. doi:10.1016/j.mattod.2021.07.028
14. Shishodia S, Rimal V, Srivastava PK. Synthesis of tunable high-thermal stability carbon dots via functionalization for applications in high-temperature environment. Appl Nanosci. 2021;11(5):1691–1706. doi:10.1007/s13204-021-01814-7
15. Wang LX, Zeng QX, Chen QH, Li CM, Chen JC. Synergistically boosting the electrochemical performance of polypyrrole-coated activated carbon derived from carbon dots for a high-performance supercapacitor. Chem Comm. 2021;57(73):9264–9267. doi:10.1039/D1CC02823E
16. Ali H, Ghosh S, Jana NR. Fluorescent carbon dots as intracellular imaging probes. Wiley Interdiscip Rev Nanomed. 2020;12(4). doi:10.1002/wnan.1617
17. Dolai S, Bhunia SK, Rajendran S, UshaVipinachandran V, Ray SC, Kluson P. Tunable fluorescent carbon dots: synthesis progress, fluorescence origin, selective and sensitive volatile organic compounds detection. Crit Rev Solid State Mater Sci. 2021;46(4):349–370. doi:10.1080/10408436.2020.1830750
18. Ross S, Wu RS, Wei SC, Ross GM, Chang HT. The analytical and biomedical applications of carbon dots and their future theranostic potential: a review. J Food Drug Anal. 2020;28(4):677–695. doi:10.38212/2224-6614.1154
19. Liuye SQ, Cui SQ, Lu MM, Pu SZ. Construction of a photo-controlled fluorescent switching with diarylethene modified carbon dots. Nanotechnology. 2022;33(40):405705. doi:10.1088/1361-6528/ac48ba
20. Sarma D, Majumdar B, Sarma TK. Visible-light induced enhancement in the multi-catalytic activity of sulfated carbon dots for aerobic carbon-carbon bond formation. Green Chem. 2019;21(24):6717–6726. doi:10.1039/C9GC02658D
21. Koutsogiannis P, Thomou E, Stamatis H, Gournis D, Rudolf P. Advances in fluorescent carbon dots for biomedical applications. Adv Phy. 2020;5(1). doi:10.1080/23746149.2019.1710252
22. Peng ZL, Han X, Li SH, et al. Carbon dots: biomacromolecule interaction, bioimaging and nanomedicine. Coord Chem Rev. 2017;343:256–277. doi:10.1016/j.ccr.2017.06.001
23. Dong C, Ma X, Huang Y, Zhang Y, Gao X. Carbon dots nanozyme for anti-inflammatory therapy via scavenging intracellular reactive oxygen species. Front Bioeng Biotechnol. 2022;10:943399. doi:10.3389/fbioe.2022.943399
24. Luo K, Wen Y, Kang X. Halogen-doped carbon dots: synthesis, application, and prospects. Molecules. 2022;27(14):4620. doi:10.3390/molecules27144620
25. Wang B, Lu S. The light of carbon dots: from mechanism to applications. Matter. 2022;5(1):110–149. doi:10.1016/j.matt.2021.10.016
26. Xu SR, Liu HL, Chen CP, Feng SL, Fan J. Ultrasound-assisted one-step reduction and self-assembly of carbon dots-reduced graphene oxide: mechanism investigation and solid phase microextraction of ultra-trace organochlorine pesticides. Chem Eng J. 2023;2023:451.
27. Santos AC, Pereira I, Pereira-Silva M, et al. Nanocarriers for resveratrol delivery: impact on stability and solubility concerns. Trends Food Sci Technol. 2019;91:483–497. doi:10.1016/j.tifs.2019.07.048
28. Walle T. Bioavailability of resveratrol. Ann N Y Acad Sci. 2011;1215:9–15. doi:10.1111/j.1749-6632.2010.05842.x
29. Chimento A, De Amicis F, Sirianni R, et al. Progress to improve oral bioavailability and beneficial effects of resveratrol. Int J Mol Sci. 2019;20(6):1381. doi:10.3390/ijms20061381
30. Hong Y, Zhou F, Hua Y, et al. A strongly adhesive hemostatic hydrogel for the repair of arterial and heart bleeds. Nat Commun. 2019;10(1):2060. doi:10.1038/s41467-019-10004-7
31. Yuan H, Chen L, Hong FF. A biodegradable antibacterial nanocomposite based on oxidized bacterial nanocellulose for rapid hemostasis and wound healing. ACS Appl Mater Interfaces. 2020;12(3):3382–3392. doi:10.1021/acsami.9b17732
32. Wang Z, Hu W, Du Y, et al. Green gas-mediated cross-linking generates biomolecular hydrogels with enhanced strength and excellent hemostasis for wound healing. ACS Appl Mater Interfaces. 2020;12(12):13622–13633. doi:10.1021/acsami.9b21325
33. Zeng C, Pan F, Jones LA, et al. Evaluation of 5-ethynyl-2’-deoxyuridine staining as a sensitive and reliable method for studying cell proliferation in the adult nervous system. Brain Res. 2010;1319:21–32. doi:10.1016/j.brainres.2009.12.092
34. Saleh HA, Ramdan E, Elmazar MM, Azzazy HME, Abdelnaser A. Comparing the protective effects of resveratrol, curcumin and sulforaphane against LPS/IFN-γ-mediated inflammation in doxorubicin-treated macrophages. Sci Rep. 2021;11(1):545. doi:10.1038/s41598-020-80804-1
35. Xu D, Li M, Xu H, Yu J, Wang Y, Zhang P. N,S-doped carbon quantum dots as a fluorescent probe for palladium(II) ions via Förster resonance energy transfer. Results Chem. 2021;3:100179. doi:10.1016/j.rechem.2021.100179
 © 2023 The Author(s). This work is published and licensed by Dove Medical Press Limited. The full terms of this license are available at https://www.dovepress.com/terms.php and incorporate the Creative Commons Attribution - Non Commercial (unported, v3.0) License.
By accessing the work you hereby accept the Terms. Non-commercial uses of the work are permitted without any further permission from Dove Medical Press Limited, provided the work is properly attributed. For permission for commercial use of this work, please see paragraphs 4.2 and 5 of our Terms.
© 2023 The Author(s). This work is published and licensed by Dove Medical Press Limited. The full terms of this license are available at https://www.dovepress.com/terms.php and incorporate the Creative Commons Attribution - Non Commercial (unported, v3.0) License.
By accessing the work you hereby accept the Terms. Non-commercial uses of the work are permitted without any further permission from Dove Medical Press Limited, provided the work is properly attributed. For permission for commercial use of this work, please see paragraphs 4.2 and 5 of our Terms.