Back to Journals » Clinical Ophthalmology » Volume 16
The Philippine Peso Bill as an Alternative Near Visual Acuity Chart in Filipino Eyes: A Pilot Study
Authors Briones LJ ![]() , Gomez JP, Leuenberger EF
, Gomez JP, Leuenberger EF
Received 1 June 2022
Accepted for publication 5 August 2022
Published 14 October 2022 Volume 2022:16 Pages 3437—3445
DOI https://doi.org/10.2147/OPTH.S376818
Checked for plagiarism Yes
Review by Single anonymous peer review
Peer reviewer comments 2
Editor who approved publication: Dr Scott Fraser
Lee Jerome Briones,1 James Paul Gomez,2 Edgar Felipe Leuenberger1– 3
1Department of Ophthalmology, University of the East Ramon Magsaysay Memorial Medical Center Inc, Quezon City, Philippines; 2Department of Ophthalmology, Asian Eye Institute, Makati City, Philippines; 3Department of Ophthalmology, Ospital ng Makati, Makati City, Philippines
Correspondence: Lee Jerome Briones, Department of Ophthalmology, University of the East Ramon Magsaysay Memorial Medical Center Inc, 64 Aurora Boulevard, Quezon City, 1113, Philippines, Tel +639178271894, Email [email protected]
Purpose: This study aimed to determine if near visual acuity measurements using a Philippine peso bill are comparable to a standard Jaeger chart.
Study Design: This is a cross-sectional study comparing the near visual acuity measurements of a Philippine peso bill and a Jaeger chart among sixty subjects.
Methods: LogMAR scores from the two methods were analyzed using Wilcoxon Mann–Whitney test. The relationship of the logMAR scores between these methods was determined using Spearman rank order correlation. The Bland-Altman plot was used to determine the comparability between quantitative measurements for near visual acuity using the standard Jaeger chart (reference) and the Philippine peso bill.
Results: There were no significant differences in the proportion of Jaeger scores and mean logMAR equivalents between the two methods (p > 0.05). The scatter plot diagram shows a positive upward trend with a very strong and significant correlation between logMAR scores of Jaeger chart and Philippine peso bill methods (r = 0.9258, p < 0.0001). With a concordance correlation coefficient of 0.9505, there is a high agreement between these two measures. The Philippine peso bill overestimates the Jaeger chart visual acuity by 0.04 logMAR units. We suspect that the contrast between the background color and the serial numbers of the peso bill may have brought about this outcome.
Conclusion: The Philippine peso bill may be used as an alternative measuring tool for near visual acuity. However, there is a tendency to overestimate the scores obtained using the Philippine peso bill. Future studies are recommended to validate the results in a tele-ophthalmology setting.
Keywords: Jaeger chart, near vision, near visual acuity testing, telemedicine, tele-ophthalmology
Introduction
The outbreak of the coronavirus disease 2019 (COVID-19) has caused the volume of ophthalmology face-to-face consults to decline by as much as 80%1 with twenty-five states across the United States of America restricting non-emergent in-person consults and procedures.2 As such, telemedicine became the only way for clinicians to deliver eye care.3 In a survey done in the Philippines, ophthalmologists reported an increased usage in tele-ophthalmology from 53% to 90% at the time of the COVID-19 pandemic.4 Although high percentages were noted, examination of the eye remotely is still difficult due to limitations in examination procedures such as accessibility, interpretation of results, and availability of testing materials at home. One of the difficulties in telemedicine is visual acuity testing, which is the cornerstone of any eye examination.
Measuring far and near visual acuity is an important part of any ophthalmologic examination and is also a vital part in telediagnostics. Testing far vision makes use of the Early Treatment Diabetic Retinopathy Study (ETDRS) or Snellen chart that requires a distance of 20 feet, while near vision evaluations employ the Jaeger charts that are held at a distance of 14 inches. These measuring tools though are present only in face-to-face clinics and are not available during telemedicine consults. As a result, numerous gadget-based applications such as the DigiVis,5 Peek Acuity,6 and COMPlog chart7 have been used as alternatives to measure visual acuity. These telediagnostics, however, are difficult to access because they may require a specific software (Android/Apple), a subscription fee, or a strong internet connection. A readily available device such as the Philippine peso bill can overcome these limitations.
In this study, we aimed to investigate the feasibility of using a readily available device as an alternative-measuring tool for near vision. Our purpose was to determine if near visual acuity measurements using a Philippine peso bill are comparable to a standard Jaeger chart.
Methods
This is a cross-sectional study of the near visual acuity using the Philippine peso bill and Jaeger chart among the hospital staff of the University of the East Ramon Magsaysay Memorial Medical Center, Inc. (UERMMMCI).
The principles of transparency, legitimate purpose, and proportionality in the collection, retention, and processing of personal information (Data Privacy Act of 2012) were adhered to by the investigators. Each participant’s privacy and confidentiality was upheld. The study was conducted in accordance with applicable national and institutional regulations and guidelines, which govern Good Clinical Practices and Internal Review Board operations. The protocol was submitted for ethical evaluation to the UERMMMCI Research Institute for Health Sciences Ethics Review Committee and was conducted upon approval (RIHS ERC Code: 0905/H/2020/133, April 21, 2021).
After informed consent was obtained, thirty participants aged 20-40 years and thirty participants aged 41-65 years were recruited using convenience sampling. This was followed by a near vision preliminary screening using the Jaeger chart. Inclusion criteria consisted of an uncorrected Jaeger score of at least J16 in the better eye. Participants who were not willing to perform the test and were intolerant to eye occlusion were excluded.
Once participants have signed the informed consent and have met the inclusion criteria, they were brought one by one to the designated testing room and were asked to sit on an examination chair. Participants were required to wear a face mask and sanitize their hands prior to entering the room.
Procedure of the Study
The examination room had a single table and chair that were positioned underneath a ceiling fluorescent light bulb. Room temperature was maintained at 24°C, illuminance was sustained at 200–250 lux, testing was done from 9:00 am till 11:00 am. In compliance with the hospital’s minimum health protocols, each room had a ceiling mounted exhaust fan, and sanitation using disinfectant sprays and wipes were employed before and after each use of the room.
The tools that were used in this study were a 2020 Philippine new-generation series of one hundred-peso bill mounted on a cardboard (Figure 1) and a Rosenbaum pocket vision screener containing near vision Jaeger scores. Both tools were disinfected with a UV sterilizer before and after use.
 |
Figure 1 2020 Philippine new generation series of one hundred-peso bill. (With permission from the Bangko Sentral ng Pilipinas in compliance with Circular No. 829, Series of 2014). |
Examination was performed only on the eye with the better visual acuity, while the other eye was occluded by the examiner using a self-adhesive eye patch. If both eyes have the same visual acuity, then the dominant eye was selected. Subjects were asked to close and rest both eyes for five minutes. This was followed by a near vision test using a Jaeger chart held at a distance of 36 cm in front of the better eye. The distance between the chart and the subject’s eyes was measured with a tape meter at the beginning of the test and was supervised by the examiner to avoid fluctuations. Subjects were then asked to read from the largest to the smallest line on the Jaeger chart while wearing previously obtained corrective lenses for near vision if any.8 Subject’s visual acuity measurement was recorded based on the majority of the numbers that were correctly identified.9
After a resting period of five minutes, the near vision acuity was tested using the Philippine one hundred-peso bill. Subjects were given a Philippine one hundred-peso bill, held at a distance of 36 cm in front of the better eye. The distance between the one hundred-peso bill and the subject’s eyes was measured with a tape meter at the beginning of the test and was supervised by the examiner to avoid fluctuations. Subjects were then asked to read the serial numbers seen on the upper right hand corner of the one hundred-peso bill (Figure 2) starting from the right most optotype to the left while wearing previously obtained corrective lenses for near vision if any. If all serial numbers were read on the upper right hand corner, the subject was directed to focus on the blue seal located on the lower left hand side of the optotypes (Figure 3). The subject was then asked to read the last word of the line found above the blue seal (Figure 4). If the subject was still able to read the word, he or she was directed back to the blue seal and was then asked to read the last name of the signatory found below the blue seal (Figure 5). The subject’s near visual acuity measurement was recorded based on the smallest optotype or word that was correctly identified (Figure 6). If near visual acuity measurement was only until optotype 6 or 7 (Figure 7), then a score of J16 was recorded.
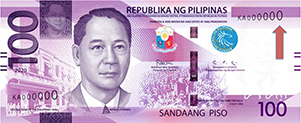 |
Figure 2 Examination starting point of Philippine peso bill. (With permission from the Bangko Sentral ng Pilipinas in compliance with Circular No. 829, Series of 2014).. |
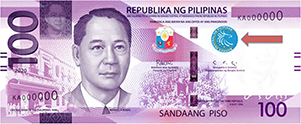 |
Figure 3 Blue seal. (With permission from the Bangko Sentral ng Pilipinas in compliance with Circular No. 829, Series of 2014). |
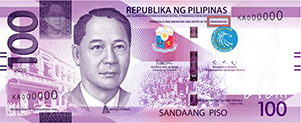 |
Figure 4 Last word of the line above blue seal. (With permission from the Bangko Sentral ng Pilipinas in compliance with Circular No. 829, Series of 2014). |
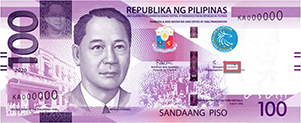 |
Figure 5 Last name of signatory below blue seal. (With permission from the Bangko Sentral ng Pilipinas in compliance with Circular No. 829, Series of 2014). |
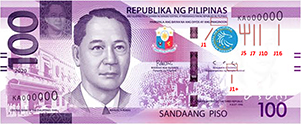 |
Figure 6 Equivalent Jaeger scores of serial numbers and words. (With permission from the Bangko Sentral ng Pilipinas in compliance with Circular No. 829, Series of 2014). |
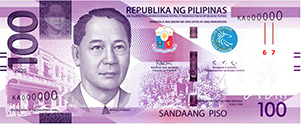 |
Figure 7 Serial numbers with no Jaeger score equivalent. (With permission from the Bangko Sentral ng Pilipinas in compliance with Circular No. 829, Series of 2014). |
Jaeger scores that were collected from the participants were transformed into their equivalent logMAR score based on the Holladay Visual Acuity Conversion Chart.10 The Jaeger scores and logMAR equivalents were then recorded on the allotted data tables.
Statistical Analysis
Data were analyzed using Stata version 10 software. These were summarized using frequency and percent distribution for categorical variables and mean ± standard deviations (SD) for continuous variables.
Differences in the proportion of Jaeger scores were determined using Chi-square test or Fisher's exact test when applicable. LogMAR scores between the two methods were compared using Wilcoxon Mann–Whitney test. Normality was tested using the Shapiro–Wilk test and to determine the correlation of the logMAR scores between the two methods, Spearman rank order correlation was used. A p-value <0.05 was assigned as cut-off for significance.
Since correlation research designs cannot be used to draw conclusions about the causal relationships among measured variables, comparability between quantitative measurements for near visual acuity using the standard Jaeger chart (reference) and the Philippine peso bill, the Bland–Altman method and Lin’s concordance correlation were used. The agreement between these two measurements was analyzed by studying the mean difference and constructing limits of agreement.
No estimates could be obtained from the literature to compute the sample size. The investigators hence decided on a pilot study with a sample size of 30–50 participants based on Browne’s rule of thumb.11
Results
Sixty hospital staff were enrolled in this study: thirty pre-presbyopic subjects (20–40 years old) and thirty presbyopic subjects (41–65 years old). Participants consisted of males (n = 27) and females (n = 33). The mean age of the respondents was 41.3 SD ± 10.5 years, the youngest being 22 years old and the oldest being 61 years old (Table 1). There were no participants who were excluded or unwilling to be tested and intolerant to occlusion. Participants mentioned having no difficulties during the whole process and commented that the procedure itself was fast without any problems.
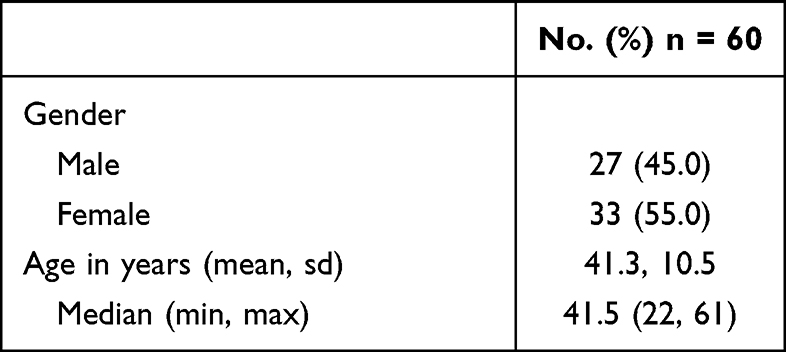 |
Table 1 Demographic Profile of Participants |
The most frequent Jaeger score was J1+ at 48.3% and 45% for Jaeger chart and peso bill methods, respectively. The Jaeger chart method registered scores of J2 and J3 and more of J7 compared to the peso bill method. Meanwhile, the peso bill method recorded more scores of J5 and J10. Converting to logMAR scores, the average value of Jaeger chart method was 0.195 SD ± 0.273 and that of peso bill method was 0.233 SD ± 0.302. There were no significant differences in the proportion of Jaeger scores and mean logMAR equivalent between the two methods (p > 0.05) (Table 2).
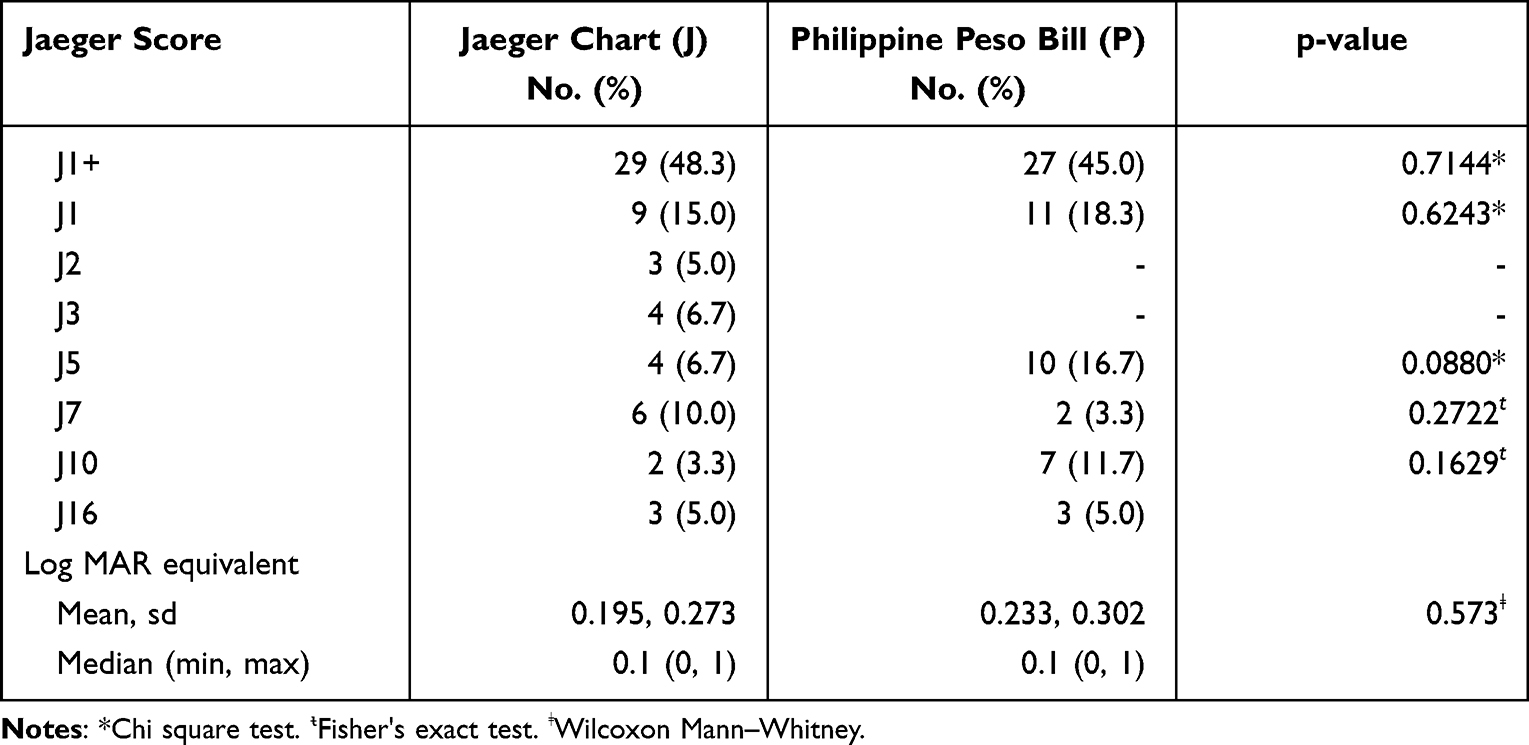 |
Table 2 Near Visual Acuity Profile |
The scatter plot diagram shows a positive (upward trend), very strong (r = 0.9258) and significant (p < 0.0001) correlation between logMAR scores of Jaeger chart and Philippine peso bill methods (Figure 8). There were similar values for certain data points on logMAR equivalent of Jaeger (X-axis) vs peso bill (Y-axis) as in the following: 0/0 (25); 0.3/0.4 (4); 0.1/0.1 (6); 0.1/0 (2); 0.4/0.4 (3); 0/0.1 (4); 0.2/0.4 (2); 1.0/1.0 (3); 0.5/0.7 (5); 0.7/0.7 (2). The rest are unique values, and the total number of observations is 60 (N). However, this does not automatically imply that there is good agreement between the two methods.
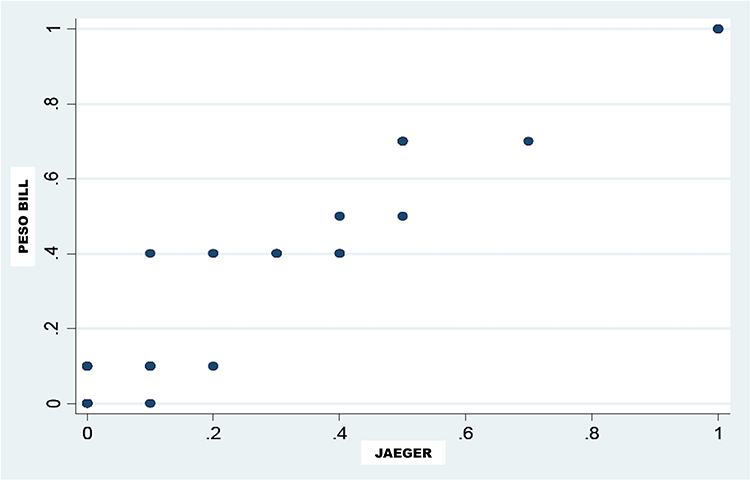 |
Figure 8 Scatter plot of logMAR scores between Jaeger chart and Philippine peso bill method. |
The Bland–Altman method was used to describe the agreement between two quantitative measurements by comparing the difference between the two methods (Y-X) against their mean value (X+Y/2). There were similar data values for certain data points on average (X-axis) and difference (Y-axis) as in the following: 0/0 (25); 0.1/0.35 (4); 0/0.1 (6); −0.1/0.05 (2); 0.1/0.05 (4); 0/0.4 (3); 0.22/0.29 (2); 0/1 (3); 0.16/0.62 (5); 0/0.7 (2) The rest are unique values and the total number of observations is 60 (N). The mean difference between the two methods is 0.038 SD ± 0.08 which is almost near 0, the value of the line of equality implying, therefore, a very small absolute difference between the two methods. However, the bias is significant because the line of equality (0) is not within the confidence interval of the mean difference (0.017, 0.060). This means that there are significant systematic differences between the two methods (Figure 9). That is, the peso bill constantly overestimates the visual acuity of the Jaeger method or the Jaeger method constantly underestimates the visual acuity of the peso bill method. On average, the peso bill (Y) is 0.04 logMAR units more than the Jaeger chart (X) or the Jaeger chart (X) is 0.04 logMAR units less than the peso bill (Y).
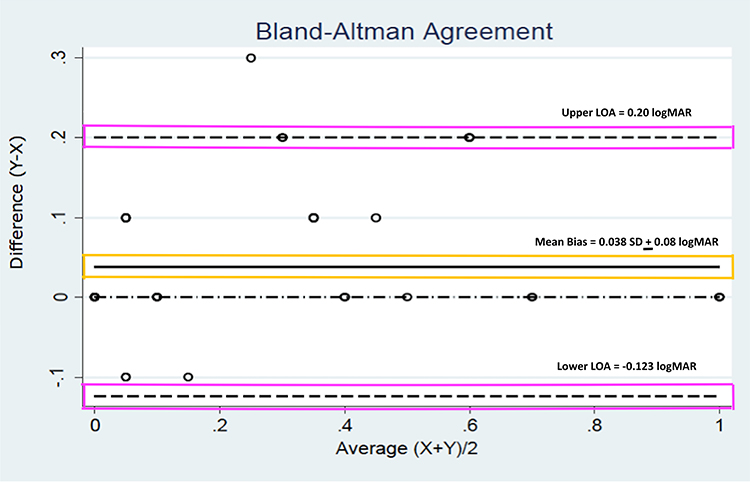 |
Figure 9 Bland-Altman plot comparing Philippine peso bill visual acuity measurements with the standard Jaeger to evaluate agreement. The mean bias (yellow box) and 95% limits of agreement (purple boxes) are labeled. LOA, limits of agreement. logMAR, Logarithm of the Minimum Angle of Resolution. |
The range of agreement, within which 95% of the differences between measurements lie, defines the upper and lower limits of agreement (LOA). It is −0.123 for lower LOA and 0.200 for upper LOA. Such limits are deemed acceptable based on clinical considerations. Within such narrowed limits of agreement, there was only one case beyond the upper limit and none below the lower limit. A concordance correlation coefficient of 0.9505 implies a high agreement between paired measurements. As such, the two methods can be considered in agreement and can be used interchangeably (Table 3).
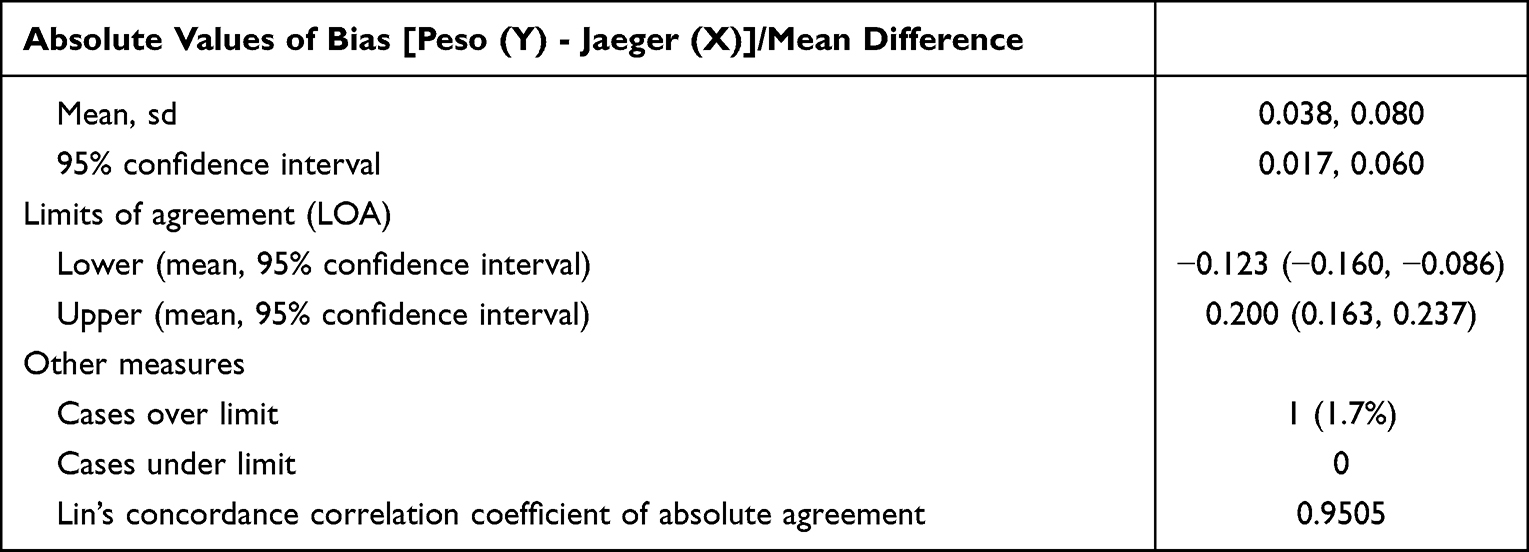 |
Table 3 Measures Related to Agreement |
Discussion
Near vision testing may be a more practical method in tele-ophthalmology than far vision testing because of the prerequisite examination distance of 20 feet and a large chart size of approximately 24 × 24 inches. In addition, a near vision chart requires a distance of only 14 inches and is universally done using a pocket reading vision card.12 However, due to the inaccessibility of near visual acuity measuring tools for patients in telemedicine, ophthalmologists had difficulty giving patients an objective assessment, especially during the COVID-19 pandemic. This prompted the investigators to search for an alternative-measuring tool for near vision.
In choosing an appropriate alternative near vision acuity tool, there were numerous household items (electric bill, pocket calendar, coffee sachets, potato chip wrappers, newspapers, magazines) considered. The investigators set several criteria to determine the most ideal tool. These were as follows: accessible, technology independence, applicable to various levels of cognitive abilities, and should contain various font sizes with good contrast. The item must be a household object that is readily available and familiar to our target age group.
We considered the Philippine peso bill as an ideal alternative vision screener because it satisfies the aforementioned requirements. It is ubiquitous, does not require a smartphone or internet connection, it is familiar to subjects of varying educational levels, and it has serial numbers on the upper right hand side that are similar to the optotypes of a Rosenbaum Jaeger chart.
To apply the Philippine peso bill in our study setting, it is important to convert the characters into optotypes. Optotypes are figures or letters of different sizes, systematically placed on a visual acuity chart.13 Two principles of letter chart designs have gained wide acceptance: letters in charts should follow a geometric progression and letters used in the chart should be of equal legibility.14 It is our assumption that the Philippine peso bill contains such design features that satisfy the principle of optotypes, namely: letters are of equal legibility, letters are san serif, and letter sizes follow a geometric progression. However, other features such as the number of letters per row, the one letter-width spacing between optotypes, the letter size dependence on testing distance, and the chart rows labeled with visual acuity rating were found wanting.15 Despite this, the investigators still believe that the Philippine peso bill approximates these principles.
The one hundred-peso bill appears to have a better contrast in comparison to the other paper denominations. Several studies have demonstrated that a decrease in contrast will affect visual acuity. It was observed that two methods of decreasing the acuity were reducing the intensity of illumination16 and reducing the contrast between the test object and its background.17 In an article by Rubin, decreasing the contrast by a factor of two would also decrease the visual acuity by roughly a factor of 1.4.18 We suspect that the one hundred-peso bill’s background color and serial numbers have the best contrast among the peso bill denominations, minimizing the effect on near visual acuity measurement.
We used the Lin’s concordance correlation coefficient and the Bland-Altman plot to assess the agreement between the Philippine peso bill and Jaeger chart. The Lin’s concordance correlation coefficient was developed in order to evaluate if a new assay can reproduce the same results based on a traditional gold standard assay. This offsets the limitations set by other methods such as failure to detect any departure from the 45° line, failure to detect poor agreement in paired data, and failure to detect departure from intercept equal to zero and slope equal to one. With an attained concordance correlation coefficient value of 0.9505, it is highly likely to achieve the same results and findings if this study is replicated.19
The Bland-Altman plot detected a mean bias favoring the Philippine peso bill. This is consistent with the results of a study done by Tofigh, which showed that the smartphone application, EyeHandBook, overestimated the near visual acuity scores as compared to the conventional near vision card. They suspect that the high contrast and brightness levels of the smartphone’s high-definition screen were factors accounting for such results.9 In our case, the lack of representation of Jaeger scores J2 and J3 in the Philippine peso bill and the accumulated scores from the non-presbyopic group may have caused this anomaly. In order to validate this claim, a subgroup analysis of the scores of the presbyopics (Figure 10) was done revealing a mean bias of 0.06 logMAR units that is greater than the initial amount of 0.04 logMAR units. This indicates that the overestimation may be due to a different factor. We surmise that the contrast between the background color and the serial numbers of the Philippine peso bill may have brought about this outcome.
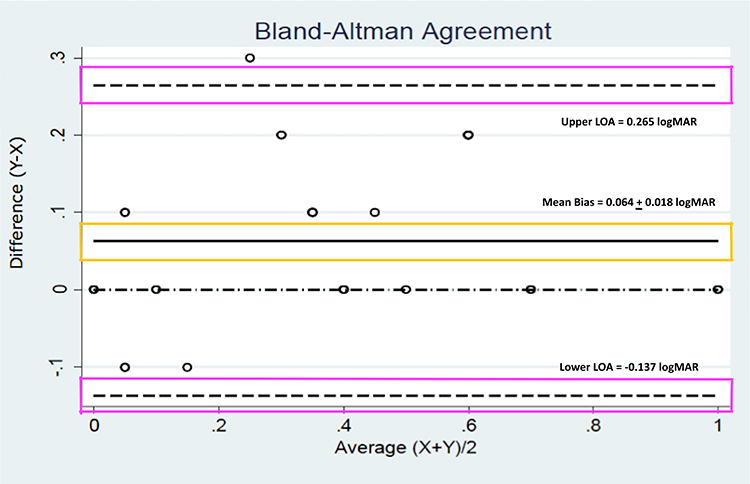 |
Figure 10 Bland-Altman plot comparing Philippine peso bill visual acuity measurements with the standard Jaeger for near visual acuity of those more than or equal to 40 years old. The mean bias (yellow box) and 95% limits of agreement (purple boxes) are labeled. LOA, limits of agreement. logMAR, Logarithm of the Minimum Angle of Resolution. |
This study showed that the Philippine peso bill is comparable to a Jaeger chart in testing near visual acuity. However, this study did not measure the sensitivity and specificity of the peso bill as a screening tool. The use of an ETDRS chart in assessing the reliability or accuracy of visual acuity measurement when compared to the peso bill was also not done. The ETDRS chart has been utilized as the reference standard in most clinical trials to validate alternative visual acuity charts by converting measurements into logMAR form.20 It was decided by the investigators that the agreement between both measures had to be established first prior to pursuing further analysis. The applicability of this method in telemedicine consults has also not been evaluated. Other variables that need to be considered are various denominations of Philippine peso bills, figure-ground interference of the peso bill, environmental conditions that can affect telemedicine consults, and coexisting ocular diseases or physical disabilities. Nevertheless, the purpose of the investigators was to pave the way to generate more studies related to readily available materials such as the Philippine peso bill.
We recommend testing in a tele-ophthalmology set-up to streamline the procedure of near vision examination. Both eyes should be tested with supervision from a guardian or companion who will make sure that the reading distance of 14 inches is maintained and that the serial numbers identified are accurate. Foreseeing the possibility of recall bias, we suggest that two Philippine peso bills must be used. We also recommend testing near vision using other Philippine peso bill denominations. Lastly, it would be beneficial to compare this method to a more reliable control such as the ETDRS chart as well as other near vision devices or applications that are currently available in the market.
The findings in this study may be used to benefit local ophthalmologists in giving an objective near visual acuity assessment of their telemedicine patients. Having proven that there is indeed a correlation between both the Philippine peso bill and the Jaeger chart, exploring its accuracy in assessing near visual acuity and testing its applicability in the telemedicine setting would be the next phase of this research.
Conclusion
The Philippine peso bill shows promise and potential as a measuring tool for near vision. It is a readily available device that is accessible, technology independent, and applicable to various cognitive abilities. However, there is a tendency to overestimate the scores obtained using this measuring tool. Future studies are still needed to validate the results in a tele-ophthalmology setting.
Ethics Approval and Consent to Participate
This study was performed in accordance with the Declaration of Helsinki and was submitted for ethical evaluation to the UERMMMCI Research Institute for Health Sciences Ethics Review Committee. It was conducted upon approval (RIHS ERC Code: 0905/H/2020/133, April 21, 2021).
Acknowledgments
We would like to extend our deepest gratitude to Dr. Ma. Penafrancia Adversario, MSPH of the Department of Preventive Medicine in UERMMMCI for guiding and helping the researchers in the appropriate statistical analyses utilized in this study. We would also like to recognize the efforts of Dr. Eric Constantine Valera, DPBO, MSHE of the Department of Microbiology in UERMMMCI and Dr. Robert Edward Ang, DPBO of Asian Eye Institute for their constructive feedbacks that helped improve this study.
Funding
The publishing charges were sponsored by UERMMMCI. No other source of funding was received for this study.
Disclosure
Lee Jerome Briones, James Paul Gomez, and Edgar Felipe Leuenberger declare that they have no conflicts of interest whether financial or non-financial in this work.
References
1. Strata Decision Technology. Analysis: ophthalmology lost more patient volume due to Covid-19 than any other specialty; 2020. Available from: https://eyewire.news/articles/analysis-55-percent-fewer-americans-sought-hospital-care-in-march-april-due-to-covid-19/.
2. The Council of State Governors. Covid-19 resources for state leaders; 2020. Available from: https://web.csg.org/covid19/executive-orders/.
3. Parke DWII. Ophthalmology after coronavirus disease 2019 (COVID-19): transition back to patient care. JAMA Ophthalmol. 2020;138:599–600. doi:10.1001/jamaophthalmol.2020.2004
4. Azarcon C, Ranche F, Santiago D. Tele-ophthalmology practices and attitudes in the Philippines in light of the COVID-19 pandemic: a survey. Clin Ophthalmol. 2021;15:1239–1247. doi:10.2147/OPTH.S291790
5. Thirunavukarasu A, Utukuri M, Mullinger D, Allen L. DigiVis: a digital, home-based visual acuity test to support remote consultations and vision screening; 2021. Available from: http://dx.doi.org/10.13140/RG.2.2.30597.27364/.
6. Bastawrous A, Rono H, Livingstone I, et al. Development and validation of a smartphone-based visual acuity test (peak acuity) for clinical practice and community-based fieldwork. JAMA Ophthalmol. 2015;133:930–937. doi:10.1001/jamaophthalmol.2015.1468
7. Srinivasan K, Ve R, Noushad B, et al. Efficacy of a remote based computerized visual acuity measurement. Br J Ophthalmol. 2012;96:987–990. doi:10.1136/bjophthalmol-2012-301751
8. American Academy of Ophthalmology. Performing the near acuity test; 2019. Available from: https://store.aao.org/media/resources/17201986/OMA6e114115.pdf.
9. Tofigh S, Shortridge E, Elkeeb A, et al. Effectiveness of a smartphone application for testing near visual acuity. Eye. 2015;29:1464–1468. doi:10.1038/eye.2015.138
10. Holladay J. Proper method of calculating average visual acuity. J Cataract Refract Surg J. 1997;13:388–391. doi:10.3928/1081-597X-19970701-16
11. Browne RH. On the use of a pilot sample for sample size determination. Stat Med. 1995;14:1933–1940. doi:10.1002/sim.4780141709
12. Miller J, Jang H, Ramesh D, et al. Telemedicine distance and near visual acuity tests for adults and children. J Am Assoc Pediatr Ophthalmol Strabismus. 2020;24:235–236. doi:10.1016/j.jaapos.2020.06.003
13. Bujger Z, Picman J, Lukenda A, et al. Standardization of optotypes. Lijec Vjesn. 2010;132:252–256.
14. Green J. Notes on the clinical determination of the acuteness of vision including the construction and graduation of optotypes. Trans Am Ophthalmol Soc. 1905;10:644–654.
15. Bailey I, Lovie J. New design principles for visual acuity letter charts. Am J Optom Physiol Opt. 1976;53:740–745. doi:10.1097/00006324-197611000-00006
16. Ferree C, Rand G. Intensity of light in relation to the examination of the eye. Br J Ophthalmol. 1936;20:331. doi:10.1136/bjo.20.6.331
17. Middleton W. Photometric discrimination with a diffuse boundary. J Opt Soc Am. 1937;27:112. doi:10.1364/JOSA.27.000112
18. Rubin G. Visual acuity and contrast sensitivity. Retina. 2013;11:300–306.
19. Lin L. A concordance correlation coefficient to evaluate reproducibility. Biometrics. 1989;45:255–268. doi:10.2307/2532051
20. Tiraset N, Poonyathalang A, Padungkiatsagul T, et al. Comparison of visual acuity measurement using three methods: standard ETDRS chart, near chart and a smartphone-based eye chart application. Clin Ophthalmol. 2021;15:859–869. doi:10.2147/OPTH.S304272
 © 2022 The Author(s). This work is published and licensed by Dove Medical Press Limited. The
full terms of this license are available at https://www.dovepress.com/terms
and incorporate the Creative Commons Attribution
- Non Commercial (unported, 3.0) License.
By accessing the work you hereby accept the Terms. Non-commercial uses of the work are permitted
without any further permission from Dove Medical Press Limited, provided the work is properly
attributed. For permission for commercial use of this work, please see paragraphs 4.2 and 5 of our Terms.
© 2022 The Author(s). This work is published and licensed by Dove Medical Press Limited. The
full terms of this license are available at https://www.dovepress.com/terms
and incorporate the Creative Commons Attribution
- Non Commercial (unported, 3.0) License.
By accessing the work you hereby accept the Terms. Non-commercial uses of the work are permitted
without any further permission from Dove Medical Press Limited, provided the work is properly
attributed. For permission for commercial use of this work, please see paragraphs 4.2 and 5 of our Terms.