Back to Journals » Diabetes, Metabolic Syndrome and Obesity » Volume 15
The Perirenal Fat Thickness Was Associated with Nonalcoholic Fatty Liver Disease in Patients with Type 2 Diabetes Mellitus
Authors Yang Y , Li S, Xu Y , Ke J, Zhao D
Received 22 January 2022
Accepted for publication 27 April 2022
Published 11 May 2022 Volume 2022:15 Pages 1505—1515
DOI https://doi.org/10.2147/DMSO.S350579
Checked for plagiarism Yes
Review by Single anonymous peer review
Peer reviewer comments 2
Editor who approved publication: Prof. Dr. Antonio Brunetti
Yuxian Yang,* Shuting Li,* Yuechao Xu, Jing Ke, Dong Zhao
Center for Endocrine Metabolism and Immune Diseases, Beijing Luhe Hospital, Capital Medical University, Beijing, People’s Republic of China
*These authors contributed equally to this work
Correspondence: Jing Ke; Dong Zhao, Email [email protected]; [email protected]
Purpose: Obesity is an important risk factor for nonalcoholic fatty liver disease (NAFLD). Perirenal fat and paranephric fat were seldom studied in NAFLD. We aimed to explore the relationship between perirenal fat thickness (PrFT) and paranephric fat thickness (PnFT) and NAFLD in patients with type 2 diabetes mellitus (T2DM).
Patients and Methods: A total of 493 diabetic patients including 231 NAFLD patients were enrolled in our study from September 2019 to December 2020. Patients with NAFLD were categorized into three subgroups according to the severity and fibrosis risk of NAFLD. Anthropometric indices and clinical characteristics were collected from clinical records. PrFT and PnFT were measured via ultrasound. Multivariate logistic regression analysis was used to assess the association between PrFT, PnFT and presence, severity and advanced fibrosis risk of NAFLD.
Results: Compared with non-NAFLD patients, those with NAFLD had significantly higher PrFT and PnFT. The PrFT and PnFT were independently associated with presence of NAFLD and the PrFT was independently associated with the advanced fibrosis risk of NAFLD after adjusting confounding factors.
Conclusion: The PrFT was independently associated with the presence and advanced fibrosis risk of NAFLD in patients with T2DM.
Keywords: nonalcoholic fatty liver disease, perirenal fat thickness, paranephric fat thickness, type 2 diabetes mellitus
Introduction
Nonalcoholic fatty liver disease (NAFLD), characterized by excessive fat accumulation in the liver, is the most common chronic liver disease. The global prevalence of NAFLD is estimated at 25%,1 among which 35.5% in China.2 Initially, NAFLD was considered as a relatively benign disease, but a minority of patients can progress to more severe stages such as cirrhosis, hepatocellular carcinoma, leading to liver failure and even liver transplantation.3 As a result, NAFLD has rapidly become a health-care burden to the society.1,4 While there is no valid treatment for NAFLD.5
NAFLD has been recognized as hepatic manifestation of metabolic syndrome, closely related to type 2 diabetes mellitus (T2DM), visceral obesity and insulin resistance.6,7 NAFLD is associated with an approximate doubling of risk of T2DM.8 The global prevalence of NAFLD among patients with T2DM ranges from 55.5% to 59.7%.9,10 Patients with NAFLD and T2DM also have a higher risk of progressing nonalcoholic steatohepatitis, suggesting there is a bidirectional interplay between NAFLD and T2DM.11
It is well established that obesity increases the risk of NAFLD.12–16 The obesity indices in clinical studies included BMI,12,13 waist circumference14 and visceral obesity.15,16 However, not all obese patients develop NAFLD and, more importantly, NAFLD can occur in nonobese and even lean individuals, especially in Asian populations. Previous study indicated that 40% of global NAFLD patients were non-obese and approximately 20% were lean.17 It is reported that the majority of lean NAFLD patients were characteristic of excess visceral adiposity and insulin resistance.18,19 It is suggested that high visceral-to-subcutaneous fat ratio values predicted increased NAFLD risk.20 Chiyanika C conducted one study using prospectively acquired data and suggested that increased visceral adipose tissue (VAT) may be a vital driver to the development of NAFLD irrespective of BMI category.16 In addition, there is an established relationship between visceral fat and liver steatosis.21 In a large cohort study, larger areas of VAT were associated with higher risk of incident NAFLD. While larger areas of SAT were associated with regression of NAFLD.15
As part of visceral fat, perirenal fat is an ectopic fat pad located in the retroperitoneal space, surrounding the kidneys.22 Perirenal fat, wrapped by a complete renal fascia, has a complete system of blood supply, lymph fluid drainage and innervation. All this makes perirenal fat like an internal organ. As a mixture of brown adipose tissue (BAT) and white adipose tissue (WAT), perirenal fat can synthesis and secrete many adipokines, such as leptin, adiponectin and so on. While paranephric fat lies posterolaterally to each kidney and is anatomically adjacent to perirenal fat. In addition, paranephric fat is not wrapped by renal fascia and is relatively farther and forms the final layer of fat and fasciae associated with the kidney.23 Histologically speaking, paranephric fat is a typical WAT depot, while perirenal fat is a mixture of WAT and BAT. Several studies demonstrated that accumulation of perirenal fat and para-perirenal fat were associated with renal function, atherosclerosis and cardiovascular disease.24–26 However, studies about the relationship between perirenal fat and paranephric fat and NAFLD are limited. One study involved 286 patients in Japan revealed that measurement of para- and perirenal sonographic fat thickness is positively associated with fatty liver grade.27 Therefore, this study aimed to explore the relationship between the perirenal fat and paranephric fat and presence, severity and fibrosis risk of NAFLD in patients with T2DM, respectively.
Materials and Methods
Study Population and Study Design
We enrolled 493 patients with T2DM, who hospitalized at the Center for Endocrine Metabolism and Immune Disease Center at Beijing Luhe Hospital, Capital Medical University from September 2019 to December 2020. The diagnosis of T2DM was defined according to 1999 World Health Organization Criteria,28 which including fasting blood glucose ≥7.0 mmol/L and/or 2-hour blood glucose during a 75-g oral glucose tolerance test (OGTT) ≥11.1 mmol/L. The study protocol conformed to the ethical guidelines of the 1975 Declaration of Helsinki (6 th revision, 2008) as reflected in a priori approval by the institution’s human research committee. The study protocol was approved by the Ethics Review Committee of Beijing Luhe Hospital. Informed consent was obtained from each patient included in the study.
Diagnosis, Severity and Advanced Fibrosis Risk of NAFLD
Each subject underwent abdominal ultrasonography by an experienced clinician who was blinded to the clinical presentation and laboratory results. Fatty liver was identified by characteristic echo patterns including a diffuse increase in the echogenicity of the liver compared to that of the spleen or kidney, according to ultrasonographic liver features and by reference to well-established criteria for the assessment and management of NAFLD in China.29 Patients were excluded if they met the following criteria: with known secondary etiologies of hepatic fat accumulation such as excessive alcohol intake (> 20 g/day for women and > 30 g/day for men),30 long-term use of steatogenic medications (such as corticosteroids, methotrexate, amiodarone and tamoxifen), virus hepatitis, monogenic hereditary disorders, autoimmune hepatitis, drug-induced liver disease, severe malnutrition and Wilson Disease. Furthermore, fatty liver was graded as mild, moderate and severe by total scores of 2, 3–4 and 5, respectively, with the scoring criteria31 as: ① liver size: normal = 0, enlarged = 1; ② edge angle of liver: acute = 0, obtuse = 1; ③ parenchyma echo: normal (equal to the spleen) = 0, enhanced = 1, enhanced with far-field attenuation = 2; and ④ vessel display: clear = 0, unclear = 1. The fibrosis risk of NAFLD were commonly evaluated by NAFLD fibrosis score and FIB4 score. The advanced fibrosis risk of NAFLD is estimated by NAFLD fibrosis score:32 NAFLD fibrosis score = −1.675 + 0.037 × age (years) + 0.094 × BMI (kg/m2) + 1.13 × IFG/diabetes (yes = 1, no = 0) + 0.99 × AST/ALT ratio - 0.013 × platelet (x109/l) - 0.66 × albumin (g/dl). The cutoffs NAFLD fibrosis score for absence, intermediate, and presence of advanced fibrosis were <-1.455, −1.455 to 0.676, and > 0.676, respectively. Using the two cutoff points, the absence and presence of advanced fibrosis could be detected with high accuracy (negative predictive value of 93%, positive predictive value of 90%). The FIB-4 score formula is (Age × AST)/(Plts x (sqr (ALT)). The cutoffs for low, intermediate, and high probability of advanced fibrosis were <1.3, 1.3 to 2.67, and >2.67, respectively.33
Anthropometric Measurements and Laboratory Data
The clinical characteristics and anthropometric indices including age, gender, alcohol consumption, height, weight, systolic blood pressure (SBP) and diastolic blood pressure (DBP) were collected through the medical records of each subject. The BMI was calculated as weight divided by the square of height (kg/m2). The measure of perirenal fat thickness (PrFT) and paranephric fat thickness (PnFT) were measured via ultrasound. An auto-biochemical analyzer (Roche/Hitachi Cobas C501, Roche Diagnostic Corp., Indianapolis) was employed to determine the fasting blood glucose (FBG), serum concentrations of total cholesterol (TC), triglyceride (TG), low-density lipoprotein cholesterol (LDL-c), high-density lipoprotein cholesterol (HDL-c), alanine aminotransferase (ALT), Aspartate aminotransferase (AST), blood creatinine (Cr), blood urea nitrogen (BUN), serum uric acid (SUA). Glycosylated hemoglobin (HbA1c) was quantified using high performance liquid chromatography (HPLC) with a D10 set (Bio-RAD, Hercules, California).
Measurement of Perirenal Fat Thickness and Paranephric Fat Thickness
The measure of PrFT and PnFT were performed as previously described by our team.25 Briefly, PrFT and PnFT were measured by a single skilled operator, using a duplex Doppler apparatus (Model Preirus, HITACHI), with patients in the supine position. The operator was blind to the clinical data of all subjects. The probe was held vertical to the skin on the lateral aspects of the abdomen to obtain the optimal position. The pressure of the probe on the skin surface was as small as possible to prevent the fat layer from being compressed. The PrFT was determined from the renal fascia to the surface of the kidney. The PnFT was then determined from the inner side of the abdominal musculature to the renal fascia (Figure S1). The average of the ultrasound measurement values on both sides was defined as PrFT and PnFT.
Statistics
The statistical analysis was performed using statistical package R (version 3.5.2, available from http://www.r-project.org). Normal distribution of continuous variables was detected using histogram or Q-Q plot. Nearly normally distributed continuous variables were presented as mean ± standard derivation and the differences were compared by student’s t test. Categorical variables were presented as frequencies (proportions) and compared by Chi-square test. Tertiles of PrFT and PnFT were calculated. Univariate and Multivariate logistic regression analysis were used to evaluate the relationship between the PrFT and PnFT and presence, severity and advanced fibrosis risk of NAFLD in patients with T2DM, adjusting potential confounding variables. P values < 0.05 were considered statistically significant.
Results
A total of 493 patients with T2DM were enrolled in our study. The mean age is 57.63 ± 14.92 years and 48.7% of the patients were females. All the patients were classified into NAFLD group (n= 231) and Non-NAFLD group (n= 262) according the ultrasound imaging. The NAFLD group was further classified into mild (n= 128), moderate (n= 80) and severe group (n= 23) based on the ultrasound imaging by the same person.
The Clinical and Metabolic Characteristics of the Study Population
The clinical and the metabolic characteristics of the study population stratified by the presence and severity of NAFLD are shown in Table 1. We found that the presence and more severe NAFLD were prone to occurring in younger people (P < 0.001). In addition, the BMI, DBP, PrFT, PnFT, ALT and AST increased according the presence and progression of NAFLD. The BUN, HDL-c decreased according the presence and progression of NAFLD. While no differences were noted in gender, SBP, albumin, HbA1c, Cr, TC, the prevalence of current smoke, current drink, coronary heart disease and cerebrovascular disease among groups (Table 1).
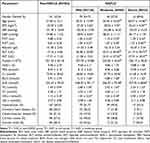 |
Table 1 The General Clinical Characteristics of the Study Population According the Presence and Severity of NAFLD |
The Association of PrFT and PnFT with Presence of NAFLD
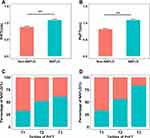
Compared to non-NAFLD patients, those with NAFLD had significantly higher PrFT (1.08 cm vs 0.88 cm, P < 0.001, Figure 1A) and PnFT (1.09 cm vs 0.81 cm, P < 0.001, Figure 1B). When all patients were divided into three groups according to tertiles of PrFT and PnFT value, the data showed that the prevalence of NAFLD increased with the increased PrFT and PnFT (Figure 1C and D). To further explore the association between PrFT and PnFT and NAFLD, we conducted univariate and multivariate logistic regression analysis. Univariable logistic regression demonstrated that gender, age, BMI, waist circumference, DBP, AST, ALT, platelet, Cr, BUN, SUA, TG, HDL-c, LDL-c were significantly associated with the presence of NAFLD (Table S1). In the multivariate logistic regression, both higher PrFT (OR = 2.15, P = 0.012, Table 2) and PnFT (OR = 2.76, P = 0.006, Table 2) were independently associated with higher odds for NAFLD after adjusting age, gender, BMI, waist circumference, DBP, drink, TG, TC, HDL-c, LDL-c and HbA1c (Table 2).
 |
Table 2 Independent Effect of Perirenal Fat Thickness and Paranephric Fat Thickness on the Presence of NAFLD |
The Association of PrFT and PnFT with Severity of NAFLD
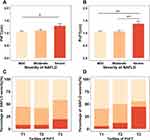
To further explore the PrFT and PnFT with the severity of NAFLD, patients with NAFLD were further stratified into three subgroups including mild, moderate and severe group. We found that patients with severe NAFLD had higher PrFT and PnFT than mild NAFLD (P = 0.026 and P < 0.001, Figure 2A and B, respectively). In addition, we also compared the proportion of severity of NAFLD according to the tertiles of PrFT and PnFT. The proportion of severe NAFLD did not increase according the tertiles of PrFT (P = 0.144, Figure 2C), but increased according the tertiles of PnFT (P = 0.016, Figure 2D). Univariable logistic regression demonstrated that age, BMI, waist circumference, DBP, AST, ALT, platelet, FBG, BUN, HDL-c were significantly associated with the severity of NAFLD (Table S2). Subsequently, we conducted multivariate logistic regression to assess the independent effect of PrFT and PnFT on the severity of NAFLD. Our results revealed that higher PrFT and PnFT were significantly associated with high risk of severe NAFLD (OR = 8.42, P = 0.002, OR = 8.96, P = 0.002, respectively, Table 3) after adjusting age, gender, DBP, HDL-c and FBG. However, when further adjusting for obesity parameters such as BMI and waist circumference, both PrFT and PnFT were not associated with high risk of severe NAFLD (OR = 3.60, P = 0.093, OR =3.54, P = 0.093, respectively, Table 3).
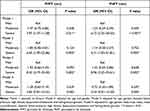 |
Table 3 Independent Effect of Perirenal Fat Thickness and Paranephric Fat Thickness on the Severity of NAFLD |
The Association of PrFT and PnFT with Advanced Fibrosis Risk of NAFLD
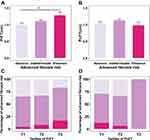
To investigate the relationship between PrFT and PnFT and the advanced fibrosis risk of NAFLD. All the NAFLD patients were divided into three subgroups according to the NAFLD fibrosis score (absence of advanced fibrosis, indeterminate of advanced fibrosis, presence of advanced fibrosis). We found that PrFT was positively associated with NAFLD fibrosis score (r = 0.198, P = 0.003), but the PnFT was not associated with NAFLD fibrosis score (r = 0.038, P = 0.575). In addition, PrFT was higher in NAFLD patients with advanced fibrosis risk than those without advanced fibrosis risk (P = 0.022, Figure 3A). This trend is not obvious about PnFT in NAFLD patients with different fibrosis risk (Figure 3B). However, there is no obvious difference in the percentage of advanced fibrosis risk of NAFLD in the three groups according to the tertiles of PrFT and PnFT (P = 0.107 and P = 0.074, respectively, Figure 3C and D). Univariate logistic regression found that age, BMI, waist circumference, SBP, DBP, albumin, AST, ALT, platelet, FBG, Cr, BUN, TC, LDL-c, prevalence of hypertension, coronary heart disease and cerebrovascular disease were significantly associated with the advanced fibrosis risk of NAFLD (Table S3). Furthermore, we conducted multivariate logistic regression to assess the independent effect of PrFT and PnFT on the presence of advanced fibrosis risk in NAFLD patients. We revealed that increased PrFT was independently associated with advanced fibrosis risk in NAFLD patients (OR = 9.1, P = 0.035, Table 4) after adjusting age, gender, BMI, waist circumference, hypertension, FBG, TC and LDL-c. While the higher PnFT was not independently associated with advanced fibrosis risk in NAFLD patients (OR = 1.85, P = 0.592, Table 4) after adjusting age, gender, BMI, waist circumference, hypertension, FBG, TC and LDL-c. We also evaluated the fibrosis risk of NAFLD using the FIB4 score, but the sample of NAFLD patients with high probability of advanced fibrosis is very small. We combined the NAFLD patients with intermediate and high probability of advanced fibrosis into one group named intermediate-high group. The was no independent relationship between PrFT, PnFT and fibrosis risk of NAFLD evaluated by FIB4 score. The univariate and multivariate logistic regression were shown in supplemental materials (Tables S4 and S5).
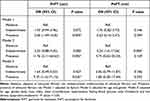 |
Table 4 Independent Effect of Perirenal Fat Thickness and Paranephric Fat Thickness on the Fibrosis Risk of NAFLD Evaluated by NAFLD Fibrosis Score |
Discussion
Obesity is a well-known risk factor for development of NAFLD.12,13 Increasing evidence indicated that the visceral fat, especially ectopic fat surrounding internal organs, appears to be a more important indicator of metabolic disturbances. However, as part of visceral fat, perirenal fat and paranephric fat were seldom studied in relation to the association with NAFLD and T2DM. The results of the present study show that both the PrFT and PnFT were independently associated with the presence of NAFLD. In addition, PrFT was also independently associated with the advanced fibrosis risk of NAFLD in patients with T2DM.
In our study, we found that NAFLD patients had significantly higher PrFT and PnFT than Non-NAFLD patients, which was consistent with previous study.34 We revealed that both PrFT and PnFT were independently associated with presence of NAFLD after adjusting confounding factors. Similarly, Nicola Vitturi concluded that perirenal fat and paranephric fat were related to the presence of NAFLD after adjusting for age, sex and waist circumference in logistic regression.34 Satsuki Kawasaki investigated the usefulness of para- and perirenal sonographic fat thickness (UFT) for quantitative estimation of fatty liver in patients with T2DM and reported a positive correlation between UFT and fatty liver infiltration.27 Thus, measurement of UFT or PrFT in our study maybe useful methods for the quantification of fatty liver. PrFT and PnFT, surrounding the kidneys, were ectopic fat in the abdominal cavity and parts of visceral fat. A number of studies have explored the relationship between visceral fat and NAFLD. Chan-Hee Jung conducted a cross-sectional study including 7465 Korean adults and reported that high visceral-to-subcutaneous fat ratio values predicted increased risk for NAFLD.20 Chiyanika C suggested that VAT may be a vital driver of NAFLD based on a prospectively acquired data.16 Another large cohort study indicated that VAT was longitudinally associated with higher risk of incident NAFLD.15 In terms of severity of NAFLD, we did not get positive result about PrFT, PnFT and NAFLD. However, previous study has reported that para- and perirenal sonographic fat thickness is positively associated with fatty liver infiltration.27 In our study, although 231 patients with NAFLD, only 23 (10%) NAFLD patients were classified into severe group. The relative low proportion of severe group may partly explain this negative result. Larger sample in the future study is needed and necessary to confirm the results.
Our study also found that the PrFT was independently associated with the advanced fibrosis risk of NAFLD. Previous studies revealed that presence of diabetes, abdominal obesity, increased waist circumferences, higher AST or ALT levels, higher VAT area, and C-peptide levels were independent risk factors associated with liver fibrosis.20,35–39 However, a systematic review and meta-analysis study including 13 studies with a total of 11,043 participants concluded that obesity may not be an independent factor for advanced fibrosis in NAFLD patients.40 The obesity standard based on BMI in the 13 studies may partly explain this result. Therefore, central or visceral obesity, instead of generalized obesity maybe more closely related to the advanced fibrosis risk of NAFLD.
The mechanisms underlying the association between PrFT or PnFT and the presence, severity and fibrosis risk of NAFLD are not fully studied yet. But, some plausible explanations about visceral fat on NAFLD have been proposed. One main mechanism is that excess visceral fat was prone to lipolysis, resulting in increased free fatty acids and TG accumulation in the liver. All above may activate NF-kB pathway and increase diacylglycerol (DAG) content in the liver,41 which induce chronic inflammation, hepatic insulin resistance and hepatic steatosis.42,43 Another possible mechanism is that lipid accumulation leads to adipocytes death and dysfunction, producing more inflammatory adipokines and cytokines, such as interleukin 6 and tumor necrosis factor-alpha, which promoting NAFLD progression and fibrosis.43–45 In summary, insulin resistance, chronic inflammation and lipotoxicity were involved in the pathogenesis of NAFLD progression.46–52
Some limitations existed in this study. First of all, this study was a single center study and sample was relatively small, limiting the generalization of our findings in other population. Larger sample in the future study is needed and necessary. Secondly, this was a cross-sectional study, it is difficult to ascertain a causal relationship between PrFT and PnFT and NAFLD. Further studies are needed to illuminate the mechanism of PrFT and PnFT and NAFLD.
Conclusion
We found that both the PrFT and PnFT were independently associated with the presence of NAFLD after adjusting confounding factors and the PrFT was independently associated with the advanced fibrosis risk of NAFLD after adjusting confounding factors in patients with T2DM. The measure of the PrFT maybe a useful tool to reflect the development and progression of NAFLD in clinical practice.
Data Sharing Statement
Data used to support the findings of this study is available from the Dong Zhao upon request.
Acknowledgments
We sincerely thank the patients who participated in our study. We thank the doctors, nurses, and medical technicians involved in blood collection and clinical parameter measurement.
Funding
This research did not receive any specific grant from funding agencies in the public, commercial, or not-for-profit sectors.
Disclosure
The authors declare that there is no conflict of interest regarding the publication of this article.
References
1. Younossi ZM, Koenig AB, Abdelatif D, Fazel Y, Henry L, Wymer M. Global epidemiology of nonalcoholic fatty liver disease-meta-analytic assessment of prevalence, incidence, and outcomes. Hepatology. 2016;64(1):73–84. doi:10.1002/hep.28431
2. Lu ZY, Shao Z, Li YL, Wulasihan M, Chen XH. Prevalence of and risk factors for non-alcoholic fatty liver disease in a Chinese population: an 8-year follow-up study. World J Gastroenterol. 2016;22(13):3663–3669. doi:10.3748/wjg.v22.i13.3663
3. Lee C, Kim J, Jung Y. Potential therapeutic application of estrogen in gender disparity of nonalcoholic fatty liver disease/nonalcoholic steatohepatitis. Cells. 2019;8(10):1259. doi:10.3390/cells8101259
4. Hou XH, Zhu YX, Lu HJ, et al. Non-alcoholic fatty liver disease’s prevalence and impact on alanine aminotransferase associated with metabolic syndrome in the Chinese. J Gastroenterol Hepatol. 2011;26(4):722–730. doi:10.1111/j.1440-1746.2010.06509.x
5. Jump DB, Lytle KA, Depner CM, Tripathy S. Omega-3 polyunsaturated fatty acids as a treatment strategy for nonalcoholic fatty liver disease. Pharmacol Ther. 2018;181:108–125. doi:10.1016/j.pharmthera.2017.07.007
6. Stefan N, Haring HU, Cusi K. Non-alcoholic fatty liver disease: causes, diagnosis, cardiometabolic consequences, and treatment strategies. Lancet Diabetes Endocrinol. 2019;7(4):313–324. doi:10.1016/S2213-8587(18)30154-2
7. Polyzos SA, Kountouras J, Mantzoros CS. Obesity and nonalcoholic fatty liver disease: from pathophysiology to therapeutics. Metabolism. 2019;92:82–97. doi:10.1016/j.metabol.2018.11.014
8. Mantovani A, Byrne CD, Bonora E, Targher G. Nonalcoholic fatty liver disease and risk of incident type 2 diabetes: a meta-analysis. Diabetes Care. 2018;41(2):372–382. doi:10.2337/dc17-1902
9. Younossi ZM, Golabi P, de Avila L, et al. The global epidemiology of NAFLD and NASH in patients with type 2 diabetes: a systematic review and meta-analysis. J Hepatol. 2019;71(4):793–801. doi:10.1016/j.jhep.2019.06.021
10. Dai W, Ye L, Liu A, et al. Prevalence of nonalcoholic fatty liver disease in patients with type 2 diabetes mellitus: a meta-analysis. Medicine. 2017;96(39):e8179. doi:10.1097/MD.0000000000008179
11. Bril F, Cusi K. Management of nonalcoholic fatty liver disease in patients with type 2 diabetes: a call to action. Diabetes Care. 2017;40(3):419–430. doi:10.2337/dc16-1787
12. Xing J, Guan X, Zhang Q, Chen S, Wu S, Sun X. Triglycerides mediate body mass index and nonalcoholic fatty liver disease: a population-based study. Obes Facts. 2021;14(2):190–196. doi:10.1159/000514848
13. Lin YC, Chang PF, Liu K, Chang MH, Ni YH. Predictors for incidence and remission of nonalcoholic fatty liver disease in obese children and adolescents. J Formos Med Assoc. 2022;121(1 Pt 1):36–42. doi:10.1016/j.jfma.2021.01.004
14. Zhou X, Li Y, Zhang X, et al. Independent markers of nonalcoholic fatty liver disease in a gentrifying population-based Chinese cohort. Diabetes Metab Res Rev. 2019;35(5):e3156. doi:10.1002/dmrr.3156
15. Kim D, Chung GE, Kwak MS, et al. Body fat distribution and risk of incident and regressed nonalcoholic fatty liver disease. Clin Gastroenterol Hepatol. 2016;14(1):132–138 e134. doi:10.1016/j.cgh.2015.07.024
16. Chiyanika C, Wong VW, Wong GL, et al. Implications of abdominal adipose tissue distribution on nonalcoholic fatty liver disease and metabolic syndrome: a Chinese general population study. Clin Transl Gastroenterol. 2021;12(2):e00300. doi:10.14309/ctg.0000000000000300
17. Ye Q, Zou B, Yeo YH, et al. Global prevalence, incidence, and outcomes of non-obese or lean non-alcoholic fatty liver disease: a systematic review and meta-analysis. Lancet Gastroenterol Hepatol. 2020;5(8):739–752. doi:10.1016/S2468-1253(20)30077-7
18. Kechagias S, Nasr P, Blomdahl J, Ekstedt M. Established and emerging factors affecting the progression of nonalcoholic fatty liver disease. Metabolism. 2020;111S:154183. doi:10.1016/j.metabol.2020.154183
19. Kim D, Kim WR. Nonobese fatty liver disease. Clin Gastroenterol Hepatol. 2017;15(4):474–485. doi:10.1016/j.cgh.2016.08.028
20. Jung CH, Rhee EJ, Kwon H, Chang Y, Ryu S, Lee WY. Visceral-to-subcutaneous abdominal fat ratio is associated with nonalcoholic fatty liver disease and liver fibrosis. Endocrinol Metab. 2020;35(1):165–176. doi:10.3803/EnM.2020.35.1.165
21. Item F, Konrad D. Visceral fat and metabolic inflammation: the portal theory revisited. Obes Rev. 2012;13(Suppl 2):30–39. doi:10.1111/j.1467-789X.2012.01035.x
22. Liu BX, Sun W, Kong XQ. Perirenal fat: a unique fat pad and potential target for cardiovascular disease. Angiology. 2019;70(7):584–593. doi:10.1177/0003319718799967
23. Raptopoulos V, Touliopoulos P, Lei QF, Vrachliotis TG, Marks SC
24. Shen FC, Cheng BC, Chen JF. Peri-renal fat thickness is positively associated with the urine albumin excretion rate in patients with type 2 diabetes. Obes Res Clin Pract. 2020;14(4):345–349. doi:10.1016/j.orcp.2020.06.006
25. Fang Y, Xu Y, Yang Y, Liu C, Zhao D, Ke J. The relationship between perirenal fat thickness and reduced glomerular filtration rate in patients with type 2 diabetes. J Diabetes Res. 2020;2020:6076145. doi:10.1155/2020/6076145
26. Bassols J, Martinez-Calcerrada JM, Prats-Puig A, et al. Perirenal fat is related to carotid intima-media thickness in children. Int J Obes. 2018;42(4):641–647. doi:10.1038/ijo.2017.236
27. Kawasaki S, Hasegawa O, Satoh S, Numata K, Terauchi Y. Sonographic assessment of fatty liver infiltration using the measurement of para- and perirenal fat thickness. J Clin Ultrasound. 2010;38(9):470–474. doi:10.1002/jcu.20736
28. Alberti KG, Zimmet PZ. Definition, diagnosis and classification of diabetes mellitus and its complications. Part 1: diagnosis and classification of diabetes mellitus provisional report of a WHO consultation. Diabet Med. 1998;15(7):539–553. doi:10.1002/(SICI)1096-9136(199807)15:7<539::AID-DIA668>3.0.CO;2-S
29. Gao X, Fan JG; Study Group of L, Metabolism CSoE. Diagnosis and management of non-alcoholic fatty liver disease and related metabolic disorders: consensus statement from the Study Group of Liver and Metabolism, Chinese Society of Endocrinology. J Diabetes. 2013;5(4):406–415. doi:10.1111/1753-0407.12056
30. European Association for the Study of the L, European Association for the Study of D, European Association for the Study of O. EASL-EASD-EASO clinical practice guidelines for the management of non-alcoholic fatty liver disease. J Hepatol. 2016;64(6):1388–1402. doi:10.1016/j.jhep.2015.11.004
31. Shen X, Jin C, Wu Y, et al. Prospective study of perceived dietary salt intake and the risk of non-alcoholic fatty liver disease. J Hum Nutr Diet. 2019;32(6):802–809. doi:10.1111/jhn.12674
32. Angulo P, Hui JM, Marchesini G, et al. The NAFLD fibrosis score: a noninvasive system that identifies liver fibrosis in patients with NAFLD. Hepatology. 2007;45(4):846–854. doi:10.1002/hep.21496
33. Kaswala DH, Lai M, Afdhal NH. Fibrosis assessment in Nonalcoholic Fatty Liver Disease (NAFLD) in 2016. Dig Dis Sci. 2016;61(5):1356–1364. doi:10.1007/s10620-016-4079-4
34. Vitturi N, Soattin M, De stefano F, et al. Ultrasound, anthropometry and bioimpedance: a comparison in predicting fat deposition in non-alcoholic fatty liver disease. Eat Weight Disord. 2015;20(2):241–247. doi:10.1007/s40519-014-0146-z
35. Shao C, Ye J, Li F, Feng S, Wang W, Zhong B. Different predictors of steatosis and fibrosis severity among lean, overweight and obese patients with nonalcoholic fatty liver disease. Dig Liver Dis. 2019;51(10):1392–1399. doi:10.1016/j.dld.2019.02.019
36. Mansour A, Mohajeri-Tehrani MR, Samadi M, et al. Risk factors for non-alcoholic fatty liver disease-associated hepatic fibrosis in type 2 diabetes patients. Acta Diabetol. 2019;56(11):1199–1207. doi:10.1007/s00592-019-01374-x
37. Kim Y, Chang Y, Cho YK, Ahn J, Shin H, Ryu S. Obesity and weight gain are associated with progression of fibrosis in patients with nonalcoholic fatty liver disease. Clin Gastroenterol Hepatol. 2019;17(3):543–550 e542. doi:10.1016/j.cgh.2018.07.006
38. Kim D, Kim W, Joo SK, et al. Predictors of nonalcoholic steatohepatitis and significant fibrosis in non-obese nonalcoholic fatty liver disease. Liver Int. 2019;39(2):332–341. doi:10.1111/liv.13983
39. Sookoian S, Pirola CJ. Systematic review with meta-analysis: the significance of histological disease severity in lean patients with nonalcoholic fatty liver disease. Aliment Pharmacol Ther. 2018;47(1):16–25. doi:10.1111/apt.14401
40. Lu FB, Hu ED, Xu LM, et al. The relationship between obesity and the severity of non-alcoholic fatty liver disease: systematic review and meta-analysis. Expert Rev Gastroenterol Hepatol. 2018;12(5):491–502. doi:10.1080/17474124.2018.1460202
41. Cusi K. Role of obesity and lipotoxicity in the development of nonalcoholic steatohepatitis: pathophysiology and clinical implications. Gastroenterology. 2012;142(4):711–725 e716. doi:10.1053/j.gastro.2012.02.003
42. Manco M, Bedogni G, Marcellini M, et al. Waist circumference correlates with liver fibrosis in children with non-alcoholic steatohepatitis. Gut. 2008;57(9):1283–1287. doi:10.1136/gut.2007.142919
43. Du Plessis J, van Pelt J, Korf H, et al. Association of adipose tissue inflammation with histologic severity of nonalcoholic fatty liver disease. Gastroenterology. 2015;149(3):635–648.e14. doi:10.1053/j.gastro.2015.05.044
44. van der Poorten D, Milner KL, Hui J, et al. Visceral fat: a key mediator of steatohepatitis in metabolic liver disease. Hepatology. 2008;48(2):449–457. doi:10.1002/hep.22350
45. Snel M, Jonker JT, Schoones J, et al. Ectopic fat and insulin resistance: pathophysiology and effect of diet and lifestyle interventions. Int J Endocrinol. 2012;2012:983814. doi:10.1155/2012/983814
46. Hui JM, Sud A, Farrell GC, et al. Insulin resistance is associated with chronic hepatitis C virus infection and fibrosis progression [corrected]. Gastroenterology. 2003;125(6):1695–1704. doi:10.1053/j.gastro.2003.08.032
47. Neuschwander-Tetri BA. Hepatic lipotoxicity and the pathogenesis of nonalcoholic steatohepatitis: the central role of nontriglyceride fatty acid metabolites. Hepatology. 2010;52(2):774–788. doi:10.1002/hep.23719
48. Milic S, Lulic D, Stimac D. Non-alcoholic fatty liver disease and obesity: biochemical, metabolic and clinical presentations. World J Gastroenterol. 2014;20(28):9330–9337. doi:10.3748/wjg.v20.i28.9330
49. Angulo P, Machado MV, Diehl AM. Fibrosis in nonalcoholic Fatty liver disease: mechanisms and clinical implications. Semin Liver Dis. 2015;35(2):132–145. doi:10.1055/s-0035-1550065
50. Huh JH, Kim KJ, Kim SU, et al. Obesity is more closely related with hepatic steatosis and fibrosis measured by transient elastography than metabolic health status. Metabolism. 2017;66:23–31. doi:10.1016/j.metabol.2016.10.003
51. Moon YA. The SCAP/SREBP pathway: a mediator of hepatic steatosis. Endocrinol Metab. 2017;32(1):6–10. doi:10.3803/EnM.2017.32.1.6
52. Boutari C, Perakakis N, Mantzoros CS. Association of adipokines with development and progression of nonalcoholic fatty liver disease. Endocrinol Metab. 2018;33(1):33–43. doi:10.3803/EnM.2018.33.1.33
 © 2022 The Author(s). This work is published and licensed by Dove Medical Press Limited. The full terms of this license are available at https://www.dovepress.com/terms.php and incorporate the Creative Commons Attribution - Non Commercial (unported, v3.0) License.
By accessing the work you hereby accept the Terms. Non-commercial uses of the work are permitted without any further permission from Dove Medical Press Limited, provided the work is properly attributed. For permission for commercial use of this work, please see paragraphs 4.2 and 5 of our Terms.

