")
Back to Journals » Patient Preference and Adherence » Volume 12
The perceived severity of a disease and the impact of the vocabulary used to convey information: using Rasch scaling in a simulated oncological scenario
Authors Burro R , Savardi U , Annunziata MA , De Paoli P , Bianchi I
Received 31 May 2018
Accepted for publication 8 November 2018
Published 3 December 2018 Volume 2018:12 Pages 2553—2573
DOI https://doi.org/10.2147/PPA.S175957
Checked for plagiarism Yes
Review by Single anonymous peer review
Peer reviewer comments 3
Editor who approved publication: Dr Johnny Chen
Roberto Burro,1 Ugo Savardi,1 Maria Antonietta Annunziata,2 Paolo De Paoli,2 Ivana Bianchi3
1Department of Human Sciences, University of Verona, 37129 Verona, Italy; 2National Cancer Institute IRCCS “Centro di Riferimento Oncologico” (CRO), 33080 Aviano (PN), Italy; 3Department of Humanities (section Philosophy and Human Sciences), University of Macerata, 62100 Macerata, Italy
Background: Healthcare staff should be aware of the importance that patients may attach to the words that are used to convey information. This is relevant in terms of the patients’ understanding. Modeling how people understand the information conveyed in a medical context may help health practitioners to better appreciate the patients’ approach.
Purpose: 1) Analyze the participants’ self-reported perception of the type of information provided in an oncological scenario in terms of three dimensions: impairment to their health, risks associated with the disease itself and commitment required to undergo the treatment; and 2) show the benefits of using Rasch scaling for the analysis of the data. Starting from a survey, Rasch scaling produces a unidimensional logit-interval scale relating to the extent to which each item conveys a latent dimension. These were related to structure, in particular concerning communication by means of opposite vs. unipolar language.
Subjects and methods: The participants rated 82 items of information in a questionnaire regarding their perception of impairment to their health (H) and the risks (R) and commitment relating to the treatment prescribed (T).
Results: The scaling produced an item bank for healthcare staff to consult in order to estimate the importance the recipient would be likely to attach to the vocabulary used and the likely impact of the information in terms of the patient’s condition. Furthermore, the use of opposites was generally associated with a clearer impression of whether the information given was generally only very negative or slightly negative, whereas ‘neutral’ information was often perceived as being very negative.
Actual findings: Is possible to estimate people’s understanding more precisely (in terms of H, R and T) which can help healthcare practitioners to modulate the way they convey information.
Limitations: The participants in the study were healthy volunteers and the context was simulated.
Keywords: Rasch model, simulated oncological scenario, perceived severity of impairment to health, perception of risk, perceived commitment to the treatment, opposites
Introduction
The WHO has defined the term “health” as “a state of complete physical, mental, and social well-being and not merely the absence of disease or infirmity” (July 22, 1946). Over the years, modern medicine has increasingly abandoned the biomedical model of patient care (mainly centered on the study of symptoms and laboratory tests) in favor of a bio-psychosocial model.1,2 Several studies3–5 have shown that when patients are more involved in and “better informed” about the treatment of their condition, they are better able to manage their treatment plan. However, in a medical context, defining what “well informed” means is not easy at all as it involves assessing not only what a doctor says but what “the patient understands”. For example, it is known that 40%–80% of the information provided by the doctor is almost immediately forgotten by the patient or remembered incorrectly.6 This is probably one of the reasons why the percentage of patients who adhere to medical instructions varies about from 40% to 90% and only half of all drugs are taken as per medical recommendation.7,8
The plethora of studies concerning doctor–patient communication9–15 can be roughly divided into three categories: descriptive studies, aimed at analyzing the content and the interaction process; correlational studies, in which the interaction between knowledge, comprehension, satisfaction, and adherence to the treatment is evaluated; and intervention studies, which are centered on improving the skills of health care professionals. One aspect is, however, common to all these types of study, that is, the objective is to “appreciate and comprehend the patient’s perspective and his/her behavior”.16 The objective of the present study (that can be ascribed to the first category) is also to provide evidence that in addition to content, certain specific characteristics of the structure itself of any communication can influence the degree of comprehension with the focus on the deliberate use of opposites. The results demonstrate the benefits of using a specific methodology (ie, Rash Models) in order to assess the relative weight (in terms of impact) that patients give to the terms used to communicate.
The impact of various types of information and the patient’s perception of the condition of their health
Various models have been put forward concerning the psychological factors which influence people’s decisions concerning their health.17,18 Perception of risk is one of the key factors.19–22 Some empirical assessments of individual beliefs and values regarding certain types of information and contexts have shown, for example, that the attitude of Italian citizens toward participating in clinical trials depends on whether a preventive intervention or the treatment of a disease is involved. Less than 30% of participants said they would agree to participate in a trial involving a “vaccination” (ie, in a situation in which the person was not suffering from a disease and their perception was of low risk) and only 5% would give their permission for a younger relative to participate. In contrast, almost 50% indicated that they would agree to take part in a therapeutic randomized clinical trial in a situation in which they had been diagnosed with a disease and a greater degree of risk was perceived.23,24 Several studies have found this bias toward omission.25–29 For instance, people prefer not to vaccinate their children against a potentially fatal case of influenza (ie, omission or inaction) even if this choice might represent a greater risk of death than the vaccination itself (ie, commission or action).26,30,31 Conversely, in cases involving diagnoses of cancer, people manifest a preference for action26 since they feel a strong need to combat the disease. Information content (ie, influenza vs cancer and the presence/absence of disease or preventive intervention) is, therefore, a decisive factor from a psychological point of view, but another critical factor is the formatting of information.32–37 Studies aimed at finding ways to optimize people’s understanding in cases where informed consent is required have explored the impact of using multimedia (eg, graphics and visual aids, videos, bullet pointed texts, etc),38–40 as well as question and answer sessions or focus group discussions with nurses and/or doctors,41 and the use of techniques including varying the length and complexity of sentences42 and using bipolar or unipolar structures.43 The way in which information is structured in doctor–patient communication and how this impacts on the patient’s understanding has also been the subject of research which goes beyond the case of informed consent. For instance, Ong et al44 used the Roter Interaction Analysis System classification system45 to assess the impact of various different categories of information on patient satisfaction in oncological consultations. This methodology was also used by Ishikawa et al46 in a cancer study in Japan. In their study, Venetis et al47 showed that increasing the use of nominalization, concrete nouns, and group nouns may be a good way to provide patients with more thorough information in a more accessible manner (the context in that case was patients with breast cancer). Robinson and Heritage48 studied the association between the format of doctors’ opening questions which prompt patients to present concerns and the patients’ post-visit evaluations of the relative affective-relational dimension. Siminoff et al49 found that in order to optimize the degree of comprehension in patients, doctors should structure their clinical encounters with a view to increasing the patient’s affective participation by means of encouraging them to ask questions and actively participate in the decision-making process.
In the present study, a simulated doctor–patient communication scenario was used to investigate both the psychological impact of various types of content in the context of oncological diagnosis and the effect of using a different communication format, namely, the inclusion of overt references to opposite poles (such as large vs small, common vs rare, or difficult vs easy to cure) as compared to unipolar communication in which opposite semantic anchors are not provided. The impact of these variations in content and structure was assessed in terms of the participants’ self-reported perception of 1) the condition of their health, 2) the risks pertaining to the disease and adhering to and completing the proposed treatment regimen, and 3) the commitment required to engage in and complete the treatment.
The impact of the information was assessed by means of self-reported perception rather than by observing its direct effect on psychological aspects such as decision making or the choice of treatment. Rasch models50,51 were used to analyze the response data. However, an evaluation of psychological aspects is also important, and the results of this study suggest a line of research and a type of methodology that can be easily extended to provide valuable information. For instance, Gavaruzzi et al52 found that decision making in a cancer scenario depends on the “perceived severity of the disease”, which in turn depends on how the patient has been informed about his/her condition, that is, whether the tumor is malignant or benign or is a benign tumor that could become malignant in the future or increase in size. This may also include advice about the type of treatment (ie, watchful waiting or surgery). The present study investigates more deeply the extent to which the patient perceives the severity of his/her condition. This was done by focusing on a set of information which includes some of the topics considered in Gavaruzzi et al’s study, but further aspects were also investigated relating to the nature of the disease, and the duration and side effects of the treatment and their impact on the patient’s quality of life. In particular, the research focused on three dimensions: the participant’s perception of the condition of his/her health (H), the degree of risk (R), and the degree of commitment relating to the treatment prescribed (T). The relationship among these three ratings was studied, and the effects of modulating the information by means of varying the structure of the communication were explored.
Understanding the type of information that leads to a disease being perceived as more severe in terms of these three psychological dimensions might make it easier for doctors to comprehend what lies beneath a patient’s decision regarding treatment. It might also help doctors and health practitioners to narrow the gap between how they communicate the gravity of a disease and how patients understand and evaluate the situation accordingly. We feel that the results of this study may also be helpful in the context of clinical trials as they show a promising way to address the recurrent concern that communications concerning informed consent need to be improved.36,53–57
The study
The study had three main aims. The first was to scale the information that was given to the participants in a simulated oncology scenario (conveyed by means of simple verbal statements constituting the “items” in the questionnaire). This referred to the nature of the disease or the characteristics of the treatment, from its duration to the incidence of adverse side effects and any changes in terms of quality of life during and after treatment. These items were rated by the participants with reference to their subsequent perception of impairment to health (H), the risk inherent to the disease and the proposed treatment (R), and the commitment relating to engaging in the treatment (T). The “weight” of each verbal statement was obtained by applying the Rasch measurement model50,51 with the result expressed in logit scores along three different unidimensional scales (“Statistical analysis” section).
The second aim was to explore whether specific characteristics relating to the structure of the communication were associated with significantly different locations along the three dimensions. In particular, we included three different types of items in our initial set: 1) items expressed in terms of opposite properties (eg, small nodule–large nodule, minor side effects–severe side effects); 2) items expressed quantitatively without any reference to opposites (eg, referring to the size of the nodule in centimeters or to the incidence of side effects in percentages); or 3) items expressed in a “neutral” way (eg, referring to the existence of a nodule or the existence of side effects without qualifying or quantifying them). We assessed the relative impact of these various communication types by studying whether the use of opposites affected the participant’s perception in any way. The decision to use “opposite properties” was based on the results of a previous study43 which indicated that people’s understanding and satisfaction with how information is conveyed is greater when opposites are used. Henceforth, this variable will be referred to as Communication Type and the two relative levels as Bipolar communication (B) when opposites are used (eg, “The medical tests have revealed the presence of a small nodule”) and Unipolar communication (U) when opposites are not used (eg, “The medical tests have revealed the presence of a 0.5 inch nodule”). Secondly, we focused on Polarity in order to determine whether the items elicited significantly different responses depending on whether there was a reference to the very negative (VN) or slightly negative (SN) pole of the dimension concerned (eg, “The medical tests have revealed the presence of a large nodule”; “The medical tests have revealed the presence of a small nodule”) or whether there was no mention of either one pole or the other (neutral negative: NN, eg, “The medical tests have revealed the presence of a nodule”, with no reference to whether it is large or small). Thirdly, the effect of the presence or absence of quantified information was studied.58–60 Our initial set of items consisted of four different types of communication (ie, “numerically expressed” quantity (NM), eg, “1 in a 100”; “qualitatively expressed” quantity (QL), eg, the type of tumor is “common”; “vaguely expressed” quantity (VG), eg, “The duration of the adverse side effects varies over time”; and “no” quantity (NO), eg, “This treatment is administered on an inpatient basis”). The effect of this variable on the ratings given by the participants was evaluated.
The third main aim of the study was to obtain regression functions that would permit us to predict a participant’s responses for one dimension based on his/her responses for another dimension. For example, a doctor might start with a patient’s reaction to a specific item in one of the three dimensions (eg, risk, R) in order to predict his/her reaction to the same item in the other two dimensions (ie, perception of the condition of his/her health, H, and perception of the degree of commitment required, T).
From a methodological point of view, the application of Rasch models allowed us to reach these three main goals (“Statistical analysis” section).
Subjects and methods
Participants
Four hundred and seventy Italian undergraduate students (University of Verona, non-medical faculties) and their relatives participated voluntarily and anonymously in the study (297 F, 173 M; mean age 28.73, SD=9.11). Written informed consent was provided by each participant. We used this sample of subjects in order to maximize the impact of the type of information being given since it was made up of people who would not usually receive this sort of communication. The study complied with the Helsinki ethics protocol and was approved by the Ethics Committee of the University of Verona (where the data were collected).
Materials
A paper questionnaire consisting of 82 items (verbal statements) was used. A scenario was described as follows:
Imagine that your doctor has recommended that you have some medical tests at a center specialized in oncological diagnoses in order to ascertain whether or not you have a health problem. You have done the tests and now you are talking to the doctor who tells you what the situation is. During the interview, he/she gives you various pieces of information.
The 82 items which followed were each related to various pieces of information. The following are examples of the items presented: “Medical tests have shown the presence of a 0.5 inch long nodule”; “Medical tests have revealed the existence of a benign nodule”; “This type of tumor is common”; “This tumor is easy to treat”; “This treatment has a 70% efficacy rate”; “The standard treatment for this tumor has minor adverse side effects”; and “This treatment takes 15 days to complete”. The complete list of items is reported in Table S1.
Participants were asked to provide three ratings (on a scale ranging from 0 to 10) for each item, expressing their perception of the degree of impairment to Health (H), the Risks involved (R), and the degree of commitment required for the Treatment (T).
The items used in the questionnaire had been identified in a previous study,43 based on two sources: the information exchanged between doctors and patients in a series of videos simulating typical dialogues in diagnostic and follow-up consultations (produced by the psychology department and the medical staff of the Italian National Cancer Institute [Centro di Riferimento Oncologico in Aviano, Italy]) and information concerning the nature and incidence of side effects as commonly presented in standard informed consent forms. From a communicative point of view, three different structures were used: one that made reference to opposite properties, one that used quantitative expressions, and one was “neutral” (ie, with no quantification or qualification in terms of opposites).
The order of the 82 items in the questionnaire and of the three response scales (H, R, T) was randomized among participants.
Procedure
The questionnaire was given to each participant, either during the University Open Day or during psychology lectures on topics unrelated to the subject of the study. The questionnaire was completed individually in a quiet room at the university. No fixed amount of time was established, but, on average, the participants took between 30 and 40 minutes to fill in the questionnaire.
Statistical analysis
The ratings on the three response scales (raw data) were transformed by means of a Rasch analysis. The Rasch unidimensional measurement model was used since it deals with responses as a function of the interaction between two quantitative latent dimensions, one concerning the characteristics of the “person” and another concerning the characteristics of the “items”.51,62–65 Their specific meaning depends on what is being assessed. For example, in an educational context, the former measure usually indicates the ability of a person and the latter the difficulty of an item. In medical contexts, the former measure indicates the person’s perception of the condition of their health and the latter indicates the degree of severity conveyed by each item.61,65
Rasch models address the weaknesses of traditional approaches to measurement (the classic test theory) by yielding to measurements of latent dimensions which are objective and based on the principles of fundamental measurement.66,67 In other words, item calibrations that are independent of the characteristics of the individuals are produced and individuals are measured independently of the characteristics of the items. Fundamental measurement is taken for granted in the physical sciences, whereas in social sciences raw scores and the sum or means of these scores are typically considered as “measures” of a dimension independently of whether or not they conform to the principles of fundamental measurement.68 The measures obtained by means of application of the Rasch model have the following measurement properties: 1) linearity – the combinations (ie, sum, mean, etc) relating to the raw scores given by the participants using a categorical or rating response scale do not constitute an interval measurement scale due to the nonlinear metric nature of this procedure;62 on the contrary, the unit of measurement (logit) defined by means of application of Rasch models (logit) and derived from the logarithmic form of the model has the same constant value all along the continuum of the latent dimension; 2) specific objectivity – the relationship between stimulus parameters defined by the application of a Rasch model is not influenced by subject parameters and vice versa; and 3) stochastic independence – the probability associated with a pattern of responses given by a subject n to the stimulus i is the product of the response probabilities given to each of the i stimuli.
Technical notes
All the statistical analyses were performed using the R software.69 The Rasch analysis was conducted using the Partial Credit Model by Masters70 by means of the eRm package.71 For Rasch Fit statistics (in order to flag items which did not fit), we used the infit-t statistics (namely, values out of the ±2 range, as suggested by Wright and Linacre,72 Linacre,73 Smith,74 Linacre),75 and the Chisq statistical probability (ie, P<0.05, as suggested by Bland and Altman).76 As an index of the reliability of the instrument, we used the Person Separation Reliability Index (PSRI)51 which is the Rasch equivalent of the Cronbach’s α. It ranges between 0 and 1; the closer its value is to 1, the greater is the probability that the differences among the participants’ measures express actual differences in the status of the participants along the three dimensions.
Results
Screening of the 82 items for each dimension (impairment to Health, Risks involved, degree of commitment to the Treatment)
The fit of our initial 82 items to the Rash model was assessed. Each item was evaluated separately for the three dimensions (H, R, T) using the two exclusion criteria described above (infit-t statistics: out of the range ±2; Chisq: P<0.05). This allowed us to eliminate the items with a bad fit, thus improving the measurement properties of the final questionnaire. Sixty-one of the initial 82 items (74%) turned out to have a good fit with the impairment to Health scale, 65 of the initial 82 items (79%) had a good fit with the Risk scale, and 69 (84%) had a good fit with the degree of commitment to the Treatment scale. The complete list of items and their scaling values (Location) is reported in Table S1, where the gray background indicates misfit items, that is, those that were then eliminated from the subsequent analyses. The scaling values (reported in the “Location” columns) express the position of the items on the three scales relating to the three dimensions (H, R, T). In order to make the interpretation of these values easier and to make it possible to compare the three dimensions, the scaling values were adjusted so that the minimum value for each dimension was zero. The PSRI also turned out to be good for all three dimensions (H=0.951, R=0.938, T=0.947). The significant number of items with a good fit (61–69) in addition to the high values of the PSRI proves that most of the items used in the initial questionnaire were valuable for the assessment of the three target dimensions in that they satisfied the properties of the fundamental measurement. This also means that the resulting subset of items (after exclusion) constitutes a valuable item bank.
Figure 1 shows an example of the location of some of the information along the three dimensions (for the complete verbal formulation of the items indicated in Figure 1 by the alpha–numeric initials and for the complete list of items selected as having a good fit with each of the three dimensions, see Table S1). The three scales in Figure 1 give an idea of how the items were associated with a varying perception of severity relating to state of health (scale on the left), the risks involved (central scale), and the degree of commitment required by the treatment (scale on the right) and how their relative position shifted between dimensions. This triple rating for the same item represents a further development of a well-known Rasch approach which has been used for a long time in health care studies65,77–81 and has been recently applied specifically in studies concerning a cancer scenario.82–86
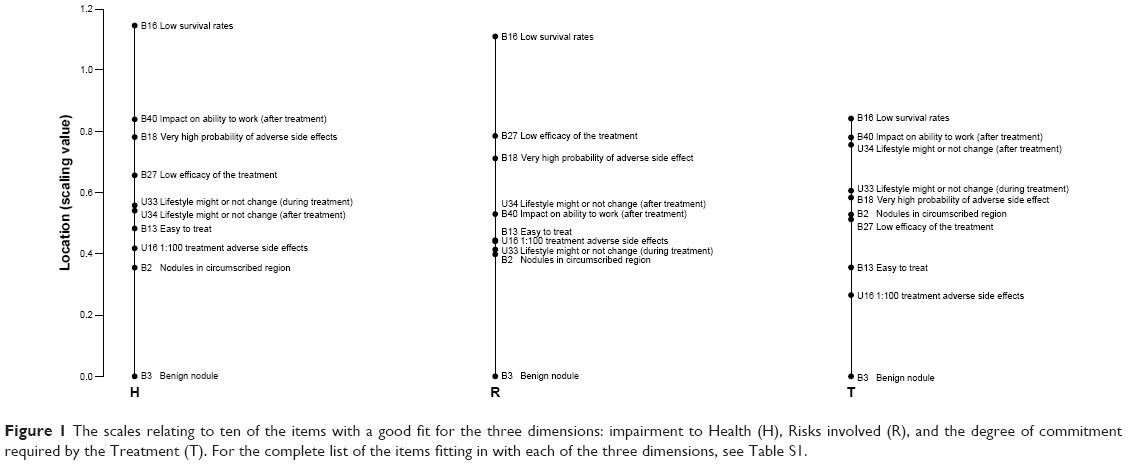 | Figure 1 The scales relating to ten of the items with a good fit for the three dimensions: impairment to Health (H), Risks involved (R), and the degree of commitment required by the Treatment (T). For the complete list of the items fitting in with each of the three dimensions, see Table S1. |
Analysis of the scaling values based on the structure of the items
Independent of the content of the items, we analyzed whether their position along the three dimensions (ie, the scaling values) also depended on their structure. The three aspects that were considered (as described in the “Introduction” section) were: Communication Type (Bipolar, B vs Unipolar, U), Polarity (positive, P, negative, N, or no mention of either of the poles, NN), and Quantity (numerically expressed quantity, NM; qualitatively expressed quantity, QL; vaguely expressed quantity, VG; no quantity, NO).
An ANOVA was performed on each dimension to test the effect of the three variables: Communication Type (B, U), Polarity (SN, VN, NN), and Quantity (NM, QL, VG, NO). This was done after having verified the normality and homoscedasticity of the distributions (by means of Shapiro and Levene tests, respectively). Communication Type turned out to be significant in two out of the three dimensions, H (F(1, 56)=19.603, P<0.0001) and R (F(1, 60)=5.017, P=0.028) – see the top graphs in Figure 2. In both cases, the use of opposites in communication (B) was associated with higher localizations on the scales, indicating the perception of a more severe state of health and greater risks.
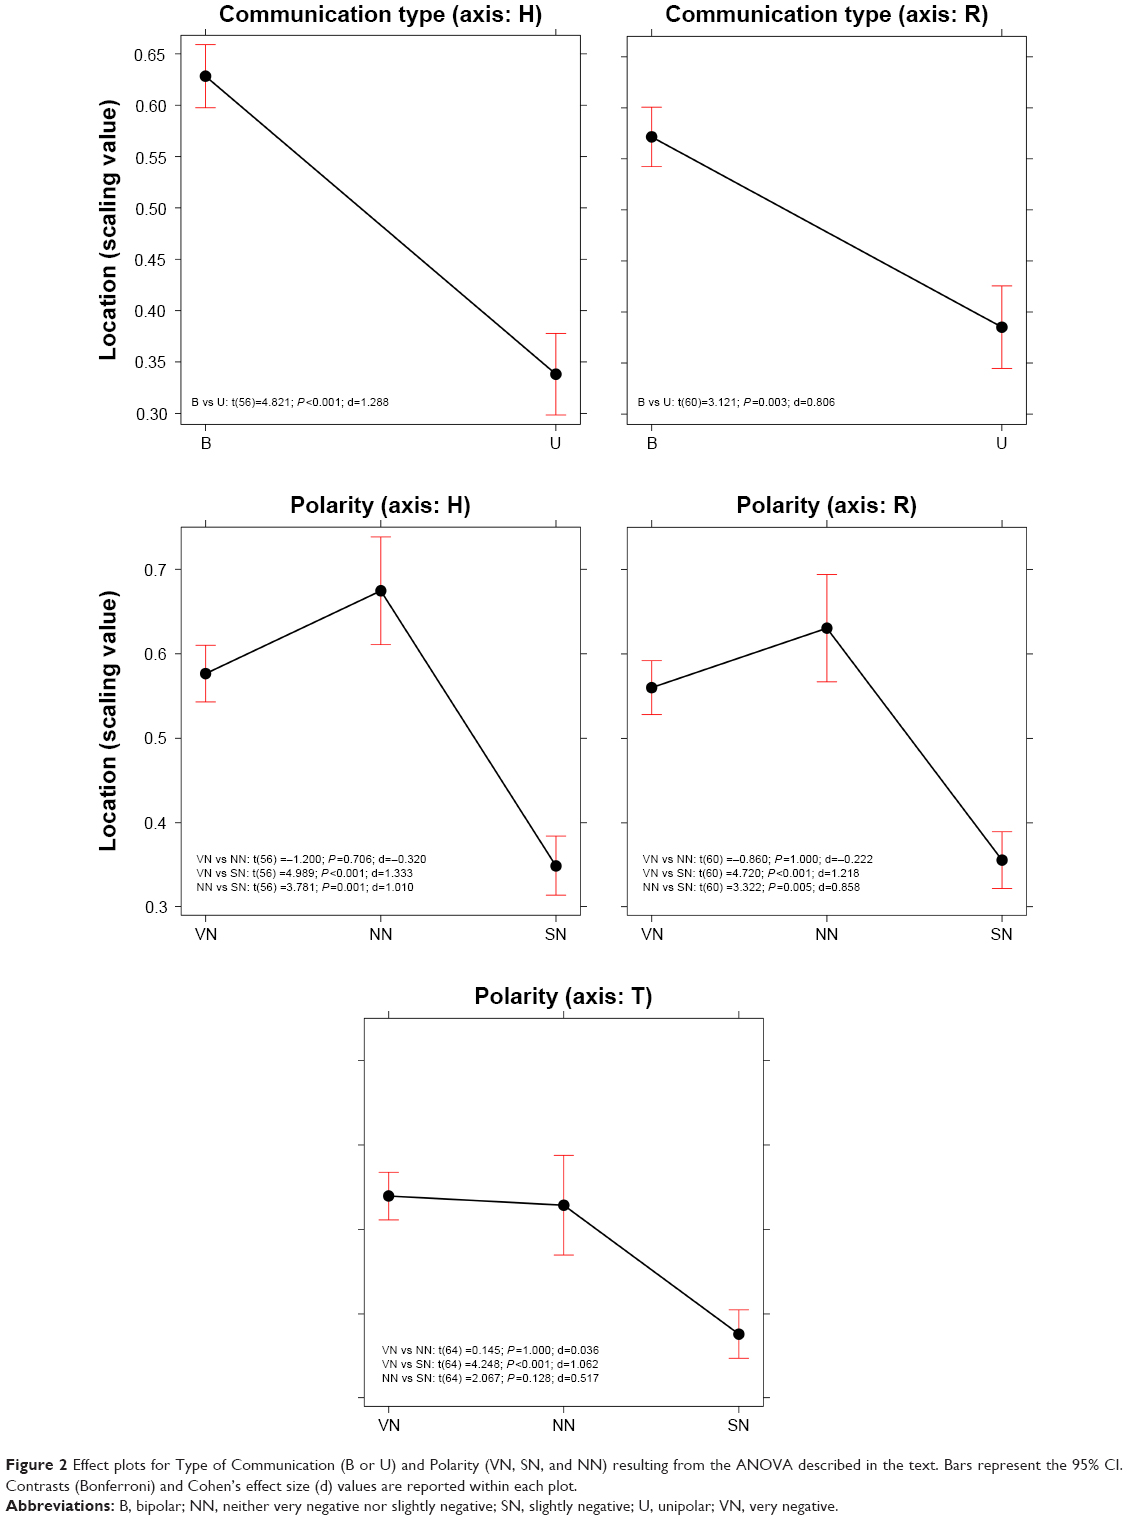 | Figure 2 Effect plots for Type of Communication (B or U) and Polarity (VN, SN, and NN) resulting from the ANOVA described in the text. Bars represent the 95% CI. Contrasts (Bonferroni) and Cohen’s effect size (d) values are reported within each plot. |
Polarity turned out to be significant for all three dimensions (H: F(1, 56)=14.708, P<0.0001; R: F(1, 60)=13.298, P<0.0001; T: F(1, 60)=9.567, P=0.0002). The non-polarized information (NN) resulted in similar estimations of the perceived severity of the condition of health, the risk, and commitment involved relating to the SN information, and both were significantly greater than the results for the VN communication type (Figure 2). No significant effect emerged for the Quantity variable, either as a main effect or in interaction with other variables.
We also explored whether there was a significant association among these three variables – Communication Type (B, U), Polarity (VN, SN, NN), and Quantity (NM, QL, VG, NO) – and the Exclusion/Inclusion of an item from the selection described in the “Screening of the 82 items for each dimension (impairment to Health, Risks involved, degree of commitment to the Treatment)” section in the “Results” section.
Mosaic plots were used to represent and study these associations (Figure 3). A mosaic plot represents the frequencies of a contingency table by means of the size of the tiles; the interaction between variables is evaluated by means of the asymmetrical nonalignment of the tiles, and the significance of the difference between the observed and expected frequencies according to a specific model is determined by means of the color of the tiles. In our case, the model tested was a log-linear model of independence between variables. As shown in Figure 3, no significant association emerged between the frequency of Excluded (E) or Included (I) items and the various levels of Communication Type or Polarity. The only significant association concerned Quantity: as the blue tiles indicate (Figure 3, mosaic to the right), the items where quantity was expressed by means of numbers (NM) were particularly frequent in the case of Excluded items.
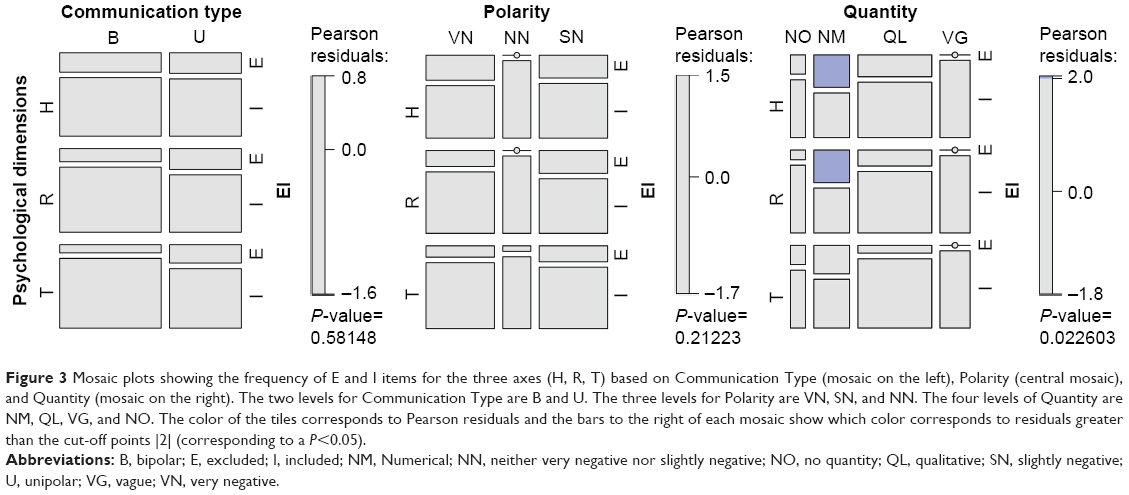 | Figure 3 Mosaic plots showing the frequency of E and I items for the three axes (H, R, T) based on Communication Type (mosaic on the left), Polarity (central mosaic), and Quantity (mosaic on the right). The two levels for Communication Type are B and U. The three levels for Polarity are VN, SN, and NN. The four levels of Quantity are NM, QL, VG, and NO. The color of the tiles corresponds to Pearson residuals and the bars to the right of each mosaic show which color corresponds to residuals greater than the cut-off points |2| (corresponding to a P<0.05). |
The relationship among the values for the H, R, and T dimensions and the relative conversion table
The subset of 53 items that had a good fit with all three dimensions was used to study the relationships among the three dimensions. In all cases, the linear function models turned out to have the best fit to our data (ie, a simpler function and higher R2). The fits of the logarithmic, power, and exponential functions were also tested. The significant relationships among H, R, and T are reported in Table 1.
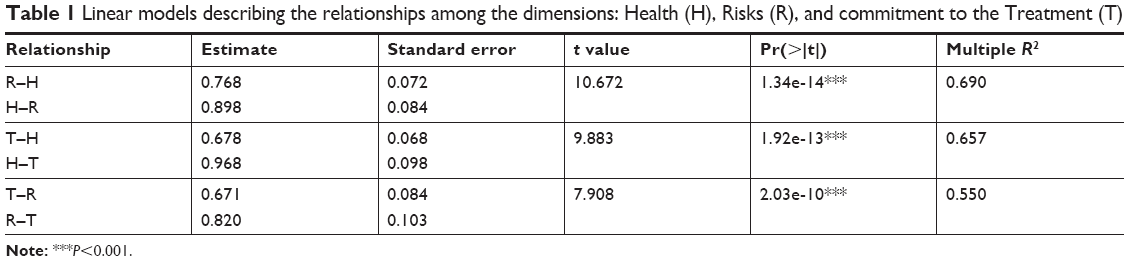 | Table 1 Linear models describing the relationships among the dimensions: Health (H), Risks (R), and commitment to the Treatment (T) |
Six linear functions were obtained (H=f(R), R=f(H), H=f(T), T=f(H), R=f(T), T=f(R)). The average between the two functions referring to the same two dimensions (eg, H=f(R) and R=f(H)) was used to calculate the conversion table presented in Table 2. By means of the functions reported in the table, it was possible to study a person’s responses on one scale and make a likely estimate of his/her responses on another scale.
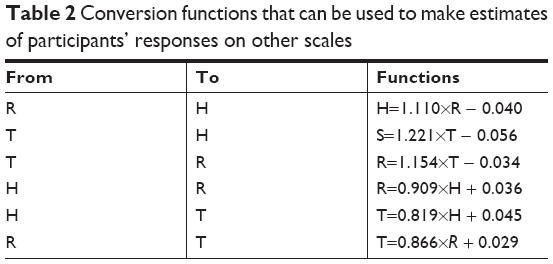 | Table 2 Conversion functions that can be used to make estimates of participants’ responses on other scales |
For example, let us imagine that a doctor is going to communicate a certain set of information during a medical consultation. For the sake of simplicity, let us assume that the information is the one represented in Figure 1 (ie, relating to the ten items reported below in Table 3, column 1: Item). The doctor might ask the patient to rate his/her perception of the degree of impairment to his/her health based on the ten items of information provided, and we may assume that the ten raw scores given by the patient are those reported in Table 3, column 2. We already know from the results reported in Table S1 that each item has a certain “weight” (as defined by its location on the H dimension), so the doctor can use these location values to “correct” the raw score given by the person and then, based on these corrected values, come up with an evaluation of how the patient perceives the situation (Table 3, column 4). Furthermore, the doctor might use the functions reported in Table 2 to make a good estimate from the above-mentioned weighted score for H regarding the patient’s perception of the risks involved (R) and the commitment required for the treatment (T), that is, estimate the values in Table 3, columns 5 and 6.
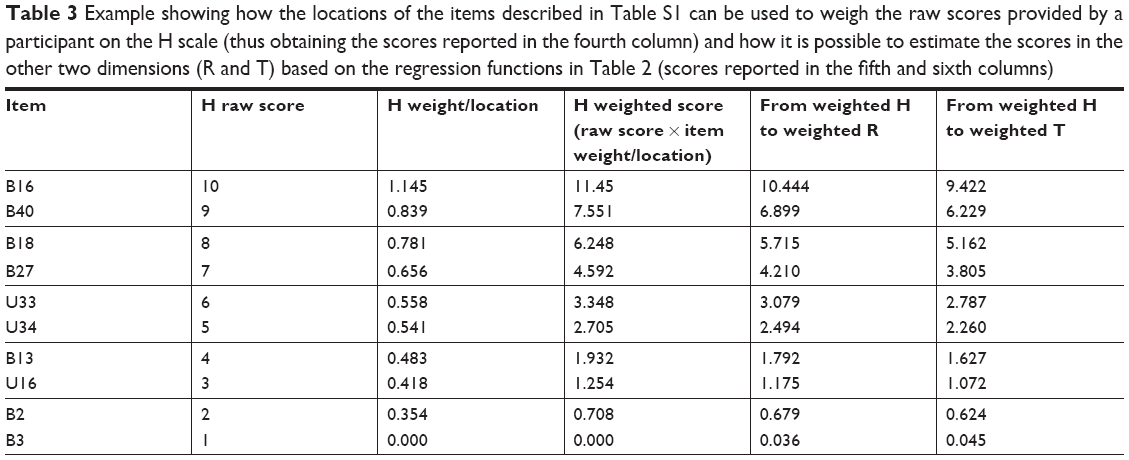 | Table 3 Example showing how the locations of the items described in Table S1 can be used to weigh the raw scores provided by a participant on the H scale (thus obtaining the scores reported in the fourth column) and how it is possible to estimate the scores in the other two dimensions (R and T) based on the regression functions in Table 2 (scores reported in the fifth and sixth columns) |
Table S1 shows the item bank. A doctor might select some elements (it is not necessary for the doctor to use all the items) out of the whole set of items listed and use them in the context of doctor–patient communications. In this way, the doctor will have a good idea a priori concerning the potential impact of any given item. The weightings reported in Table S1 are based on the results of the present study, and thus reflect the characteristics relating to the participants who took part. The aim of the study was to find a procedure which would be useful in terms of assessing a patient’s understanding of any information given to him/her. If health practitioners have a better idea regarding the potential impact of any information given on a patient, this will help them to choose the best way of communicating, which will be beneficial to any therapy required.
Final discussion
Health care staff must ensure the quality of a patient’s understanding of any information provided in contexts where the patient is required to make decisions and be more effectively involved in the treatment process.87 Modeling the importance which people attach to the various pieces of information they receive seems to be a promising way to help doctors and health practitioners have a better understanding of how the patient sees his/her situation, enabling them to provide more tailored assistance (for a review of the debate concerning the disclosure of information and the comprehension of disclosed information, see Cox88). It may also help medical staff to understand why patients decide to choose omission vs commission.17,89 The study presented in this paper adds to previous studies showing the advantage of using Rasch analyses to model psychological constructs related to health status.65,77–83 This model allows researchers to come up with robust (sample free) scalings of the items of information in terms of the psychological constructs of interest. These concern the condition of the patient’s health (H), the risks involved (R), and the degree of commitment to the treatment prescribed (T). The subset of items resulting from the scaling procedures performed as part of the study (Table S1) provides an example item bank that health care staff might be interested in utilizing and building on. Information concerning, for instance, the size of a nodule “might not seem to a doctor” to adequately convey the situation, since the size of a tumor is not necessarily related to how serious it is. However, it is important to assess whether this is also the case “from the patient’s point of view”. If not, there is the risk of the situation seeming extremely serious to the patient, leading to a potential misinterpretation. Being aware of this is an important point of departure.
When looked at from the point of view of the specific content considered in this study, our findings both consolidate previous results and add new knowledge. For instance, in the study carried out by Gavaruzzi et al,52 patients’ reactions to the information that a “benign tumor” had been found were not significantly different to their reactions in cases where no tumor was found. Our findings in a sense confirmed the very low perception of severity associated with communications of this type. The item in the questionnaire relating to the statement “The medical tests have revealed the presence of a small nodule” turned out to be at the extreme end of all of the three scales we referred to, since it elicited minimum values relating to impairment to health, the perception of risks, and the degree of commitment relating to the treatment prescribed (Figure 1 and Table S1). Regarding genetic predisposition, Gavaruzzi et al52 also found that doctor–patient communications concerning a “genetic predisposition” for a non-tumorous illness had the same impact (in terms of decisions about active treatment) as communications concerning the presence of (and not only the predisposition for) a non-tumorous illness. In our study, the item stating “This tumor is always connected to a genetic predisposition” (B13) elicited significantly lower values for all three dimensions (H=0.483, R=0.445, T=0.356) than the opposite item, “This tumor is never connected to a genetic predisposition” (B14; H=0.724, R=0.723, T=0.543). This suggests that a genetic predisposition was associated in the participants’ minds with a less serious condition.
If we then consider the structure of the items, our findings contribute valuable information to the question of the role that opposites might play in doctor–patient communication. We know that opposites have a special status in human cognitive organization and that they are common to all natural languages and are intuitively and naturally understood and learnt.90–92 We also know that, when used in oncological consultations, they seem to improve the degree of understanding and satisfaction with how the information has been communicated and induce a greater degree of commitment and a more accurate perception of the severity of the disease and the risks involved.43 The results presented in the present paper confirm that the items which referred to opposites (Communication Type B in Figure 2) were generally associated with a perception of greater severity in terms of H and R, and participants had a clearer idea regarding whether the information communicated was very negative (VN in Figure 2) or slightly negative (SN in Figure 2). Conversely, when information was provided qualitatively but without any mention of either of the poles (NN in Figure 2), the overall perception of the severity of the disease did not significantly differ from the information which referred to the negative pole. Paraphrasing previous findings concerning cancer patients’ understanding that “no news is not good news”,93 our results suggest that “non-polarized news is not good news”. Lastly, the verbal statements including quantitative expressions were frequently among the items which were excluded from the scalings resulting from the application of the Rasch model due to lack of fit. This suggests that responses to those items did not presuppose the same cognitive dimension as those relating to the responses to the other type of items. This result adds to the literature on the specificity of using quantitative information.94–96
We are aware that any generalizations to real situations of the results discussed in this paper which were obtained with healthy volunteers in a simulated context have to be made with caution. Previous results have shown that people with life-threatening illnesses often interpret information concerning the risks of a particular course of treatment differently from healthy controls.87,97,98 However, the suggestions regarding methodology put forward in this paper may stimulate future tests with real patients. The results indicate that it is possible to assess the impact of information conveyed by means of verbal statements (which may vary in terms of content and structure) in the context of doctor–patient communications. This would allow a better intentional modulation of any communication by health care staff (in terms of H, R, and T), enabling them to anticipate the impact on the patient. In addition to being useful in every context where doctors and patients interact, this type of knowledge may also be useful for the forms used for informed consent and for medical/pharmaceutical leaflets, especially with regard to side effects.
Disclosure
The authors report no conflicts of interest in this work.
References
Inerney SJM. Introducing the biopsychosocial model for good medicine and good doctors. BMJ. 2018;324:1533. | ||
Borrell-Carrió F, Suchman AL, Epstein RM. The biopsychosocial model 25 years later: principles, practice, and scientific inquiry. Ann Fam Med. 2004;2(6):576–582. | ||
Bergeson SC, Dean JD. A systems approach to patient-centered care. JAMA. 2006;296(23):2848–2851. | ||
Doyle C, Lennox L, Bell D. A systematic review of evidence on the links between patient experience and clinical safety and effectiveness. BMJ Open. 2013;3(1):e001570–18. | ||
Stewart MA. Effective physician-patient communication and health outcomes: a review. CMAJ. 1995;152(9):1423–1433. | ||
McGuire LC. Remembering what the doctor said: organization and adults’ memory for medical information. Exp Aging Res. 1996;22(4):403–428. | ||
Cantrell CR, Priest JL, Cook CL, Fincham J, Burch SP. Adherence to treatment guidelines and therapeutic regimens: a US claims-based benchmark of a commercial population. Popul Health Manag. 2011;14(1):33–41. | ||
Brown MT, Bussell JK. Medication adherence: WHO cares? Mayo Clin Proc. 2011;86(4):304–314. | ||
Street RL, Makoul G, Arora NK, Epstein RM. How does communication heal? Pathways linking clinician–patient communication to health outcomes. Patient Educ Couns. 2009;74(3):295–301. | ||
Matusitz J, Spear J. Effective doctor–patient communication: an updated examination. Soc Work Public Health. 2014;29(3):252–266. | ||
Zolnierek KB, Dimatteo MR. Physician communication and patient adherence to treatment: a meta-analysis. Med Care. 2009;47(8):826–834. | ||
Rodin G, Mackay JA, Zimmermann C, et al. Clinician–patient communication: a systematic review. Support Care Cancer. 2009;17(6):627–644. | ||
Ong LM, de Haes JC, Hoos AM, Lammes FB. Doctor–patient communication: a review of the literature. Soc Sci Med. 1995;40(7):903–918. | ||
van Dalen J. Communication skills in context: trends and perspectives. Patient Educ Couns. 2013;92(3):292–295. | ||
Ha JF, Longnecker N. Doctor–patient communication: a review. Ochsner J. 2010;10(1):38–43. | ||
Naughton C. Patient-centered communication. Pharmacy. 2018;6(18):1–8. | ||
Biedrzycki BA. Decision making for cancer clinical trial participation: a systematic review. Oncol Nurs Forum. 2010;37(6):E387–E399. | ||
Nelson W, Stefanek M, Peters E, McCaul KD. Basic and applied decision making in cancer control. Health Psychol. 2005;24(4S):S3–S8. | ||
Bowling A, Ebrahim S. Measuring patients’ preferences for treatment and perceptions of risk. Qual Health Care. 2001;10(1):i2–i8. | ||
Brewer NT, Chapman GB, Gibbons FX, Gerrard M, McCaul KD, Weinstein ND. Meta-analysis of the relationship between risk perception and health behavior: the example of vaccination. Health Psychol. 2007;26(2):136–145. | ||
Loewenstein GF, Weber EU, Hsee CK, Welch N. Risk as feelings. Psychol Bull. 2001;127(2):267–286. | ||
Slovic P. Perception of Risk. London: Earthspan; 2001. | ||
Apolone G, Mosconi P. Knowledge and opinions about clinical research. A cross-sectional survey in a sample of Italian citizens. J Ambul Care Manage. 2003;26(1):83–87. | ||
Mosconi P, Poli P, Giolo A, Apolone G. How Italian health consumers feel about clinical research: a questionnaire survey. Eur J Public Health. 2005;15(4):372–379. | ||
Aberegg SK, Haponik EF, Terry PB. Omission bias and decision making in pulmonary and critical care medicine. Chest. 2005;128(3):1497–1505. | ||
Ritov I, Baron J. Reluctance to vaccinate: omission bias and ambiguity. J Behav Decis Mak. 1990;3(4):263–277. | ||
Baron J, Ritov I. Reference points and omission bias. Organ Behav Hum Decis Process. 1994;59(3):475–498. | ||
Baron J, Ritov I. Omission bias, individual differences, and normality. Organ Behav Hum Decis Process. 2004;94(2):74–85. | ||
Connolly T, Reb J. Omission bias in vaccination decisions: where’s the “omission”? Where’s the “bias”? Organ Behav Hum Decis Process. 2003;91(2):186–202. | ||
Asch DA, Baron J, Hershey JC, et al. Omission bias and pertussis vaccination. Med Decis Making. 1994;14(2):118–123. | ||
Dibonaventura M, Chapman GB. Do decision biases predict bad decisions? Omission bias, naturalness bias, and influenza vaccination. Med Decis Making. 2008;28(4):532–539. | ||
Fischhoff B. Risk perception and communication unplugged: twenty years of process. Risk Anal. 1995;15(2):137–145. | ||
Rothman AJ, Salovey P. Shaping perceptions to motivate healthy behavior: the role of message framing. Psychol Bull. 1997;121(1):3–19. | ||
Nishimura A, Carey J, Erwin PJ, Tilburt JC, Murad MH, McCormick JB. Improving understanding in the research informed consent process: a systematic review of 54 interventions tested in randomized control trials. BMC Med Ethics. 2013;14(28):14–28. | ||
Paasche-Orlow MK, Taylor HA, Brancati FL. Readability standards for informed-consent forms as compared with actual readability. N Engl J Med. 2003;348(8):721–726. | ||
Brandberg Y, Johansson H, Bergenmar M. Patients’ knowledge and perceived understanding – associations with consenting to participate in cancer clinical trials. Contemp Clin Trials Commun. 2016;2(15):6–11. | ||
Kass NE, Taylor HA, Ali J, Hallez K, Chaisson L. A pilot study of simple interventions to improve informed consent in clinical research: feasibility, approach, and results. Clin Trials. 2015;12(1):54–66. | ||
Karunaratne AS, Korenman SG, Thomas SL, Myles PS, Komesaroff PA. Improving communication when seeking informed consent: a randomised controlled study of a computer-based method for providing information to prospective clinical trial participants. Med J Aust. 2010;192(7):388–392. | ||
Tait AR, Voepel-Lewis T, Zikmund-Fisher BJ, Fagerlin A. The effect of format on parents’ understanding of the risks and benefits of clinical research: a comparison between text, tables, and graphics. J Health Commun. 2010;15(5):487–501. | ||
Henry J, Palmer BW, Palinkas L, Glorioso DK, Caligiuri MP, Jeste DV. Reformed consent: adapting to new media and research participant preferences. IRB. 2009;31(2):1–8. | ||
Kass NE, Taylor HA, Ali J, Hallez K, Chaisson L. A pilot study of simple interventions to improve informed consent in clinical research: feasibility, approach, and results. Clin Trials. 2015;12(1):54–66. | ||
Stunkel L, Benson M, Mclellan L. Comprehension and informed consent: assessing the effect of a short consent form. IRB. 2010;32(4):1–9. | ||
Burro R, Savardi U, Annunziata MA, de Paoli P, Bianchi I. The effects of presenting oncologic information in terms of opposites in a medical context. Patient Prefer Adherence. 2018;12:443–459. | ||
Ong LM, Visser MR, Lammes FB, de Haes JC. Doctor–patient communication and cancer patients’ quality of life and satisfaction. Patient Educ Couns. 2000;41(2):145–156. | ||
Ong LM, Visser MR, Kruyver IP, et al. The Roter Interaction Analysis System (RIAS) in oncological consultations: psychometric properties. Psychooncology. 1998;7(5):387–401. | ||
Ishikawa H, Takayama T, Yamazaki Y, Seki Y, Katsumata N. Physician–patient communication and patient satisfaction in Japanese cancer consultations. Soc Sci Med. 2002;55(2):301–311. | ||
Venetis MK, Staples S, Robinson JD, Kearney T. Provider information provision and breast cancer patient well-being. Health Commun. 2018;27:1–11. | ||
Robinson JD, Heritage J. Physicians’ opening questions and patients’ satisfaction. Patient Educ Couns. 2006;60(3):279–285. | ||
Siminoff LA, Ravdin P, Colabianchi N, Sturm CM. Doctor–patient communication patterns in breast cancer adjuvant therapy discussions. Health Expect. 2000;3(1):26–36. | ||
Rasch G. Probabilistic Models for Some Intelligence and Attainment Tests. Chicago: University of Chicago Press; 1980. | ||
Andrich D. Rasch Models for Measurement. Vol. 68. Newbury Park: Sage; 1988. | ||
Gavaruzzi T, Lotto L, Rumiati R, Fagerlin A. What makes a tumor diagnosis a call to action? On the preference for action versus inaction. Med Decis Making. 2011;31(2):237–244. | ||
Brown RF, Butow PN, Ellis P, Boyle F, Tattersall MH. Seeking informed consent to cancer clinical trials: describing current practice. Soc Sci Med. 2004;58(12):2445–2457. | ||
Hietanen P, Aro AR, Holli K, Absetz P. Information and communication in the context of a clinical trial. Eur J Cancer. 2000;36(16):2096–2104. | ||
Holland J, Browman G, McDonald M, Saginur R. Protecting human research participants: reading vs understanding the consent form. J Natl Cancer Inst. 2013;105(13):927–928. | ||
Miller SM, Hudson SV, Egleston BL, et al. The relationships among knowledge, self-efficacy, preparedness, decisional conflict, and decisions to participate in a cancer clinical trial. Psychooncology. 2013;22(3):481–489. | ||
Schumacher A, Sikov WM, Quesenberry MI, et al. Informed consent in oncology clinical trials: a Brown University Oncology Research Group prospective cross-sectional pilot study. PLoS One. 2017;12(2):e0172957. | ||
Cosmides L, Tooby J. Are humans good intuitive statisticians after all? Rethinking some conclusions from the literature on judgment under uncertainty. Cognition. 1996;58(1):1–73. | ||
Gigerenzer G, Hoffrage U. How to improve Bayesian reasoning without instruction: frequency formats. Psychol Rev. 1995;102(4):684–704. | ||
Macchi L. Pragmatic aspects of the base-rate fallacy. Q J Exp Psychol A. 1995;48(1):188–207. | ||
Bond T, Fox CM. Applying the Rasch Model: Fundamental Measurement in the Human Sciences. Abingdon: Routledge; 2015. | ||
Wright BD, Masters GN. Rating Scale Analysis. Rasch Measurement. Chicago: Mesa Press; 1982. | ||
Burro R. To be objective in experimental phenomenology: a psychophysics application. Springerplus. 2016;5(1):1720. | ||
Burro R, Sartori R, Vidotto G. The method of constant stimuli with three rating categories and the use of Rasch models. Qual Quant. 2011;45(1):43–58. | ||
Anselmi P, Vidotto G, Bettinardi O, Bertolotti G. Measurement of change in health status with Rasch models. Health Qual Life Outcomes. 2015;13(1):16. | ||
Campbell NR. Physics: The Elements. Cambridge: Cambridge University Press; 2013. | ||
Luce RD, Krantz DH, Suppes P, Tversky A. Foundations of Measurement. Vol. 3. San Diego: Academic; 1990. | ||
Cavanagh RF, Romanoski JT. Rating scale instruments and measurement. Learn Environ Res. 2007;9(3):273–289. | ||
R Core Team. R: A Language and Environment for Statistical Computing [Internet]. Vienna, Austria: R Foundation for Statistical Computing; 2018. | ||
Masters GN. A Rasch model for partial credit scoring. Psychometrika. 1982;47(2):149–174. | ||
Mair P, Hatzinger R. Extended Rasch modeling: the eRm package for the application of IRT models in R. J Stat Softw. 2007;20(9):1–20. | ||
Wright BD, Linacre JM. Reasonable mean-square fit values. Rasch Meas Trans. 1994;8:370–371. | ||
Linacre JM, Infit Wdo. and Outfit, mean-square and standardized mean? Rasch Meas Trans. 2002;16:878. | ||
Smith EV. Evidence for the reliability of measures and validity of measure interpretation: a Rasch measurement perspective. J Appl Meas. 2001;2(3):281–311. | ||
Linacre JM. Facets Rasch measurement computer program (Version 3.81.0) [Computer Software]. Chicago, IL: Winsteps.com. 2018. | ||
Bland JM, Altman DG. Multiple significance tests: the Bonferroni method. BMJ. 1995;310(6973):170. | ||
Belvedere SL, de Morton NA. Application of Rasch analysis in health care is increasing and is applied for variable reasons in mobility instruments. J Clin Epidemiol. 2010;63(12):1287–1297. | ||
Christensen KB, Kreiner S, Mesbah M. Rasch Models in Health. London: Wiley; 2013. | ||
Engberg A, Garde B, Kreiner S. Rasch analysis in the development of a rating scale for assessment of mobility after stroke. Acta Neurol Scand. 1995:91–118. | ||
Vidotto G, Moroni L, Burro R, et al. A revised short version of the depression questionnaire. Eur J Cardiovasc Prev Rehabil. 2010;17(2):187–197. | ||
Rocchi S, Ghidelli C, Burro R, et al. The Walsh family resilience questionnaire: the Italian version. Neuropsychiatr Dis Treat. 2017;13:2987–2999. | ||
Rustøen T, Lerdal A, Gay C, Kottorp A. Rasch analysis of the Herth Hope Index in cancer patients. Health Qual Life Outcomes. 2018;16(1):196–205. | ||
Ty W, Chen CT, Huang YJ, Hou WH, Wang JD, Hsieh CL. Rasch analysis of the 9-item shared decision making questionnaire in women with breast cancer. Cancer Nurs. 2018:1–9. | ||
Ashley L, Smith AB, Keding A, Jones H, Velikova G, Wright P. Psychometric evaluation of the revised Illness Perception Questionnaire (IPQ-R) in cancer patients: confirmatory factor analysis and Rasch analysis. J Psychosom Res. 2013;75(6):556–562. | ||
Coste J, Tissier F, Pouchot J, et al. Rasch analysis for assessing unidimensionality and identifying measurement biases of malignancy scores in oncology. The example of the Weiss histopathological system for the diagnosis of adrenocortical cancer. Cancer Epidemiol. 2014;38(2):200–208. | ||
Bulsara CE, Styles I. Development of a cancer related patient empowerment scale using the polytomous Rasch measurement model. Cancer Clin Oncol. 2013;2(1):87–102. | ||
Degner LF, Sloan JA. Decision making during serious illness: what role do patients really want to play? J Clin Epidemiol. 1992;45(9):941–950. | ||
Cox K. Informed consent and decision-making: patients’ experiences of the process of recruitment to Phases I and II anti-cancer drug trials. Patient Educ Couns. 2002;46(1):31–38. | ||
Biedrzycki BA. Factors and outcomes of decision making for cancer clinical trial participation. Oncol Nurs Forum. 2011;38(5):542–552. | ||
Murphy ML. Semantic Relations and the Lexicon: Antonymy, Synonymy and Other Paradigms. Cambridge: Cambridge University Press; 2003. | ||
Croft W, Cruse DA. Cognitive Linguistics. Cambridge: Cambridge University Press; 2004. | ||
Jones S, Murphy ML, Paradis C, Willners C. Antonyms in English: Construals, Constructions and Canonicity. Cambridge: Cambridge University Press; 2012. | ||
Fallowfield L, Ford S, Lewis S. No news is not good news: information preferences of patients with cancer. Psychooncology. 1995;4(3):197–202. | ||
Erev I, Cohen BL. Verbal versus numerical probabilities: efficiency, biases, and the preference paradox. Organ Behav Hum Decis Process. 1990;45(1):1–18. | ||
Poulton EC. Bias in Quantifying Judgment. Hillsdale: Lawrence Erlbaum; 1989. | ||
Moxey LM, Sanford AJ. Communicating quantities: a review of psycholinguistic evidence of how expressions determine perspectives. Appl Cogn Psychol. 2000;14(3):237–255. | ||
Maslin A. A survey of the opinions on ‘informed consent’ of women currently involved in clinical trials within a breast unit. Eur J Cancer Care (Engl). 1994;3(4):153–162. | ||
Brock DW, Wartman SA. When competent patients make irrational choices. N Engl J Med. 1990;322(22):1595–1599. |
Supplementary material
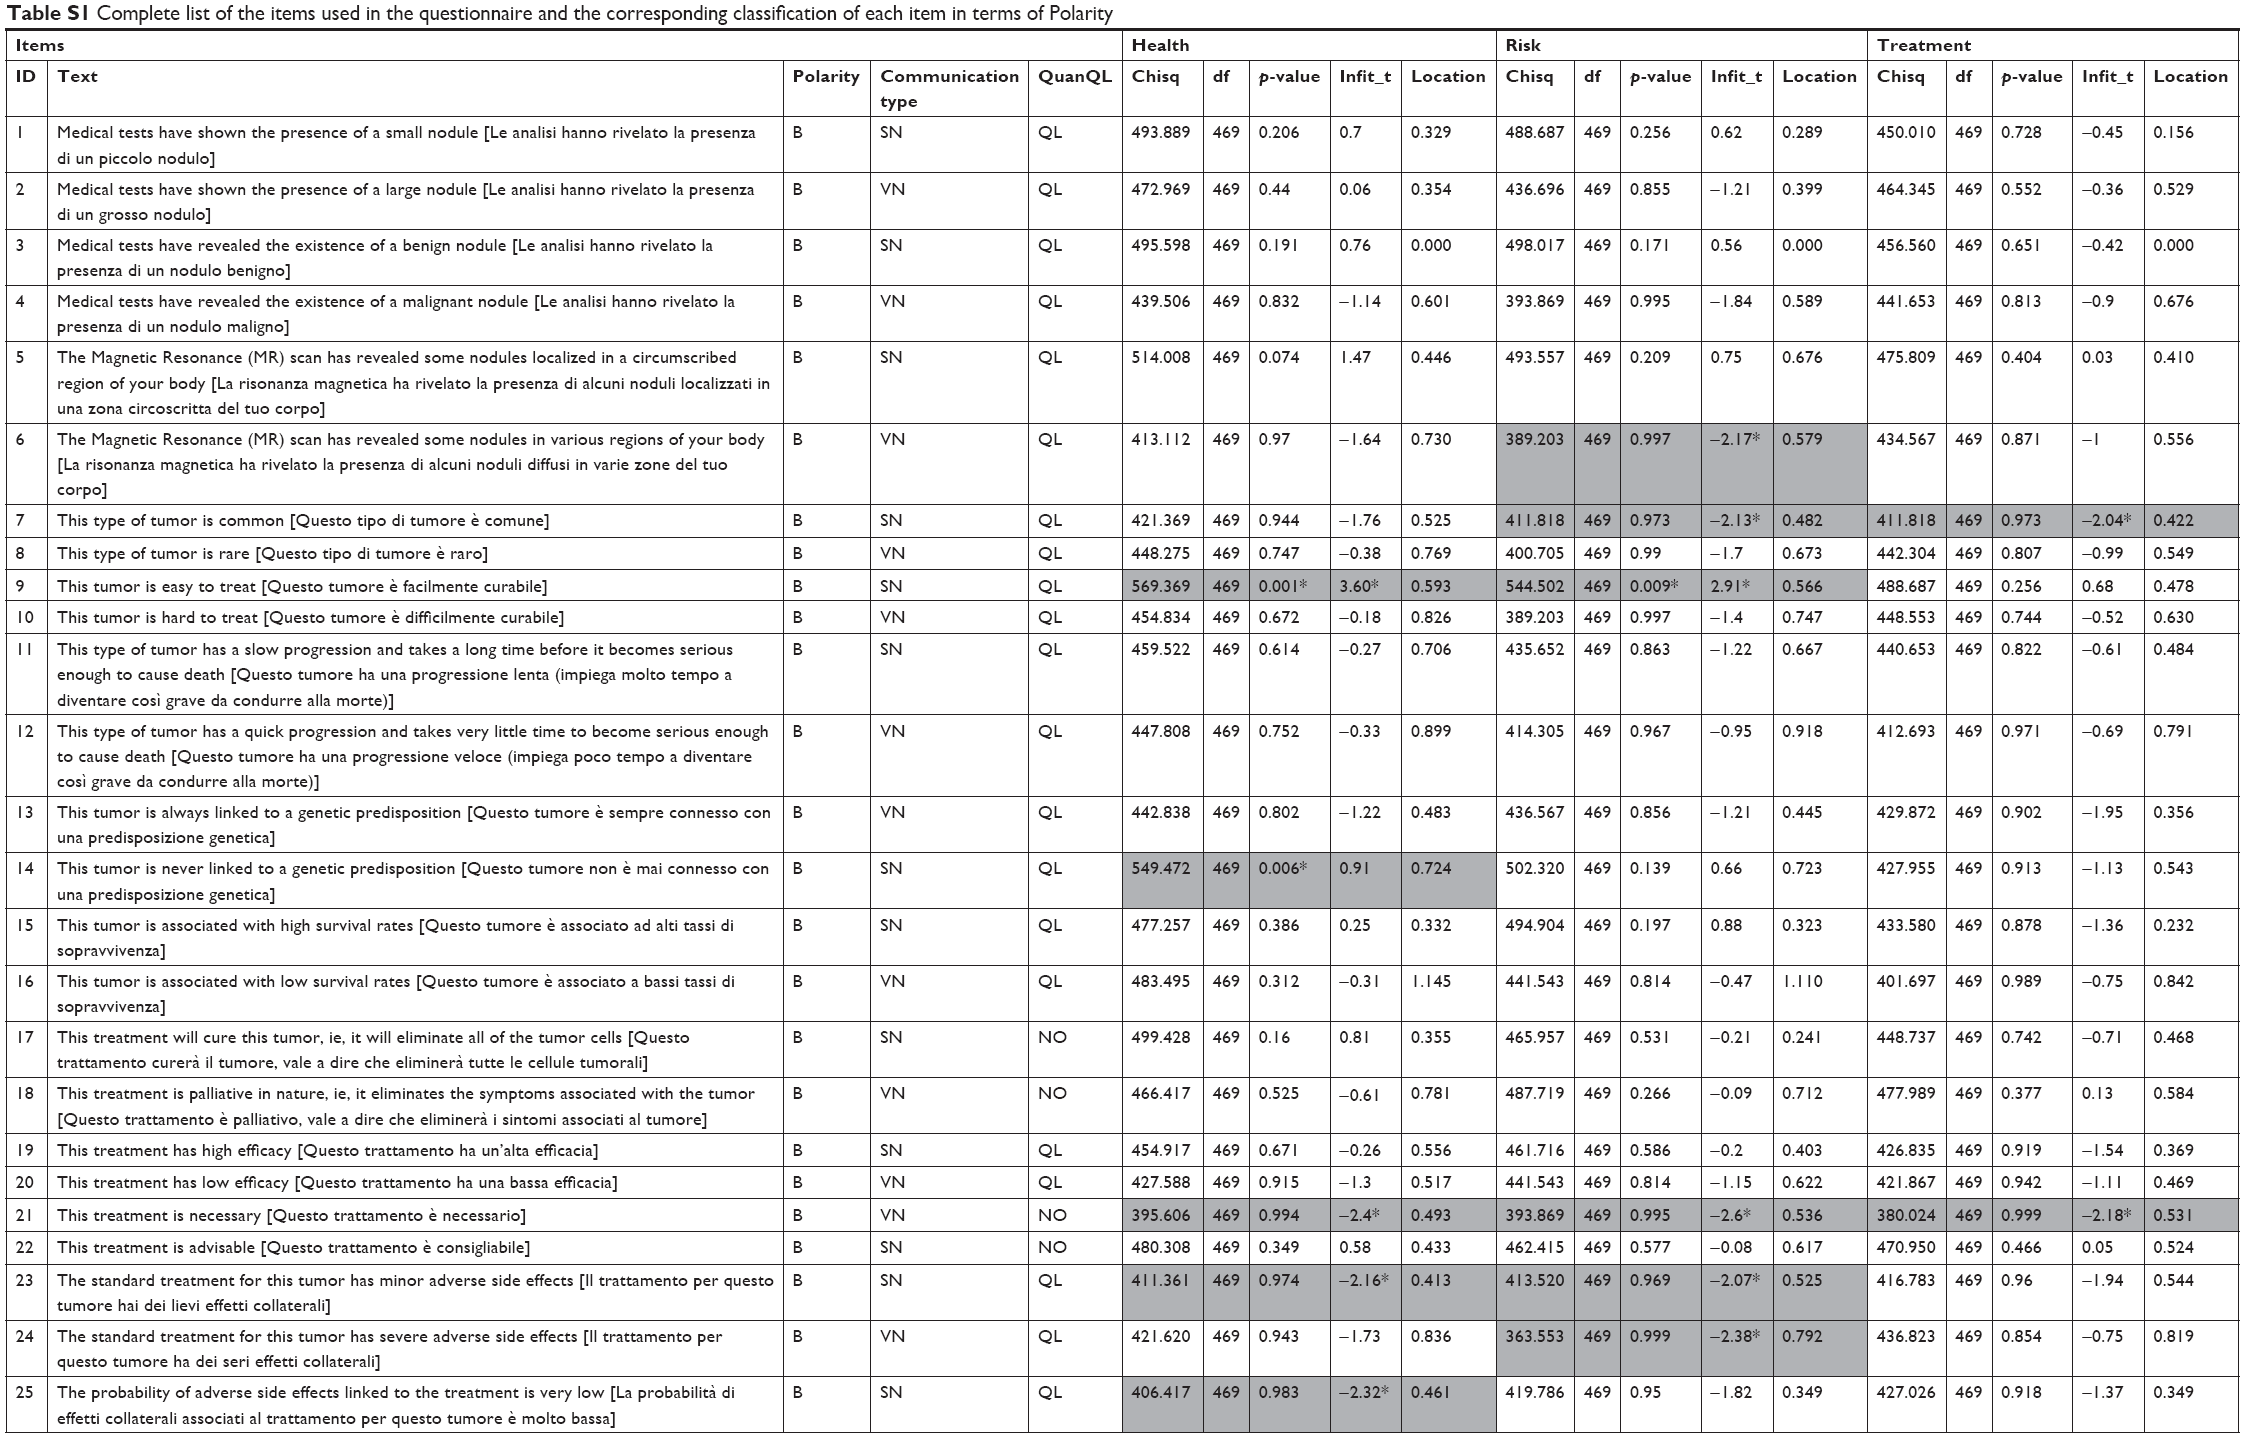 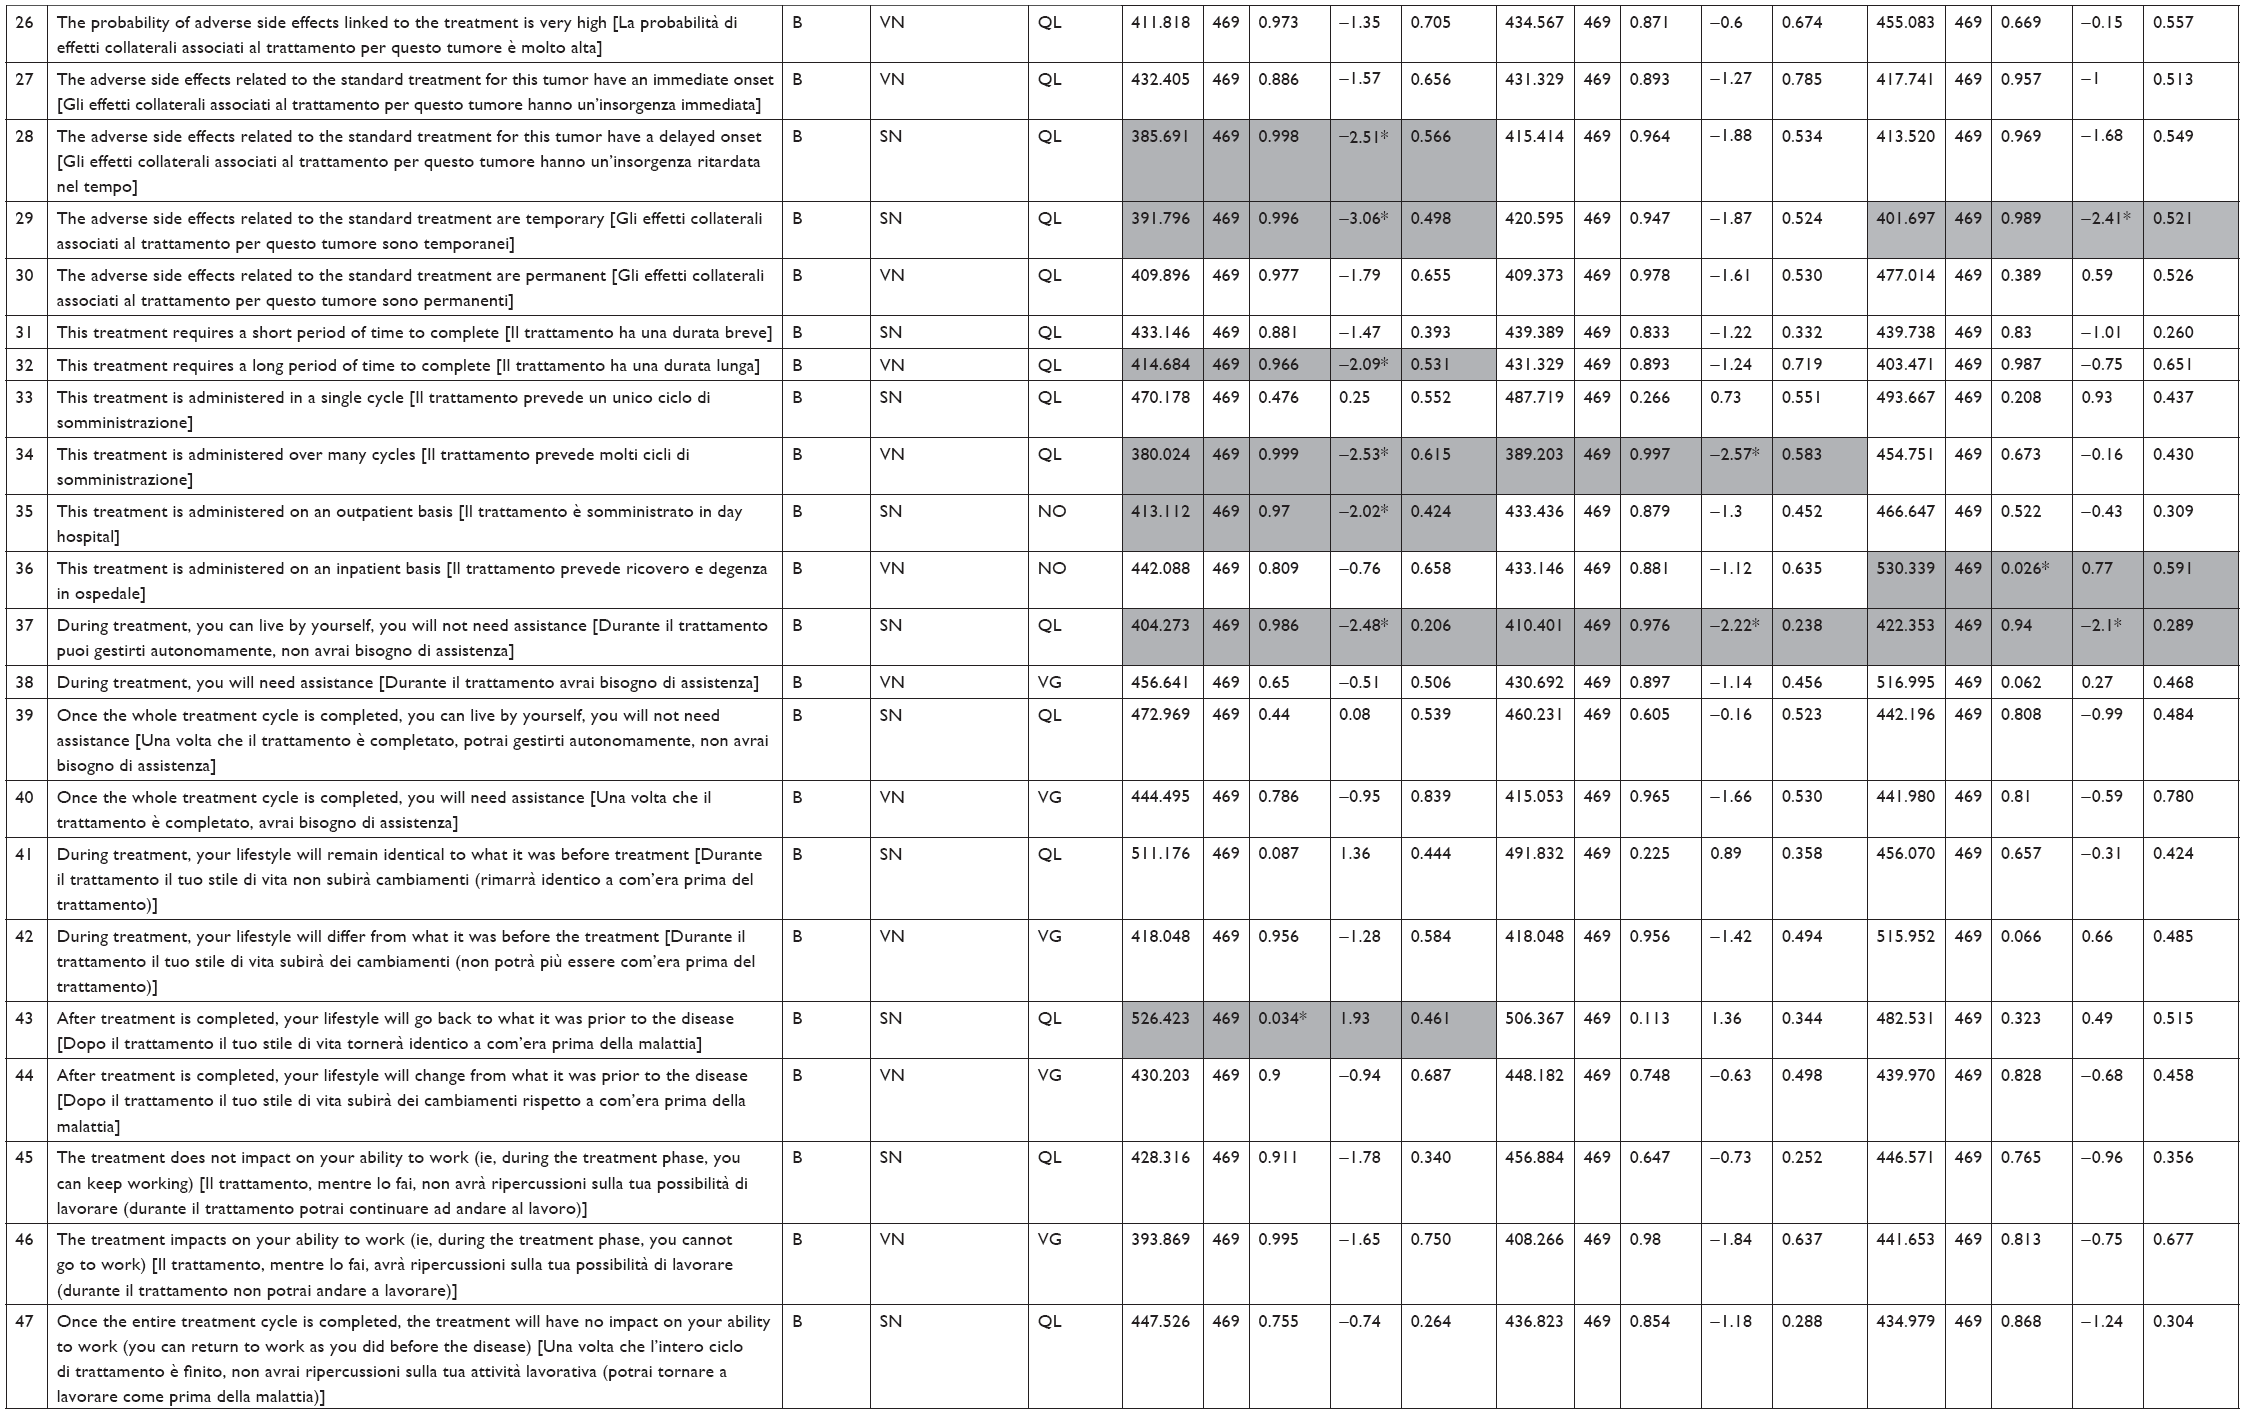 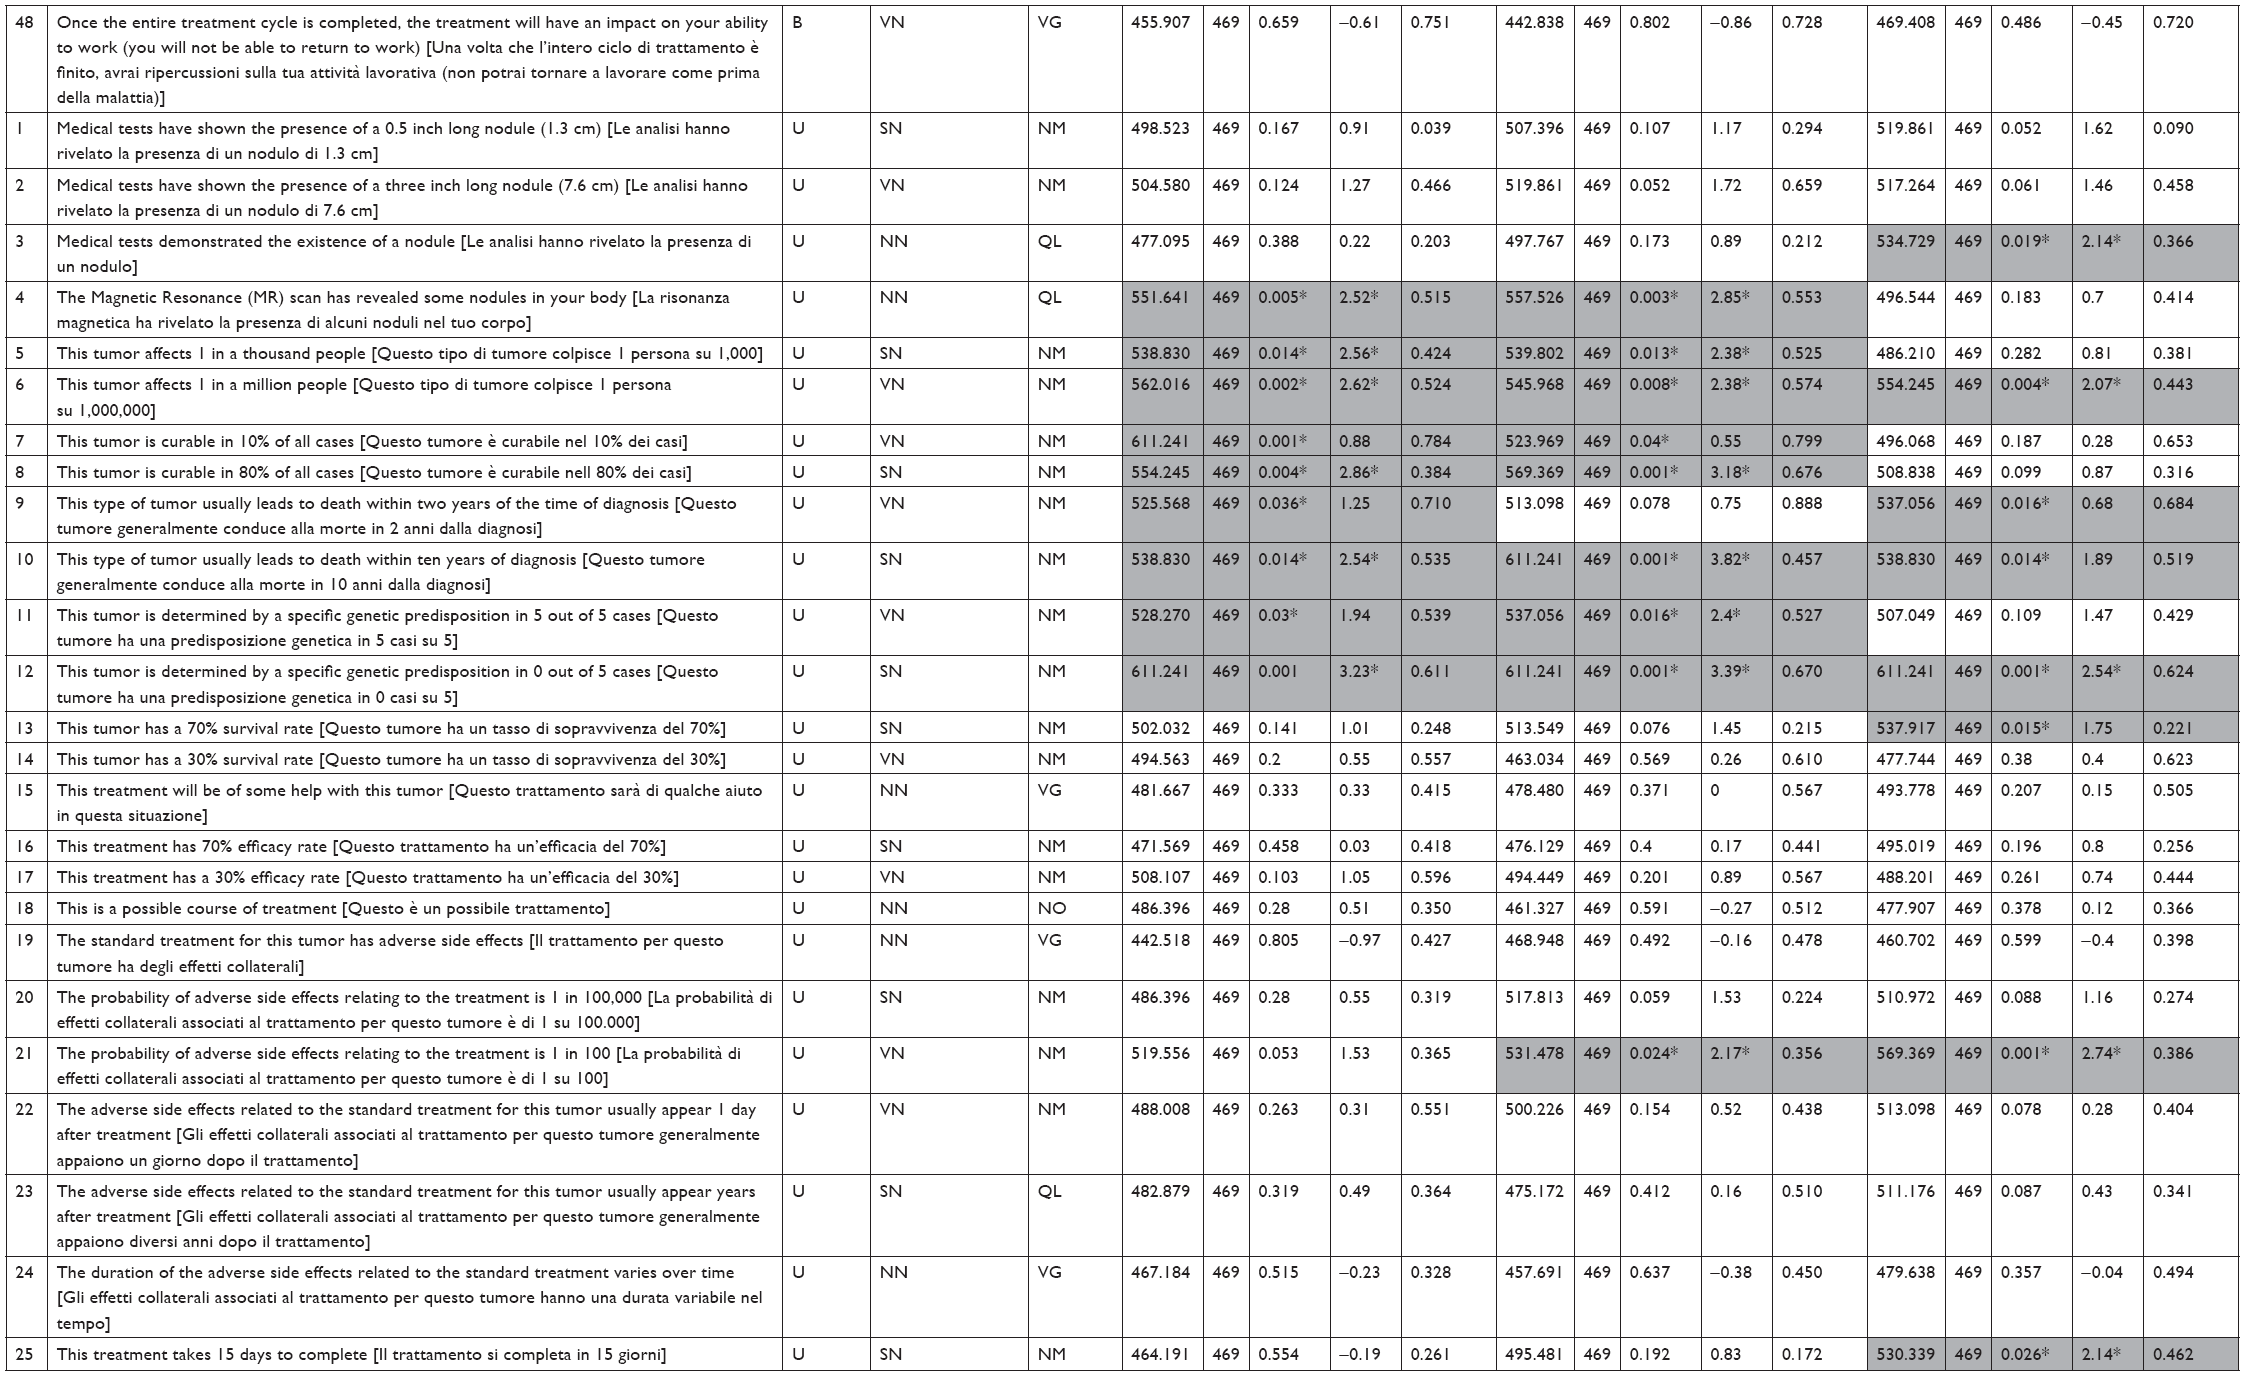 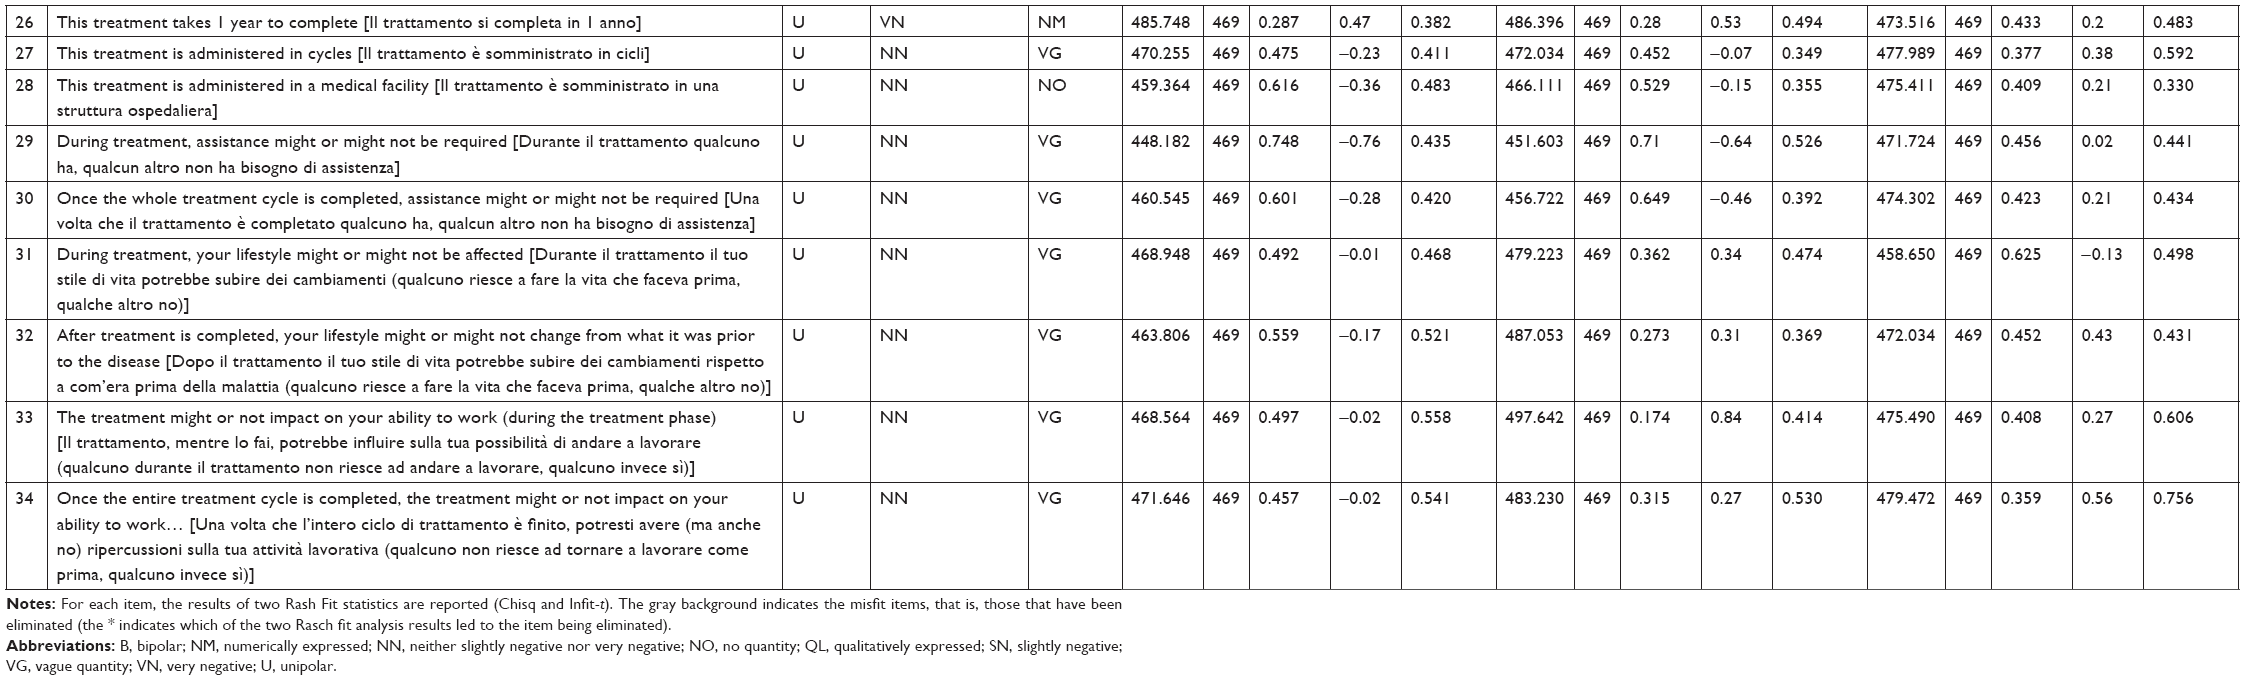 | Table S1 Complete list of the items used in the questionnaire and the corresponding classification of each item in terms of Polarity99 |
 © 2018 The Author(s). This work is published and licensed by Dove Medical Press Limited. The full terms of this license are available at https://www.dovepress.com/terms.php and incorporate the Creative Commons Attribution - Non Commercial (unported, v3.0) License.
By accessing the work you hereby accept the Terms. Non-commercial uses of the work are permitted without any further permission from Dove Medical Press Limited, provided the work is properly attributed. For permission for commercial use of this work, please see paragraphs 4.2 and 5 of our Terms.
© 2018 The Author(s). This work is published and licensed by Dove Medical Press Limited. The full terms of this license are available at https://www.dovepress.com/terms.php and incorporate the Creative Commons Attribution - Non Commercial (unported, v3.0) License.
By accessing the work you hereby accept the Terms. Non-commercial uses of the work are permitted without any further permission from Dove Medical Press Limited, provided the work is properly attributed. For permission for commercial use of this work, please see paragraphs 4.2 and 5 of our Terms.