Back to Journals » Infection and Drug Resistance » Volume 15
The Novel Predictive Biomarkers for Type 2 Diabetes Mellitus in Active Pulmonary Tuberculosis Patients
Authors Yu Q, Weng W, Luo H, Yan J, Zhao X
Received 6 June 2022
Accepted for publication 4 August 2022
Published 13 August 2022 Volume 2022:15 Pages 4529—4539
DOI https://doi.org/10.2147/IDR.S377465
Checked for plagiarism Yes
Review by Single anonymous peer review
Peer reviewer comments 2
Editor who approved publication: Professor Suresh Antony
Qi Yu,1 Wujin Weng,2 Hong Luo,3 Jisong Yan,3 Xin Zhao4
1Department of Infectious Diseases, Wuhan Jinyintan Hospital, Tongji Medical College of Huazhong University of Science and Technology; Hubei Clinical Research Center for Infectious Diseases; Wuhan Research Center for Communicable Disease Diagnosis and Treatment, Chinese Academy of Medical Sciences; Joint Laboratory of Infectious Diseases and Health, Wuhan Institute of Virology and Wuhan Jinyintan Hospital, Chinese Academy of Sciences, Wuhan, 430023, People’s Republic of China; 2Department of Oncology, Quzhou Hospital of Traditional Chinese Medicine, Zhejiang University of Chinese Medicine, Quzhou, 310053, People’s Republic of China; 3Department of Respiratory and Critical Care Medicine, Wuhan Jinyintan Hospital, Tongji Medical College of Huazhong University of Science and Technology; Hubei Clinical Research Center for Infectious Diseases; Wuhan Research Center for Communicable Disease Diagnosis and Treatment, Chinese Academy of Medical Sciences; Joint Laboratory of Infectious Diseases and Health, Wuhan Institute of Virology and Wuhan Jinyintan Hospital, Chinese Academy of Sciences, Wuhan, 430023, People’s Republic of China; 4Department of Pediatrics, The Fifth Affiliated Hospital of Guangzhou Medical University, Guangzhou, 510799, People’s Republic of China
Correspondence: Jisong Yan, Department of Respiratory and Critical Care Medicine, Wuhan Jinyintan Hospital, Tongji Medical College of Huazhong University of Science and Technology, Wuhan, 430023, People’s Republic of China, Email [email protected] Xin Zhao, Department of Pediatrics, The Fifth Affiliated Hospital of Guangzhou Medical University, Guangzhou, 510799, People’s Republic of China, Email [email protected]
Purpose: This study was to explore the predictive value of monocyte to high-density lipoprotein cholesterol ratio (MHR), neutrophils to high-density lipoprotein cholesterol ratio (NHR), C-reactive protein-to-lymphocyte ratio (CLR), and C-reactive protein-to-albumin ratio (CAR) for type 2 diabetes mellitus (T2DM) in patients with active pulmonary tuberculosis (APTB).
Patients and Methods: A total of 991 active pulmonary tuberculosis (APTB) patients (201 with T2DM) were hospitalized in the Department of Tuberculosis, Wuhan Jinyintan Hospital, Tongji Medical College, Huazhong University of Science and Technology were included. The routine blood examination indicators and biochemical parameters were collected to calculate MHR, NHR, CLR, and CAR. The Pearson correlation analysis, Univariate Logistic regression analysis, and receiver operating characteristic (ROC) curve analysis were performed to assess the predictive value of MHR, NHR, CLR, and CAR for APTB-T2DM patients.
Results: The levels of MHR, NHR, CLR, and CAR in the APTB-T2DM patients were significantly higher than in the APTB-no T2DM patients (P < 0.05). Additionally, the MHR, NHR, CLR, and CAR have a positive correlation with fasting blood glucose in the whole study population. However, in the APTB-T2DM patients, MHR, NHR, and CAR were not correlated with fasting blood glucose, and only CLR was positively correlated with fasting blood glucose. The area under curve (AUC) predicting APTB-T2DM patients of the MHR, NHR, CLR, and CAR was 0.632, 0.72, 0.715, and 0.713, respectively. Further, univariate logistic regression analyses showed that the higher MHR, NHR, CLR, and CAR were independent risk factors for APTB-T2DM (P < 0.01). The MHR, NHR, CLR, and CAR quartiles were used to divide the APTB patients into four groups for further analysis. The prevalence of T2DM was significantly higher in APTB individuals as MHR, NHR, CLR, and CAR values increased (P < 0.05).
Conclusion: MHR, NHR, CLR, and CAR are simple and practicable inflammatory parameters that could be used for assessing T2DM in APTB. APTB patients have a greater possibility to be diagnosed with T2DM with the higher MHR, NHR CLR, and CAR values. Therefore, more attention should be given to the indicator in the examination of APTB.
Keywords: active pulmonary tuberculosis, type 2 diabetes mellitus, MHR, NHR, CLR, CAR
Introduction
Both tuberculosis (TB) and type 2 diabetes mellitus were high diseases burden for Chinese people. In 2020, there were nearly 5.8 million new cases of TB and 1.3 million fatalities from TB globally,1 and more than 80% of these were pulmonary TB (PTB).2 In addition, currently, owing to the rapidly growing incidence of obesity and unhealthy diet patterns, the prevalence of type 2 diabetes mellitus (T2DM) has significantly increased, especially in developing countries,3,4 which imposes a serious economic burden on the patients and societies. There are also data suggesting that stopping the rise of diabetes mellitus (DM) would prevent TB deaths in countries with a high TB burden. Meanwhile, TB patients with DM (TB-DM) have a greater possibility to present with pulmonary TB, cavitary TB, and drug-resistant TB compared to TB patients without DM (TB-no DM), and it takes longer anti-TB treatment time for sputum smear-positive TB-DM patients to achieve sputum smear negative.4,5
Although the pathogenesis of TB and T2DM has not been fully clarified, the role of inflammation in the pathophysiology of T2DM and TB has received increasing attention.6–8 Previous studies suggested that the levels of hormones with pro-inflammatory properties, such as leptin, in T2DM or TB patients were significantly higher than in healthy controls, and hormones with anti-inflammatory properties are reduced such as cortisol. Similarly, inflammatory cytokines such as CRP, IL-6, and IL-1β also showed the same alterations in TB and DM patients. Interestingly, Pavan Kumar et al found that comorbid T2DM resulted in the pro-inflammatory adipokine leptin levels increased, while anti-inflammatory adiponectin levels decreased compared to those of TB patients without T2DM.9 Importantly, these change to be independent of BMI.9,10 These data suggested that both of them may share common pathophysiological mechanisms, especially in inflammation.11
Leukocyte subtypes such as monocyte, neutrophil, and lymphocyte produce an important effect on immune and chronic inflammation.12–14 Meanwhile, inflammatory cytokines could regulate the function of monocyte, neutrophil, and lymphocyte.13,15,18 The previous study showed that the monocyte count is a prognostic biomarker in idiopathic pulmonary fibrosis,17 neutrophil count is an independent predictor of the radiologic severity of PTB at treatment end,18 and Lymphocytopenia represented critical inflammatory states.19 The study also demonstrated increased monocyte,20 increased neutrophil,21 and decreased lymphocyte22 in T2DM patients. In addition, CRP is one of the most commonly used markers reflecting the systemic inflammatory response. A previous study showed that the levels of CRP could predict the development of T2DM23 and the trends in CRP may evaluate early response to treatment among individuals with HIV/multidrug-resistant tuberculosis co-infection.24 On the contrary, HDL12,16 and serum ALB25 have anti-inflammatory and antioxidant effects. Additionally, HDL molecules also have inhibitory effects on the control of activation of monocyte and neutrophil, and the proliferation of monocytes12 and neutrophils.26,27 Therefore, monocytes, neutrophils, and CRP play a pro-inflammatory role, while lymphocytes, HDL, and ALB act as a reversal factor. Higher monocyte counts, higher neutrophil counts, higher CRP, lower HDL, lower lymphocyte, and lower ALB levels serve as indirect indicators of inflammation and development of T2DM. The relationship among monocyte counts, neutrophil counts, lymphocyte counts, CRP, albumin and HDL-c provides a better understanding of inflammation in APTB-T2DM patients.
Recently, monocyte to high-density lipoprotein cholesterol ratio (MHR), neutrophils to high-density lipoprotein cholesterol ratio (NHR), C-reactive protein-to-lymphocyte ratio (CLR), and C-reactive protein-to-albumin ratio (CAR) have attracted extensive attention. Elevated MHR,12,28,29 NHR,30–32 CLR,33–35 and CAR36–38 have been proved to be related to numerous disorders. However, to date, there is no literature on an association between MHR, NHR, CLR and CAR, and APTB-T2DM patients. This study sought to assess the association between the novel inflammatory biomarkers and APTB-T2DM patients.
Materials and Methods
Patients and Study Design
A total of 991 APTB patients were recruited at Wuhan Jinyintan Hospital, Tongji Medical College, Huazhong University of Science and Technology (Infectious disease hospital). According to the criteria of type 2 diabetes mellitus international criteria (WHO/ADA),39 the APTB patients were divided into two groups, namely, the APTB-no T2DM group and the APTB-T2DM group. The inclusion criteria were as follows: (1) APTB patients: microbiological examination (including smear microscopy, M. tuberculosis cultures, and nucleic acid amplification (NAA) assays (such as PCR and Xpert MTB/RIF)) is positive; (2) T2DM patients: Conforming to the criteria of diabetes international criteria (WHO/ADA). The exclusion criteria were as follows: ①age <17 years old; ② type I diabetes mellitus or diabetic complications such as a diabetic foot or diabetic nephropathy; ③no information available; ④HIV infection, known primary immunodeficiency or taking immunosuppressive medication; ⑤ malignant tumors, familial hereditary disease, or other inflammatory infectious disease; ⑥extrapulmonary TB.
Data Collection
Demographic variables (age and sex), and the results from laboratory examinations, such as blood cell count, high-density lipoprotein (HDL), albumin (ALB), and C-reactive protein (CRP), were all obtained from the electronic medical record (EMR) system. The calculation formula of each indicator was as follows: MHR = monocyte (*10^9/L)/high-density lipoprotein cholesterol (mmol/L), neutrophils (*10^9/L)/high-density lipoprotein cholesterol (mmol/L), C-reactive protein (mg/L)/lymphocyte (*10^9/L), and C-reactive protein (mg/L)/Albumin (g/L).
Statistical Analyses
The SPSS (Version 20.0; Chicago, IL, USA) software was used to perform the statistical analysis of the data. Continuous data were analyzed by Student’s t-test and presented as mean ± standard error (SE). Chi-Square test was used to compare categorical variables expressed as the number of patients and percentage. The Pearson or Spearman correlation analysis was performed to explore the association between the novel inflammatory biomarkers and fasting blood glucose in the Whole Study Population and APTB-T2DM patients. The univariate logistic regression was used to investigate the risk factors affecting T2DM in APTB patients. Receiver operating characteristic (ROC) curve was used to evaluate MHR, NHR, CLR and CAR values and to predict T2DM in APTB patients. According to the MHR, NHR, CLR, and CAR quartiles, the APTB patients were divided into different four groups, respectively. The Chi-Square test was used to compare the incidence rate of T2DM in APTB patients in MHR, NHR, CLR, and CAR subgroups. A two-sided P-value was always computed, and the statistical significance was taken at p < 0.05.
Results
Patient Characteristics
In total, 991 APTB individuals, including 790 APTB patients without T2DM (APTB-no T2DM) and 201 APTB patients with T2DM (APTB-T2DM) were recruited. In APTB-no T2DM group, 504 were male and 286 were female, and the average age is 44.05 ± 0.74 years. In APTB-T2DM group, 103 males and 48 females were included, and the average age is 53.62 ± 1.04 years. Additionally, the levels of MHR, NHR, CLR, and CAR in APTB-T2DM group were significantly higher than those in APTB-no T2DM group (P < 0.001, P < 0.001, P < 0.001, P <0.001, respectively). The clinical and demographic characteristics are shown in Table 1.
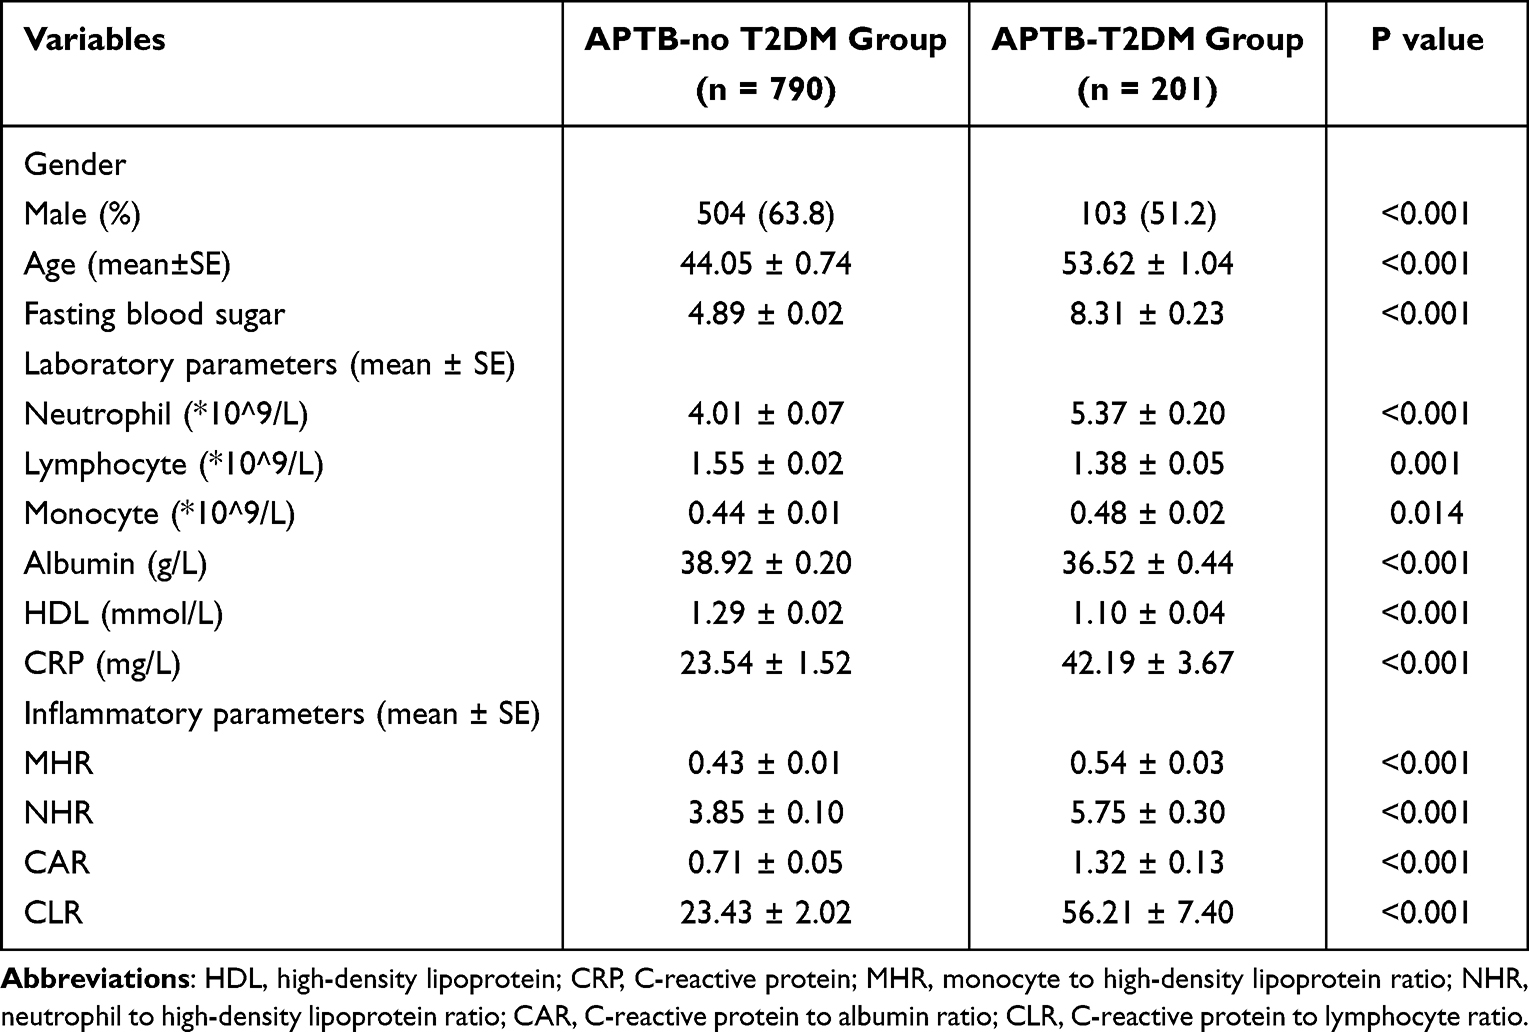 |
Table 1 Demographic and Clinical Characteristics of Study Participants |
Correlation of Inflammatory Parameters with Fasting Blood Sugar in the Whole Study Population and APTB-T2DM Patients
To further explore the predictive values of MHR, NHR, CLR, and CAR for APTB-T2DM patients, the Pearson or Spearman correlation analysis showed that MHR, NHR, CLR and CAR have positive correlation with fasting blood glucose (r = 0.096, P = 0.003; r = 0.200, P < 0.001; r = 0.181, P < 0.001; r = 0.143, P < 0.001; respectively) in the whole study population (Figure 1). However, there was no correlation between MHR (Figure 2A), NHR (Figure 2B) and CAR (Figure 2D), and fasting blood glucose (r = 0.019, P = 0.791; r = 0.078, P = 0.270; r = 0.116, P = 0.102; respectively) in the APTB-T2DM patients, and only CLR has positive correlation with fasting blood glucose (r = 0.169, P = 0.016) (Figure 2C).
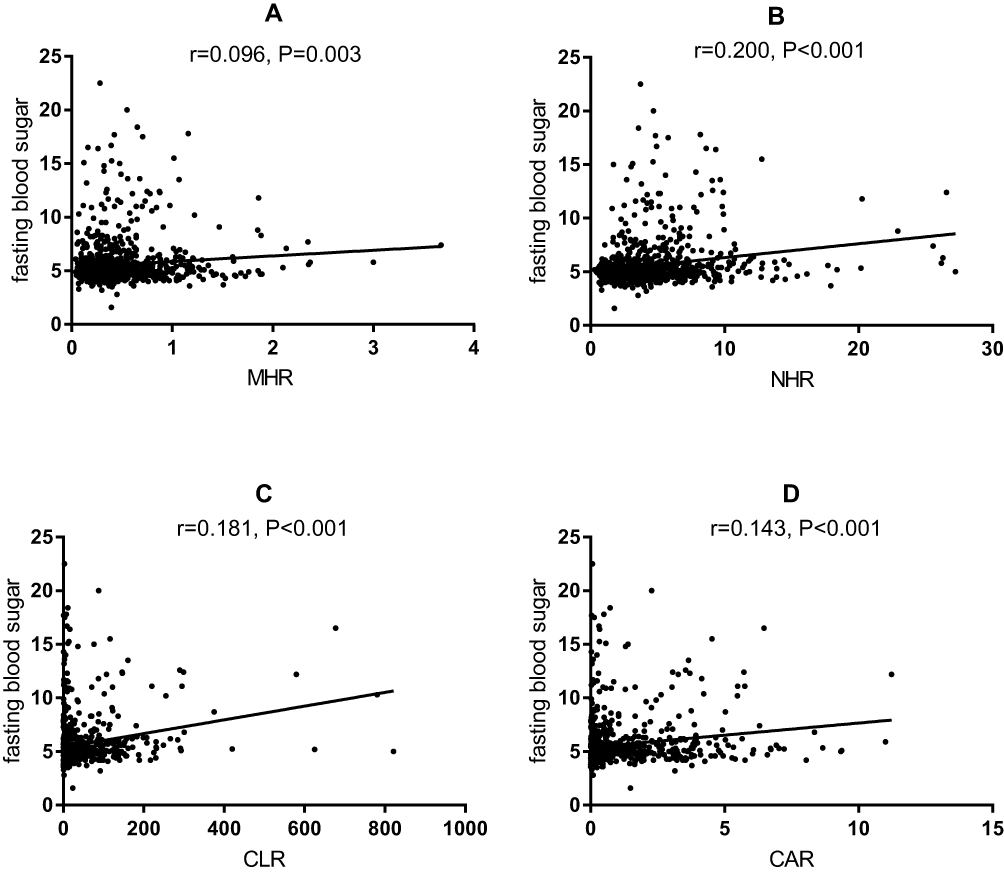 |
Figure 1 Correlation analysis between the inflammatory parameters and fasting blood sugar in the whole population (n =991). Abbreviations: MHR, monocyte to high-density lipoprotein ratio; NHR, neutrophil to high-density lipoprotein ratio; CAR, C-reactive protein-to-albumin ratio; CLR, C-reactive protein-to-lymphocyte ratio. Notes: (A) The correlation analysis between MHR and fasting blood sugar in the whole population. (B) The correlation analysis between NHR and fasting blood sugar in the whole population. (C) The correlation analysis between CLR and fasting blood sugar in the whole population. (D) The correlation analysis between CAR and fasting blood sugar in the whole population. |
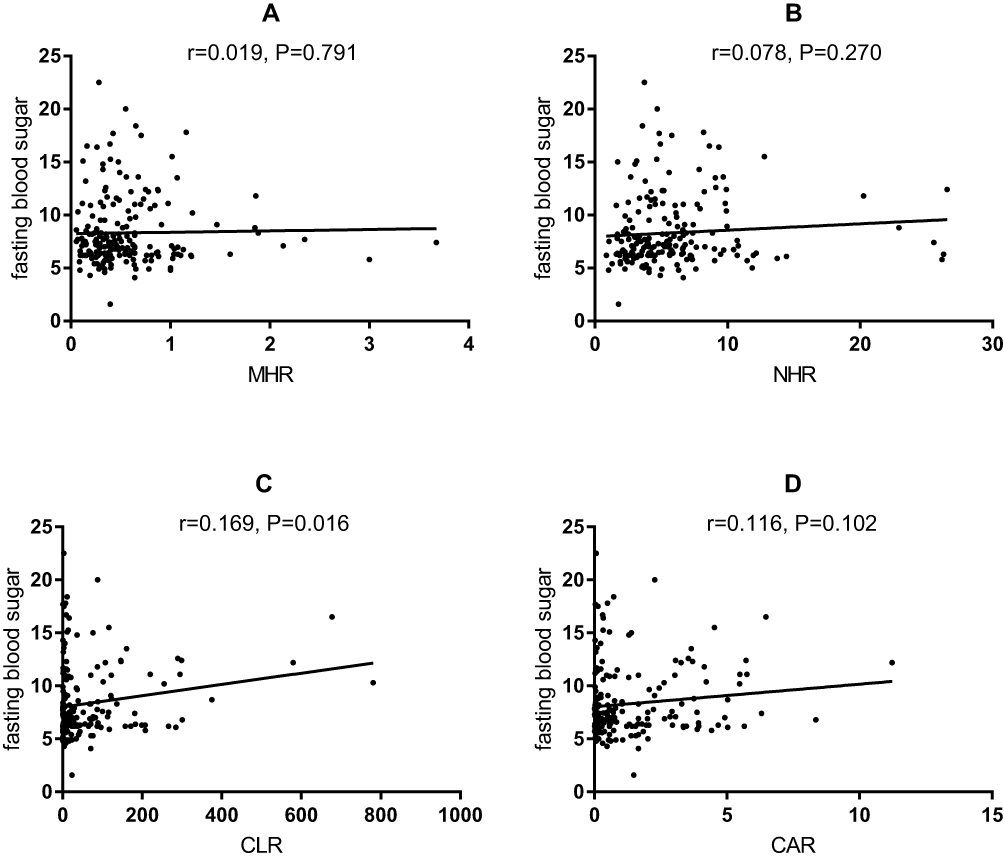 |
Figure 2 Correlation analysis between the inflammatory parameters and fasting blood sugar in the APTB-T2DM patients (n =991). Abbreviations: MHR, monocyte to high-density lipoprotein ratio; NHR, neutrophil to high-density lipoprotein ratio; CAR, C-reactive protein-to-albumin ratio; CLR, C-reactive protein-to-lymphocyte ratio. Notes: (A) The correlation analysis between MHR and fasting blood sugar in the APTB-T2DM patients. (B) The correlation analysis between NHR and fasting blood sugar in the APTB-T2DM patients. (C) The correlation analysis between CLR and fasting blood sugar in the APTB-T2DM patients. (D) The correlation analysis between CAR and fasting blood sugar in the APTB-T2DM patients. |
Evaluation of the Impact of Inflammatory Parameters on T2DM with APTB
A ROC analysis to determine whether MHR, NHR, CLR and LAR can be a diagnostic and prognostic marker in APTB-T2DM patients revealed MHR (AUC: 0.637, P < 0.001), NHR (AUC: 0.694, P < 0.001), CLR (AUC: 0.621, P < 0.001), CAR (AUC: 0.633, P < 0.001) and LAR (AUC: 0.627, P < 0.001) in comparison between APTB patients and APTB-T2DM patients (Figure 3). Odds ratios generated by applying univariate logistic regression analysis are shown in Figure 4. Higher MHR, NHR, CLR, CAR values were all significant in predicting T2DM in APTB patients. The univariate logistic regression analysis showed that MHR, NHR, CLR, CAR, Gender and age were independently associated with an increased T2DM risk (Figure 4).
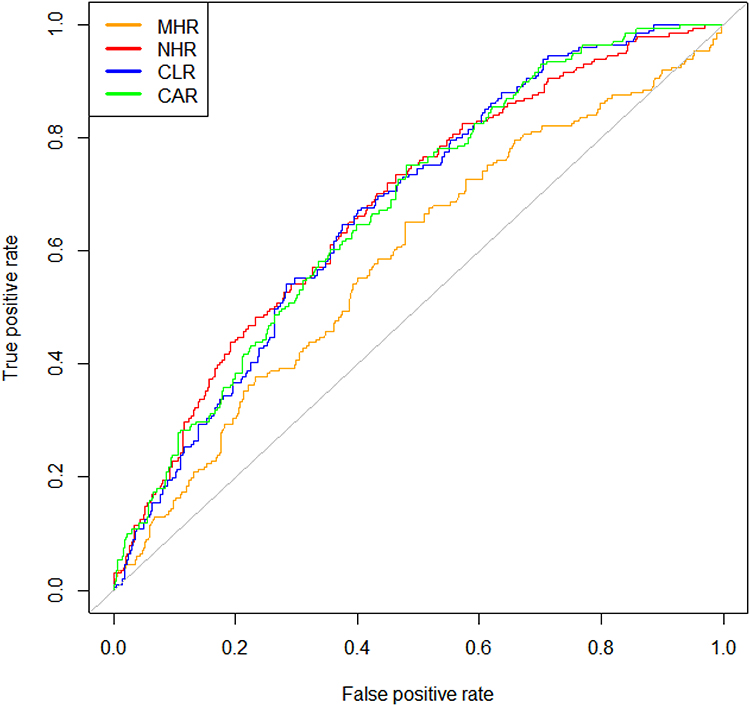 |
Figure 3 Receiver operating characteristic (ROC) curve analysis of the inflammatory parameters. The area under the ROC curve (AUC) values in the MHR, NHR, CLR, and CAR were 0.632(95%confidence interval: 0.542–0.632), 0.72(95% confidence interval: 0.639–0.720), 0.715(95%confidence interval: 0.637–0.715), and 0.713 (95%confidence interval: 0.636–0.713), respectively. Abbreviations: MHR, monocyte to high-density lipoprotein ratio; NHR, neutrophil to high-density lipoprotein ratio; CAR, C-reactive protein-to-albumin ratio; CLR, C-reactive protein-to-lymphocyte ratio. |
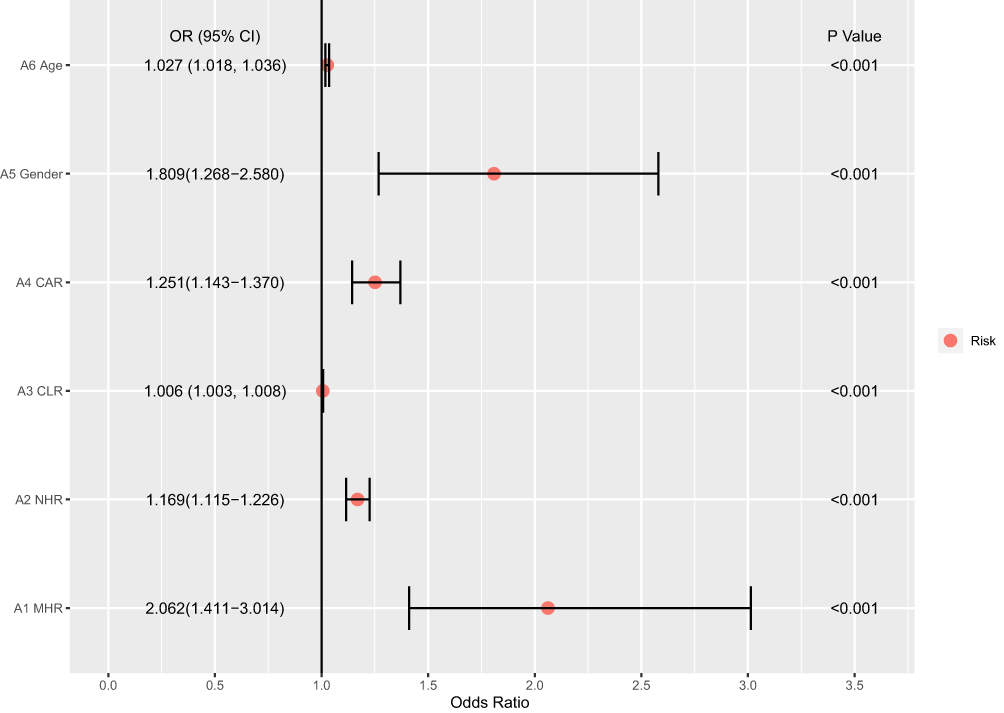 |
Figure 4 The univariate logistic regression analyses for APTB-T2DM patients. Abbreviations: MHR, monocyte to high density-lipoprotein ratio; NHR, neutrophil to high-density lipoprotein ratio; CAR, C-reactive protein-to-albumin ratio; CLR, C-reactive protein-to-lymphocyte ratio. |
The Prevalence of T2DM Among Different Quartiles of MHR, NHR, CLR, and CAR
To further explore the role of MHR, NHR, CLR, and CAR in APTB-T2DM, the APTB patients were divided into four different groups, respectively, according to the MHR, NHR, CLR, and CAR quartiles. Figure 5 shows that the prevalence of T2DM in APTB patients would increase with the MHR, NHR, CLR, and CAR values increasing, which suggested that APTB patients with higher MHR, NHR, CLR, and CAR values had a significantly higher prevalence of T2DM.
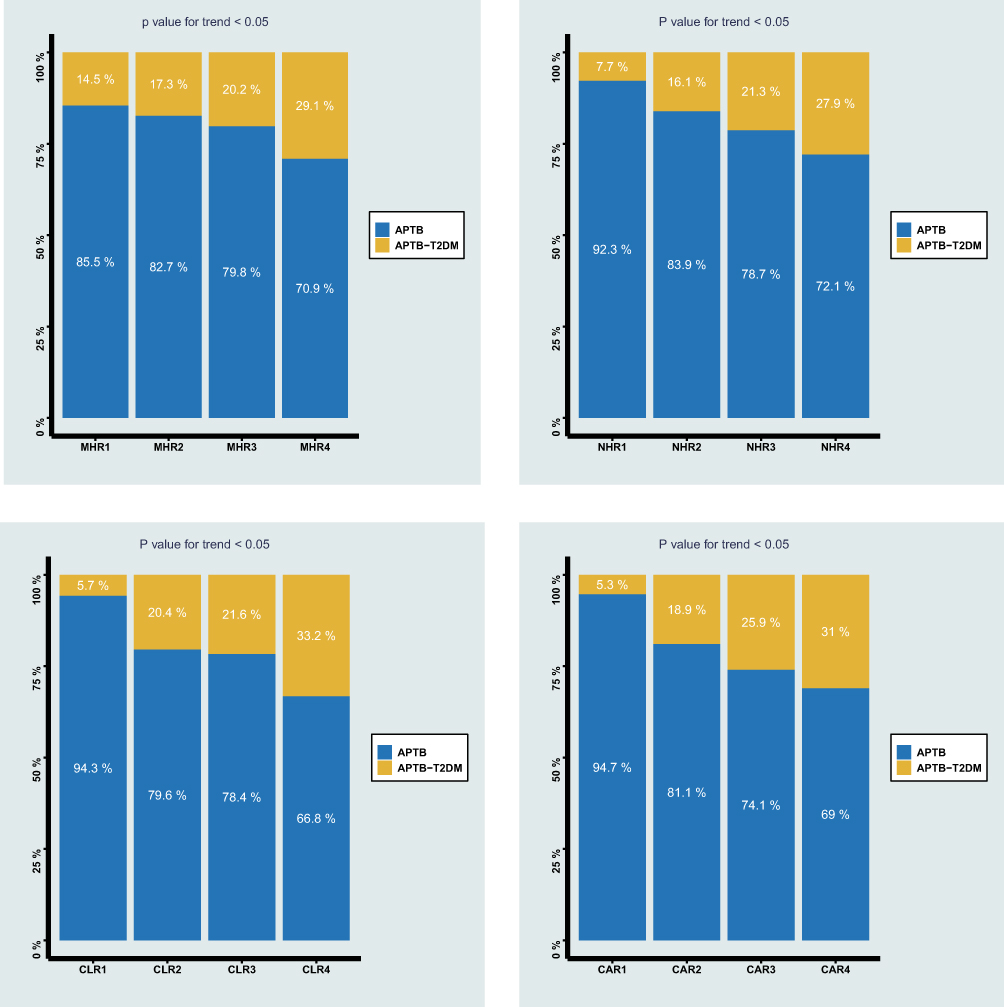 |
Figure 5 The prevalence of APTB-T2DM patients among different quartiles of monocyte to MHR, NHR, CLR, and CAR. Abbreviations: MHR, monocyte to high-density lipoprotein ratio; NHR, neutrophil to high-density lipoprotein ratio; CAR, C-reactive protein-to-albumin ratio; CLR, C-reactive protein-to-lymphocyte ratio. |
Discussion
In recent years, MHR, NHR, CLR, and CAR were proven to be novel inflammatory biomarker indices. Because of convenient obtaining, they possess relatively higher clinical values. Nonetheless, it is worth noting that there is currently no literature on the relationship between the novel inflammatory parameters and APTB-T2DM. Previous research has reported that the prevalence of T2DM in the TB population reached approximately 33.3%.40 Our study showed the prevalence of T2MD is reaching 20.28% in PTB patients, which is lower than the previous report. The possible reason for the results is that the subjects in this study are PTB patients rather than TB patients. Moreover, the previous study population is small, with only more than 100 cases. Although the pathogenesis of the T2DM and TB comorbid disorders has been extensively studied, the exact molecular mechanisms are still unclear. Interestingly, the effects of inflammation in the pathogenesis of T2DM and TB have attracted more and more attention.2 The previous various studies had reported that the levels of pro-inflammatory cytokines in TB-DM patients are significantly higher than those in TB patients alone.41,42 Similarly, our results showed that the APTB-T2DM group has higher levels of MHR, NHR, CLR, and CAR than the APTB-no T2DM group, suggesting that APTB-T2DM patients have a higher level of inflammation. Furthermore, when the study population was divided by MHR, NHR, CLR, and CAR quartiles, the prevalence of T2DM increased as the MHR value, NHR value, CLR value, and CAR value increased, suggesting that APTB patients with higher values of MHR, NHR, CLR, and CAR are more likely to be combined with T2DM. The results of CAR in our study were similar to the previous report that the CAR is a predictor of diabetes and positively correlated with the incidence of T2DM.25 In addition, the previous report clarified that MHR and NHR are associated with diabetes mellitus. MHR and NHR represented the prognosis of diabetic nephropathy patients20 and COVID-19 with DM patients,32 respectively. Moreover, MHR was also considered a marker in diabetic nephropathy patients43 and diabetes patients with polyneuropathy.44 Additionally, CLR proved relevant to a variety of cancers. Hwang et al recently demonstrated that the CLR was a determinant biomarker in overall survival and disease-specific survival in gastric carcinoma patients.45 The higher CLR maybe represent a poor long-term outcome in colorectal liver metastases patients after hepatic resection.33 Interestingly, there is no report to research the relationship between CLR and diabetes at present; the present study is the first report.
Further, in this study, elevated MHR, NHR, CLR, and CAR in T2DM patients with APTB were confirmed. In the whole population, Pearson correlation analysis demonstrated that the MHR, NHR, CLR, and CAR are positively related to fasting blood glucose. This is roughly consistent with a previous study that hyperglycemia enhances the inflammatory state and releases more neutrophils and monocytes from the bone marrow.46 Similarly, CLR is positively related to the fasting blood glucose in APTB-T2DM patients. Unfortunately, there is no correlation between MHR, NHR, and CAR, and the fasting blood glucose in APTB patients with T2DM. The possible reason is that a part of APTB-T2DM patients has been treated with hypoglycemic drugs or insulin. Therefore, further research is needed to find whether the levels of MHR, NHR, and CAR are associated with the fasting blood glucose in APTB-T2DM. Additionally, the ROC curve showed that the AUC value of MHR, NHR, CLR, and CAR for APTB-T2DM was 0.632, 0.72, 0.715, and 0.713, respectively. These results suggested that MHR, NHR, CLR, and CAR had high diagnostic values in APTB-T2DM. For further study, the univariate logistic regression analysis shows that MHR, NHR, CLR, and CAR levels were significantly higher in the group with T2DM compared with the group without T2DM, and the odds ratios suggested that MHR, NHR, CLR, and CAR were considered as risk factors for the occurrence of T2DM in APTB patients. Previous studies have shown that numerous diseases are associated with these inflammatory parameters. The acute intracerebral hemorrhage patients with higher MHR values were associated with an increased risk of disability or death according to research by Usta et al.12 Wang32 and Tonduangu34 also proved that NHR and CLR could predict the severity and mortality associated with SARS-CoV-2 infection. And CAR is an easily available and independent prognostic marker in locally advanced Non-Small Cell Lung Cancer after CRT.36 It is worth noting that these parameters are being reported for the first time on T2DM in patients with APTB.
We also found that “higher age” and “male” were independent risk factors for APTB-T2DM patients. These results are roughly similar to the previous literature. Kautzky-Willer et al demonstrated that males have 14 million times more diabetes than females and the incidence rate of diabetes increases with age.47 A previous study also showed that the prevalence of diabetes, especially type 2 diabetes, increases with age48 due to fat distribution changes.49
Conclusion
In conclusion, MHR, NHR, CLR, and CAR are simple and useful inflammatory parameters for assessing APTB-T2DM. Additionally, APTB patients have a greater possibility to be diagnosed with T2DM with the higher MHR, NHR CLR, and CAR values. Therefore, much more attention should be paid to the indicators in the examination of APTB.
Data Sharing Statement
The datasets used in this study are obtainable from the corresponding author on request.
Ethics Statement
The study was conducted according to the good clinical practice guidelines and the Declaration of Helsinki. The Ethics Committee of Wuhan Jinyintan Hospital (KY-2022-06.01) reviewed and approved this study protocol and approved that informed consent was signed by all patients or their family members
Author Contributions
All authors made a significant contribution to the work reported, whether that is in the conception, study design, execution, acquisition of data, analysis and interpretation, or in all these areas; took part in drafting, revising or critically reviewing the article; gave final approval of the version to be published; have agreed on the journal to which the article has been submitted; and agree to be accountable for all aspects of the work.
Funding
There is no funding to report.
Disclosure
All authors have no competing interests to report.
References
1. World Health Organization. Global tuberculosis report 2021; 2021.
2. Cui EN, Yu T, Shang S-J, et al. Radiomics model for distinguishing tuberculosis and lung cancer on computed tomography scans. World J Clin Cases. 2020;8(21):5203–5212. doi:10.12998/wjcc.v8.i21.5203
3. Fu X, Liu H, Liu J, et al. Association between triglyceride-glucose index and the risk of type 2 diabetes mellitus in an older Chinese population aged over 75 years. Front Public Health. 2021;9:796663. doi:10.3389/fpubh.2021.796663
4. Pan S-C, Ku C-C, Kao D, Ezzati M, Fang C-T, Lin -H-H. Effect of diabetes on tuberculosis control in 13 countries with high tuberculosis: a modelling study. Lancet Diabetes Endocrinol. 2015;3(5):323–330. doi:10.1016/S2213-8587(15)00042-X
5. Restrepo BI. Diabetes and tuberculosis. Microbiol Spectr. 2016;4(6). doi:10.1128/microbiolspec.TNMI7-0023-2016
6. Lontchi-Yimagou E, Sobngwi E, Matsha TE, Kengne AP. Diabetes mellitus and inflammation. Curr Diab Rep. 2013;13(3):435–444. doi:10.1007/s11892-013-0375-y
7. Calle MC, Fernandez ML. Inflammation and type 2 diabetes. Diabetes Metab. 2012;38(3):183–191. doi:10.1016/j.diabet.2011.11.006
8. Racanelli AC, Kikkers SA, Choi AMK, Cloonan SM. Autophagy and inflammation in chronic respiratory disease. Autophagy. 2018;14(2):221–232. doi:10.1080/15548627.2017.1389823
9. Pavan Kumar N, Nair D, Banurekha VV, et al. Type 2 diabetes mellitus coincident with pulmonary or latent tuberculosis results in modulation of adipocytokines. Cytokine. 2016;79:74–81. doi:10.1016/j.cyto.2015.12.026
10. Fernández RDV, Díaz A, Bongiovanni B, et al. Evidence for a more disrupted immune-endocrine relation and cortisol immunologic influences in the context of tuberculosis and type 2 diabetes comorbidity. Front Endocrinol (Lausanne). 2020;11:126. doi:10.3389/fendo.2020.00126
11. Webber T, Ronacher K, Conradie-Smit M, Kleynhans L. Interplay between the immune and endocrine systems in the lung: implications for TB susceptibility. Front Immunol. 2022;13:829355. doi:10.3389/fimmu.2022.829355
12. Usta A, Avci E, Bulbul CB, Kadi H, Adali E. The monocyte counts to HDL cholesterol ratio in obese and lean patients with polycystic ovary syndrome. Reprod Biol Endocrinol. 2018;16(1):34. doi:10.1186/s12958-018-0351-0
13. Soehnlein O, Steffens S, Hidalgo A, Weber C. Neutrophils as protagonists and targets in chronic inflammation. Nat Rev Immunol. 2017;17(4):248–261. doi:10.1038/nri.2017.10
14. Kurtul A, Yarlioglues M, Murat SN, et al. Usefulness of the platelet-to-lymphocyte ratio in predicting angiographic reflow after primary percutaneous coronary intervention in patients with acute ST-segment elevation myocardial infarction. Am J Cardiol. 2014;114(3):342–347. doi:10.1016/j.amjcard.2014.04.045
15. Cronkite DA, Strutt TM. The regulation of inflammation by innate and adaptive lymphocytes. J Immunol Res. 2018;2018:1467538. doi:10.1155/2018/1467538
16. Akboga MK, Balci KG, Maden O, et al. Usefulness of monocyte to HDL-cholesterol ratio to predict high SYNTAX score in patients with stable coronary artery disease. Biomark Med. 2016;10(4):375–383. doi:10.2217/bmm-2015-0050
17. Kreuter M, Lee JS, Tzouvelekis A, et al. Monocyte count as a prognostic biomarker in patients with idiopathic pulmonary fibrosis. Am J Respir Crit Care Med. 2021;204(1):74–81. doi:10.1164/rccm.202003-0669OC
18. Jones TPW, Dabbaj S, Mandal I, et al. The blood neutrophil count after 1 month of treatment predicts the radiologic severity of lung disease at treatment end. Chest. 2021;160(6):2030–2041. doi:10.1016/j.chest.2021.07.041
19. Li L, Ma Y, Geng X-B, et al. Platelet-to-lymphocyte ratio relates to poor prognosis in elderly patients with acute myocardial infarction. Aging Clin Exp Res. 2021;33(3):619–624. doi:10.1007/s40520-020-01555-7
20. Karatas A, Turkmen E, Erdem E, Dugeroglu H, Kaya Y. Monocyte to high-density lipoprotein cholesterol ratio in patients with diabetes mellitus and diabetic nephropathy. Biomark Med. 2018;12(9):953–959. doi:10.2217/bmm-2018-0048
21. Wang S-Y, Shen -T-T, Xi B-L, Shen Z, Zhang X. Vitamin D affects the neutrophil-to-lymphocyte ratio in patients with type 2 diabetes mellitus. J Diabetes Investig. 2021;12(2):254–265. doi:10.1111/jdi.13338
22. Assulyn T, Khamisy-Farah R, Nseir W, Bashkin A, Farah R. Neutrophil-to-lymphocyte ratio and red blood cell distribution width as predictors of microalbuminuria in type 2 diabetes. J Clin Lab Anal. 2020;34(7):e23259. doi:10.1002/jcla.23259
23. Pradhan AD, Manson JE, Rifai N, Buring JE, Ridker PM. C-reactive protein, interleukin 6, and risk of developing type 2 diabetes mellitus. JAMA. 2001;286(3):327–334. doi:10.1001/jama.286.3.327
24. Cudahy PGT, Warren JL, Cohen T, Wilson D. Trends in C-reactive protein, D-dimer, and fibrinogen during therapy for HIV-associated multidrug-resistant tuberculosis. Am J Trop Med Hyg. 2018;99(5):1336–1341. doi:10.4269/ajtmh.18-0322
25. Cho AR, Lee S-B, Hong K-W, Jung D-H. C-reactive protein-to-albumin ratio and 8-year incidence of type 2 diabetes: the Korean genome and epidemiology study. Acta Diabetol. 2021;58(11):1525–1532. doi:10.1007/s00592-021-01755-1
26. Tolani S, Pagler TA, Murphy AJ, et al. Hypercholesterolemia and reduced HDL-C promote hematopoietic stem cell proliferation and monocytosis: studies in mice and FH children. Atherosclerosis. 2013;229(1):79–85. doi:10.1016/j.atherosclerosis.2013.03.031
27. Murphy AJ, Woollard KJ, Suhartoyo A, et al. Neutrophil activation is attenuated by high-density lipoprotein and apolipoprotein A-I in in vitro and in vivo models of inflammation. Arterioscler Thromb Vasc Biol. 2011;31(6):1333–1341. doi:10.1161/ATVBAHA.111.226258
28. Uslu AU, Sekin Y, Tarhan G, Canakcı N, Gunduz M, Karagulle M. Evaluation of monocyte to high-density lipoprotein cholesterol ratio in the presence and severity of metabolic syndrome. Clin Appl Thromb Hemost. 2018;24(5):828–833. doi:10.1177/1076029617741362
29. You S, Zhong C, Zheng D, et al. Monocyte to HDL cholesterol ratio is associated with discharge and 3-month outcome in patients with acute intracerebral hemorrhage. J Neurol Sci. 2017;372:157–161. doi:10.1016/j.jns.2016.11.022
30. Chen T, Chen H, Xiao H, et al. Comparison of the value of neutrophil to high-density lipoprotein cholesterol ratio and lymphocyte to high-density lipoprotein cholesterol ratio for predicting metabolic syndrome among a population in the Southern Coast of China. Diabetes Metab Syndr Obes. 2020;13:597–605. doi:10.2147/DMSO.S238990
31. Chen G, Yang N, Ren J, et al. Neutrophil counts to high-density lipoprotein cholesterol ratio: a potential predictor of prognosis in acute ischemic stroke patients after intravenous thrombolysis. Neurotox Res. 2020;38(4):1001–1009. doi:10.1007/s12640-020-00274-1
32. Wang Y, Zhang J, Li H, et al. Prognostic value of leucocyte to high-density lipoprotein-cholesterol ratios in COVID-19 patients and the diabetes subgroup. Front Endocrinol. 2021;12:727419. doi:10.3389/fendo.2021.727419
33. Taniai T, Haruki K, Hamura R, et al. The prognostic significance of C-reactive protein-to-lymphocyte ratio in colorectal liver metastases. J Surg Res. 2021;258:414–421. doi:10.1016/j.jss.2020.08.059
34. Tonduangu N, Le Borgne P, Lefebvre F, et al. Prognostic value of C-reactive protein to lymphocyte ratio (CLR) in emergency department patients with SARS-CoV-2 infection. J Pers Med. 2021;11(12):1274. doi:10.3390/jpm11121274
35. Koyuncu S, Ismail O. The role of C-reactive protein to lymphocyte ratio in the differentiation of acute and perforated appendicitis. Ulus Travma Acil Cerrahi Derg. 2020;26(5):760–764. doi:10.14744/tjtes.2020.47973
36. Frey A, Martin D, D’Cruz L, Fokas E, Rödel C, Fleischmann M. C-Reactive protein to albumin ratio as prognostic marker in locally advanced non-small cell lung cancer treated with chemoradiotherapy. Biomedicines. 2022;10(3):598. doi:10.3390/biomedicines10030598
37. Yang X, Yin H, Xiao C, Li R, Liu Y. The prognostic significance of C-reactive protein to albumin ratio in patients with severe fever with thrombocytopenia syndrome. Front Med. 2022;9:879982. doi:10.3389/fmed.2022.879982
38. Cheng L, Meng Z, Wang Q, et al. The usefulness of C-reactive protein to albumin ratio in the prediction of adverse cardiovascular events in coronary chronic total occlusion undergoing percutaneous coronary intervention. Front Cardiovasc Med. 2021;8:731261. doi:10.3389/fcvm.2021.731261
39. American Dietetic Association. Classification and diagnosis of diabetes. Diabetes Care. 2021;44(Suppl1):S15–S33. doi:10.2337/dc21-S002
40. Ca J, Bm M, Pinnelli VB, et al. The association of pulmonary tuberculosis, abnormal glucose tolerance, and type 2 diabetes mellitus: a hospital-based cross-sectional study. Cureus. 2021;13(11):e19758. doi:10.7759/cureus.19758
41. Prada-Medina CA, Fukutani KF, Pavan Kumar N, et al. Systems immunology of diabetes-tuberculosis comorbidity reveals signatures of disease complications. Sci Rep. 2017;7(1):1999. doi:10.1038/s41598-017-01767-4
42. Kumar NP, Sridhar R, Banurekha VV, et al. Type 2 diabetes mellitus coincident with pulmonary tuberculosis is associated with heightened systemic type 1, type 17, and other proinflammatory cytokines. Ann Am Thorac Soc. 2013;10(5):441–449. doi:10.1513/AnnalsATS.201305-112OC
43. Onalan E. The relationship between monocyte to high-density lipoprotein cholesterol ratio and diabetic nephropathy. Pak J Med Sci. 2019;35(4):1081–1086. doi:10.12669/pjms.35.4.534
44. Vural G, Gümüsyayla Ş. Monocyte-to-high density lipoprotein ratio is associated with a decreased compound muscle action potential amplitude in patients with diabetic axonal polyneuropathy. Medicine. 2018;97(42):e12857. doi:10.1097/MD.0000000000012857
45. Hwang -J-J, Hur JY, Eo W, An S, Kim DH, Lee S. Clinical significance of C-reactive protein to lymphocyte count ratio as a prognostic factor for survival in non-small cell lung cancer patients undergoing curative surgical resection. J Cancer. 2021;12(15):4497–4504. doi:10.7150/jca.58094
46. Chiesa ST, Charakida M. High-density lipoprotein function and dysfunction in health and disease. Cardiovasc Drugs Ther. 2019;33(2):207–219. doi:10.1007/s10557-018-06846-w
47. Kautzky-Willer A, Harreiter J, Pacini G. Sex and gender differences in risk, pathophysiology and complications of type 2 diabetes mellitus. Endocr Rev. 2016;37(3):278–316. doi:10.1210/er.2015-1137
48. Wild S, Roglic G, Green A, Sicree R, King H. Global prevalence of diabetes: estimates for the year 2000 and projections for 2030. Diabetes Care. 2004;27(5):1047–1053. doi:10.2337/diacare.27.5.1047
49. Al-Sofiani ME, Ganji SS, Kalyani RR. Body composition changes in diabetes and aging. J Diabetes Complications. 2019;33(6):451–459. doi:10.1016/j.jdiacomp.2019.03.007
 © 2022 The Author(s). This work is published and licensed by Dove Medical Press Limited. The
full terms of this license are available at https://www.dovepress.com/terms
and incorporate the Creative Commons Attribution
- Non Commercial (unported, 3.0) License.
By accessing the work you hereby accept the Terms. Non-commercial uses of the work are permitted
without any further permission from Dove Medical Press Limited, provided the work is properly
attributed. For permission for commercial use of this work, please see paragraphs 4.2 and 5 of our Terms.
© 2022 The Author(s). This work is published and licensed by Dove Medical Press Limited. The
full terms of this license are available at https://www.dovepress.com/terms
and incorporate the Creative Commons Attribution
- Non Commercial (unported, 3.0) License.
By accessing the work you hereby accept the Terms. Non-commercial uses of the work are permitted
without any further permission from Dove Medical Press Limited, provided the work is properly
attributed. For permission for commercial use of this work, please see paragraphs 4.2 and 5 of our Terms.