Back to Journals » Psychology Research and Behavior Management » Volume 14
The Moderating Effects of Emotions on the Relationship Between Self-Reported Individual Traits and Actual Risky Driving Behaviors
Received 12 January 2021
Accepted for publication 22 March 2021
Published 9 April 2021 Volume 2021:14 Pages 423—447
DOI https://doi.org/10.2147/PRBM.S301156
Checked for plagiarism Yes
Review by Single anonymous peer review
Peer reviewer comments 2
Editor who approved publication: Dr Igor Elman
Yaqi Liu,1 Xiaoyuan Wang,2,3 Yongqing Guo1
1School of Transportation and Vehicle Engineering, Shandong University of Technology, Zibo, Shandong Province, People’s Republic of China; 2College of Electromechanical Engineering, Qingdao University of Science & Technology, Qingdao, Shandong Province, People’s Republic of China; 3Joint Laboratory for Internet of Vehicles, Ministry of Education-China Mobile Communications Corporation, Tsinghua University, Beijing, People’s Republic of China
Correspondence: Xiaoyuan Wang
College of Electromechanical Engineering, Qingdao University of Science & Technology, No. 99 Songling Road, Qingdao, 266000, Shandong Province, People’s Republic of China
Tel +86 138 6445 5865
Fax +86 532 8895 6166
Email [email protected]
Purpose: Researches addressing driving behaviors have not fully revealed how emotions affect risky driving behaviors and tend to focus on the effects of some negative emotions rather than those of more specific emotions. This study aimed to test the potential moderating effects of eight common driving emotions on the relationship between self-reported individual traits (sensation seeking and driving style) and actual risky driving behaviors, sequentially providing some implications for the risky driving behavior prevention.
Participants and Methods: A total of 78 licensed drivers were recruited from undergraduate students, company employees and taxi drivers in China. The participants’ data on self-reported driving style (SDBS) and self-reported sensation seeking (SSSS) were obtained through questionnaires. The participants’ data on actual risky driving behaviors (ARD) in eight driving emotional activation states were obtained through a series of emotion induction experiments and driving experiments. The Structural Equation Modeling (SEM) and moderating effect tests were employed to investigate the relationships of driving emotions, SDBS, SSSS and ARD.
Results: Results showed that anger and pleasure affected risky driving behaviors positively by enhancing the relationship between SDBS and ARD, while surprise and fear were negatively related to risky driving behaviors by weakening this relationship. Anxiety positively affected risky driving behaviors by synchronously enhancing the relationship between SDBS and ARD and the relationship between SSSS and ARD, while helplessness and relief affected risky driving behaviors negatively by weakening the two relationships. Contempt affected risky driving behaviors positively by enhancing the relation between SSSS and ARD.
Conclusion: The results illustrated the effects of different emotions on risky driving behaviors, and also partly explained the reasons for these effects. This research provided a source of reference for reducing traffic accidents caused by risky driving behaviors.
Keywords: driving emotion, sensation seeking, driving style, risky driving behavior, moderating effect, SEM
Introduction
Among the many factors that are capable of explaining root causes of traffic accidents, risky driving behaviors is the leading cause of preventable road-traffic incidents.1 Risky driving behaviors refer to those driving behaviors that significantly increase the incidence of accidents and crashes.2 Driving violations and mistakes are the two most common risky driving behaviors.3 Driving violations are associated with the misapplication of normally good rules, the application of bad rules, a failure to apply a good rule, or erroneous performance in a no-rules situation.4 Driving violations can operationalized into ordinary violations and aggressive violation. Ordinary violations basically indicate driving behaviors that violate rules or order, such as crossing red lights, exceeding the speed limit and change lanes frequently.5 Aggressive violations mainly indicate aggressive driving behaviors against other road users, such as dangerous overtaking, prevent other vehicles from overtaking, honking to display anger or aggressive stance.6,7 Driving mistakes means the driver’s improper driving behaviors due to misjudgment, improper operation or other reasons. For example, the driver’s inattention caused him or her to have a rear-end collision with the vehicle in front.8 Risky driving behavior may be the driver’s subjective psychological will or the driver’s unintentional fault. Over the past decades, a growing interest has been seen in exploring the influencing factors of risky driving behaviors.2,9–12 Many researchers attempt to find appropriate and effective interventions to reduce risky driving behaviors and improve traffic safety.13 According to the previous researches, human factors that affect risky driving behaviors mainly include individual differences, temporary loss of ability, cognitive and psychological factors. Individual differences refer to drivers’ differences in driving behavior due to factors, such as age, gender, driving experience and skills, personality traits and so on. For example, some studies have shown that male drivers are more prone to deliberate violations, aggressive driving and other high-risk behaviors, while female drivers are more likely to make some operational mistakes in driving.14 Temporary ability loss refers to the impairment of driver’s cognitive and behavioral functions caused by factors, such as drunk driving and fatigue driving. For instance, research showed that alcohol-intoxicated drivers are more risky drivers.15 Cognitive and psychological factors are related to factors, such as the driving emotion, perception, and cognition during driving. Many scholars have begun to pay attention to the risky driving behaviors caused by these dynamic and uncertain factors in actual driving activities.10
Sensation seeking and driving style are the personality traits that often mentioned in risk driving behavior research. Driving emotion is a typical cognitive and psychological factor of risky driving behaviors. Compared with individual difference and temporary ability loss, cognitive and psychological factors are characterized by uncertain occurrence time, short duration, difficulty to observe and predict.16 Although some studies have proved that there is a certain connection between driving emotions and risky driving behaviors, few studies have conducted in-depth exploration on the common influence of emotion and personality traits on risky driving behaviors. In addition, there are few studies using lateral data to compare the differences in the impacts of various specific driving emotions on risky driving behavior. The purpose of present study is to investigate the effects of different driving emotions and self-reported individual traits (driving style and sensation seeking) on the actual risky driving behaviors, in particular, what role do these factors play in the influencing framework of risky driving behaviors.
Literature Review and Theoretical Framework
Self-Reported Driving Style and Risky Driving Behavior
Driving style refers to established driving habits that include the choice of speed, the threshold for overtaking, and a tendency to commit traffic violations.17 Driving style is a stable personality trait formed by drivers in their driving practices and is a comprehensive expression of driver’s values, needs, and attitudes regarding driving. Accordingly, drivers are typically characterized as, for instance, careful, reckless, hostile, or anxious drivers. Drivers of different driving styles have obvious differences in their daily driving behaviors. Therefore, in some studies on risky driving behavior prediction, driving style is often used as an important reference basis.18 Up to now, there is no universally recognized method that can accurately describe a driver’s driving style, and the self-report scale is still the main tool for determining driving style. Among the various driving style scales, such as Driver Behavior Questionnaire,19 Driving Style Questionnaire,20 and Multi-Dimensional Driving Style Inventory,18 the Driver Behavior Questionnaire (DBQ) is the most widely used instrument for measuring driving style. The DBQ included four subscales, namely ordinary violations (OV), errors (Er), aggressive violations (AV) and lapses (La). Among them, errors denote planning failures, whereas lapses denote execution failures. For instance, a driver would make an error in deciding to brake in a situation where the appropriate action would have been to accelerate. In contrast, it would have been a lapse to accelerate if the actual intention was to brake. It is generally known that the higher a driver’s self-reported DBQ score is, the more risky behaviors he or she will engage in while driving.
Self-Reported Sensation Seeking and Risky Driving Behavior
Sensation seeking is a trait that defined as
The seeking of varied, novel, complex and intense sensations and experiences, and the willingness to take physical, social, legal and financial risks for the sake of such experiences.21
Similar to driving style, self-reported scale is also the primary research tool for sensation seeking. The most widely used instrument for measuring sensation seeking is the Sensation Seeking Scale (SSS). The SSS includes four subscales, namely thrill and adventure seeking (TAS), experience seeking (ES), disinhibition (DIS) and boredom susceptibility (BS). TAS refers to the individual’s subjective desire to participate in exciting and adventurous activities. ES represents a person’s appetence to experience novel and unusual sensations or lifestyles. DIS means participation rather than restriction of unruly behavior. BS represents a person’s disgusting attitude towards routine, repetitive and predictable things. A higher SSS score indicates a higher sensation seeking tendency. The relationship between sensation seeking and risky driving behavior has been well recognized. Self-reported sensation seeking is generally considered to have a positive effect on risky driving behavior.22
Driving Emotion and Risky Driving Behavior
The driving emotion was concerned and taken as an important research object since the phenomenon that the drivers in the malignant emotional states prefer to choose aggressive driving behavior which would more likely to lead to traffic accidents.23 Further studies showed that driving emotions are inextricably linked to many risk-related factors and show significant differences among different populations.24–26 Hence, emotional factors cannot be ignored when we are trying to reveal the nature of risky driving behaviors.27 When it comes to driving emotions, the most work in this area was oriented towards road rage or aggressive driving in which emotion and behavior were intertwined.28,29 Many studies revealed a positive correlation between driving anger and certain risky driving behaviors such as speeding, aggressive driving and running red lights.30,31 In addition, some researchers pointed out that anxiety and fear can also predict risky driving behaviors.32,33 Some researchers also argued that driving emotions can indirectly affect risky driving behaviors through driver’s emotional intelligence, risk perception, risk attitude and so on.34,35 In summary, extensive literatures suggest a strong relationship between risky driving behaviors and some kinds of driving emotion. However, there is no clear and generally accepted conclusion about this relationship up to the present. On the one hand, no emotional classification framework has yet been able to accurately describe all human emotions and the emotional driving behavior researches often only focus on several common emotions or simply divide emotions into positive emotion, negative emotion and neutral emotion. On the other, emotions affect human in many ways, including psychological state (cognition, attitude, etc.) and physiological state (endocrine, action-ability, etc.), which makes it difficult to distinguish whether emotions directly affect behavior or indirectly affect behavior through other factors. Considering more accurate risky driving behavior researches involving emotional aspects and practical applications, more systematic reviews and researches are still needed.
Current Study and Hypotheses
As mentioned above, the relationship between driving style and risky driving behavior and the relationship between sensation seeking and risky driving behavior have been well established and recognized, while the impacts of many specific emotions on risky driving behavior remain largely unknown. Considering that emotions are accidental and short-lived mental states which can change the driver’s driving behavioral habits from many aspect, we hypothesized that emotions may influence risky driving behaviors by moderating the relationships between personality traits (sensation seeking and driving style) and actual risky driving behaviors. Therefore, we proposed hypotheses 1–5 and a theoretical framework (Figure 1).
Hypothesis 1 (H1): SDBS is positively related to ARD. Hypothesis 2 (H2): SSSS is positively related to ARD. Hypothesis 3 (H3): SDBS is a potential mediating variable between SSSS and ARD. Hypothesis 4 (H4): The relationship between SDBS and ARD is moderated by emotion. Hypothesis 5 (H5): The relationship between SSSS and ARD is moderated by emotion.
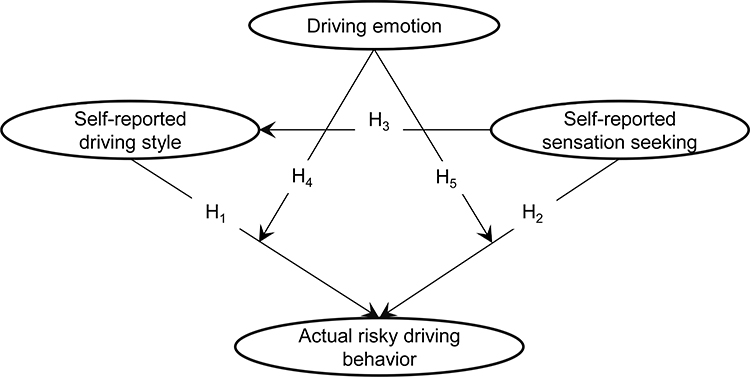 |
Figure 1 Theoretical framework. The study theoretical framework. It is a graphical representation of the proposed hypothesis H1 to H5. Self-reported sensation seeking is the independent variable, self-reported driving style is the mediating variable, driving emotion is the moderating variable, and actual risky driving behavior is the dependent variable. |
In our previous studies,36,37 we have determined the eight most common emotions in driving activities, ie, anger, surprise, fear, anxiety, helplessness, contempt, relief and pleasure. In this study, we mainly studied the effects of these eight emotions and self-reported individual traits on the actual risky driving behaviors. To verify the hypotheses, firstly, the participants’ driving style and sensory seeking characteristics were obtained through the DBQ and SSS. Secondly, the emotion induction and driving experiments were carried out to obtain the participants’ actual driving behaviors in his or her different emotional states, respectively. Thirdly, for each kind of emotion, the measurement model and structural model to represent the relationships of driving emotion, SDBS, SSSS and ARD were established based on Structural Equation Modeling (SME). Finally, we got the well-fitted SMEs and tested the theoretical framework and hypothesis.
Methods
Participants
Seventy-eight adult drivers (46 males and 32 females), with an age range from 20 to 46 years old (M=28.79, SD=6.77), participated in the experiments. All of the participants were licensed drivers and their driving experience was ranged from 1 to 15 years (M=4.51, SD=2.89).
Data Collection
Experiment Procedure
The data collection experiments consisted of three parts: (1) surveys of driving style and sensation seeking based on DBQ and SSS; (2) driving emotion induction; and (3) driving experiments. Figure 2 shows the experiment procedure. Due to the driving style and sensation seeking were seen as the stable personality traits of the participants, the experiment (1) was independent with experiments (2) and (3) in time to prevent the participants from being affected by the emotion induction when filling out the questionnaires.
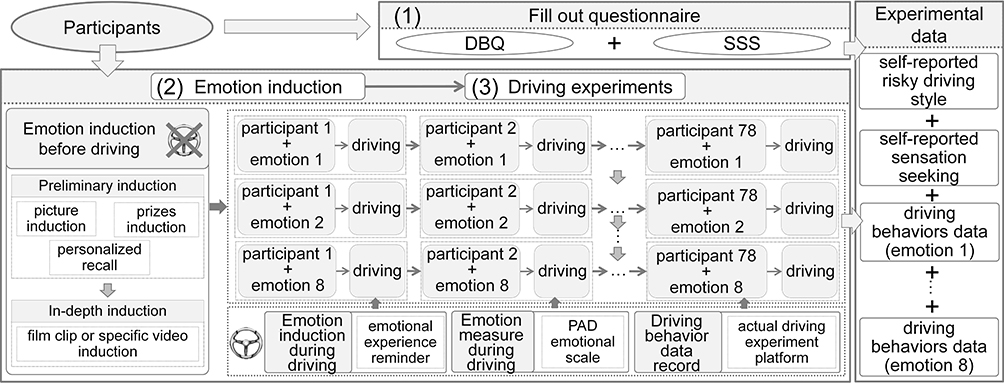 |
Figure 2 Experiment procedure. The procedure of data collection experiments. The participants’ data on self-reported driving style and self-reported sensation seeking were obtained through questionnaires. The participants’ data on actual risky driving behaviors in eight driving emotional activation states were obtained through a series of emotion induction experiments and driving experiments. |
Surveys of Individual Traits
Researchers have developed many versions of DBQ according to different application environments. The DBQ used in this study was adapted by Yang et al and more suitable for Chinese.38 In this version of DBQ, the subscales of ordinary violations, errors, aggressive violations and lapses contained 9 items, 8 items, 3 items and 8 items, respectively. Each item described a series of aberrant driving behaviors. The participants were asked to report how often they took this behavior in driving activities on a 5-point Likert scale from 1 (“never”) to 5 (“always”). Based on the questionnaire data, we conducted an internal consistency test for this DBQ. The scores of DBQ showed acceptable internal consistency (Cronbach’s alpha=0.75, 0.76, 0.71, and 0.72f or OV, AV, Er, and La, respectively; Cronbach’s alpha = 0.80 for overall DBQ). There are six versions of SSS (version I to VI). The version V used in this study was the most widely used.39 This SSS included four subscales and each subscale contained 10 items. In each item, the participants were asked to choose an option that is a closer match for them from the two options coded as 0 and 1. We also conducted an internal consistency test for this SSS, and the results showed the internal consistency were acceptable (Cronbach’s alpha = 0.67, 0.68, 0.67, and 0.71 for TAS, ES, DIS, and BS respectively; Cronbach’s alpha = 0.74 for overall SSS).
Driving Emotion Induction
Emotional induction is often the most challenging and critical part of emotion-related researches.40 For the eight typical driving emotions mentioned above, we proposed an experimental framework for driving emotion induction in our previous researches.36,37 The emotion inductions in this experimental framework contained preliminary induction, in-depth induction, driving context assumption and emotional experience reminder. The induction methods used in the preliminary induction included emotional pictures induction (for anger, surprise, fear and anxiety), personalized recall (for helplessness, contempt and relief) and prizes induction (for pleasure). The emotion induction method applied in in-depth inductions was film clip or specific video induction which was considered as an ideal emotion induction.41,42 The preliminary inductions were immediately followed by in-depth inductions. After completing the above two tasks, the participants were asked to start the driving experiment immediately. Each driving experiment was assigned a hypothetical driving situation to maintain the induction effect of driving emotion. For example, in the induction of anxiety, participants were asked to imagine the driving experiment task as being late to work. During driving, the participants’ induced emotions were recalled through voice guidance, psychological suggestion or affective music (only for relief). The purpose of the framework was to activate one kind of participant’s emotion during a period of driving activity, so as to obtain the driving behavior data of the participant in this emotional state. The specific steps and materials of the experiments were detailed in reference 37.
Driving Experiment
In the driving experiment, the experimental vehicle was equipped with speedometer and pedal force meter (Figure 3). The speedometer was used to record the driving speed (v) and acceleration (ac). The force meter was used to record the force that the participants stepped on the accelerator pedal (F) during driving. We conducted the driving experiments on a road section of Binlai expressway locating in Zibo city (Figure 4). The length of the experimental route was about 23 kilometers (between point TS1 and TS2 in Figure 4). The expressway had a speed limit of 120 km/h. Points TS1 and TS2 were two toll stations on the expressway. From the toll station, vehicles can enter or drive out of the expressway. Before each driving experiment, we parked the experimental vehicle in the outermost lane dozens of meters away from the toll station, and let a participant sit in the driving seat and watch the emotion induction materials through the laptop. After completing the preliminary induction and in-depth induction for an emotion, the participant drove the vehicle into the experimental route immediately. At this time, the speedometer and pedal force meter began to record the corresponding data. Due to the installation of the Electronic Toll Collection (ETC), the experimental vehicle did not need to stop when passing through the toll station. After the vehicle entered the expressway via the ramp, an accompanying experimental organizer began to record the participant’s behaviors of changing lane, overtaking, being overtaken, changing lane without turning light and the corresponding time. The time to complete a driving experiment was between 12 and 18 minutes. In the subsequent data processing, the experimental data of the first and last minutes of the driving experiment would be deleted. We chose to conduct the driving experiments during off-peak hours with good weather conditions. In order to minimize the impact of the difference in traffic flow in different directions on the expressway, the driving direction in each emotional state was the same. For example, all driving experiments in anger started at point TS1 and ended at point TS2. And all experiments in fear started at point TS2 and ended at point TS1.
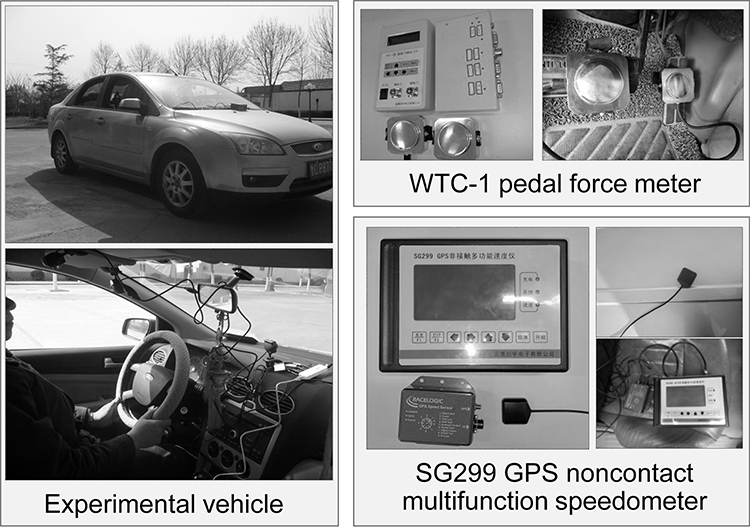 |
Figure 3 Experimental vehicle, speedometer and pedal force meter. The equipment used in the driving experiment. The experimental equipment included experimental vehicle, SG299 GPS noncontact multifunction speedometer and WTC-1pedal force meter. The speedometer was composed of GPS external antenna and host. In the experiment, the GPS antenna was placed on the ceiling outside the vehicle, and the host was placed inside the vehicle. The force pedal consisted of a force measuring instrument and a data storage device. In the experiment, the force measuring instrument needed to be fixed on the accelerator pedal. |
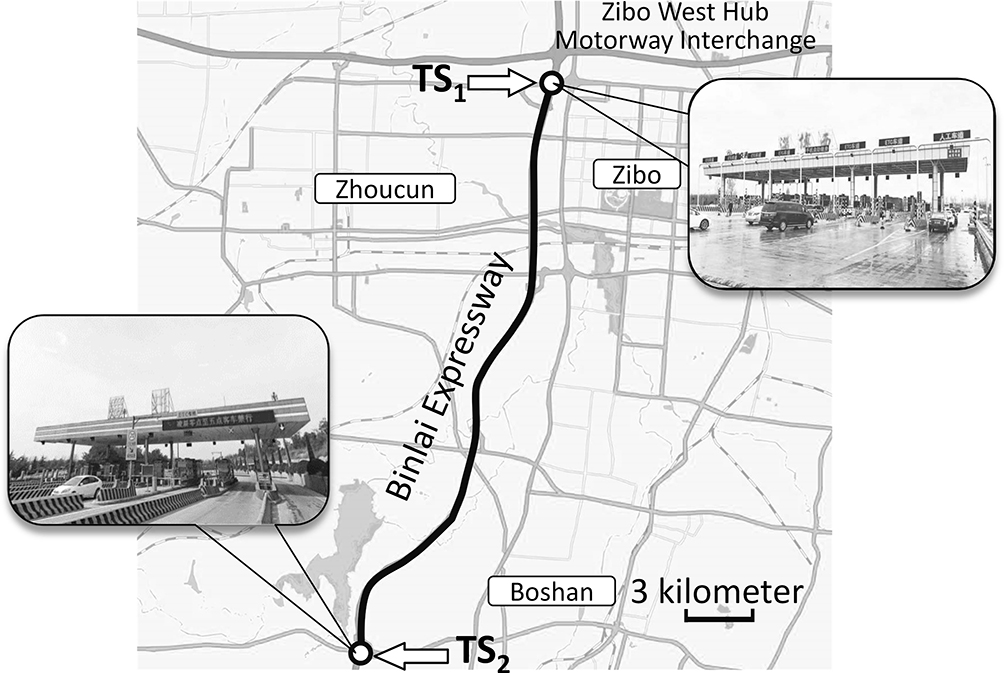 |
Figure 4 Driving experimental route. The route of driving experiment. The experimental route was a road section of Binlai expressway locating in Zibo city. The length of the experimental route was about 23 kilometers. The expressway had a speed limit of 120 km/h. Points TS1 and TS2 were two toll stations on the expressway. |
Emotion Measurement During Driving Experiment
In addition to the emotion inductions methods, the emotion experimental framework also provided a method to measure the emotional state of the driver during driving using the PAD emotion scale.43,44 According to the PAD model, emotions are composed of three dimensions: Pleasure-displeasure (P), Arousal-nonarousal (A) and Dominance-submissiveness (D). The value range of each dimension is (−1, 1), and the three-dimensional vector composed of the dimension values can be used to express specific emotions. In order to be easy to use in the experiment and to facilitate the subsequent calculation, each dimension was noted from 0 to 100 based on the strength of each dimension in this study. Before carrying out the experiment, participants were asked to keep in mind the meaning of PAD. In the driving experiment, participants were required to report PAD value (between 0 and 100) that matches their mental state every minute. An accompanying experimental organizer was responsible for recording the PAD data reported by the participants and implementing emotional experience reminder in the driving. The specific application methods of PAD emotional scale in driving experiment were detailed in reference 35.
Data Preprocessing
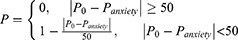
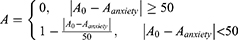
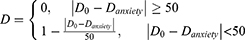
The reported PAD data cannot directly indicate the activation degree of a particular emotion. For an emotion, the difference between the reported PAD and the PAD coordinate of this emotion calibrated by the predecessor was used as the measurable standard of emotion activation.45 Taking the anxiety as an example, the PAD coordinate of anxiety was (38, 54, 42) (Figure 5). The Equations (1–3) were used to convert the reported PAD into the final PAD, respectively.
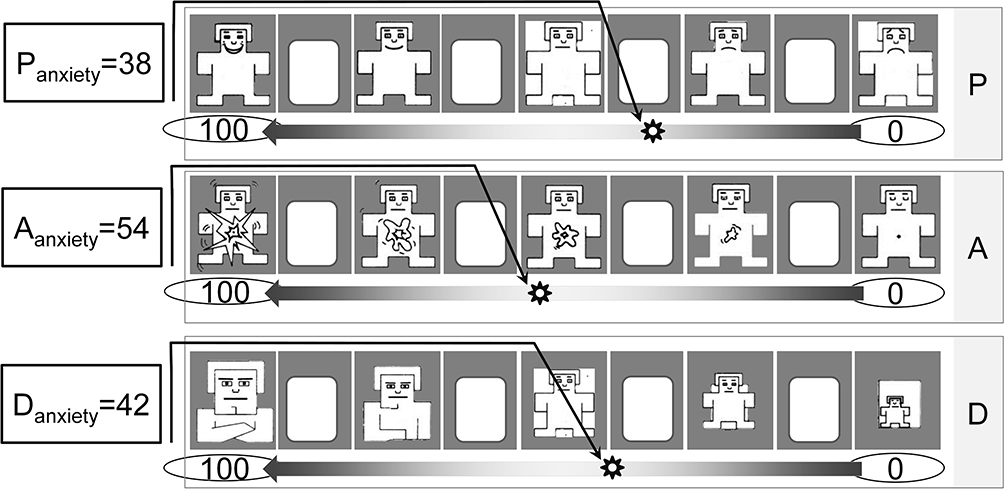 |
Figure 5 Coordinate of anxiety in PAD scale. The coordinate of anxiety in PAD scale. The PAD scale was composed of three dimensions: Pleasure-displeasure (P), Arousal-nonarousal (A) and Dominance-submissiveness (D). Each dimension was noted from 0 to 100 based on the strength of each dimension in this study. In the adapted PAD scale, the coordinate of anxiety was P=38, A=54, D=42. |
where the ,
,  and
and  were the reported PAD by a participant in driving. The value range of the final P, A and D was (0, 1). The higher the value was, the higher the emotion activation was.
We divide each driving experiment (deleting the first and last minutes) into 5 time periods equally. One participant’s driving behavior and emotional state data in each time period together with the participant’s SDBS and SSSS constituted a basic data unit. Where v, ac, F, PAD value of each data unit were the average value of each time period, while the number of lane changing (CL), overtaking (Ot), being overtaken (Bot), changing lane without turning light (NTL) were the respective sum of each time period. For each time the participants completed the driving, we obtained five data units. Each participant received eight emotion inductions and completed eight driving experiments. We ended up with 3120 data units, of which 390 data units were for each emotional state. The obtained data are shown in Tables 1 and 2.
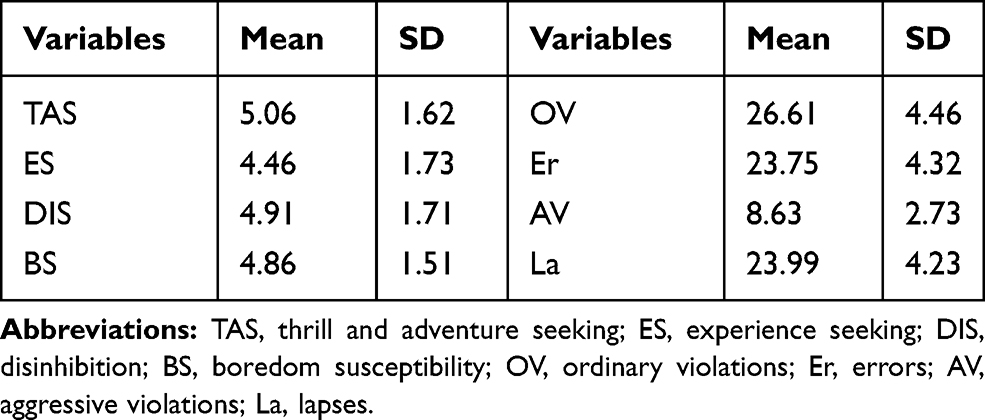 |
Table 1 Descriptive Statistics for the Data of Self-Reported Individual Traits |
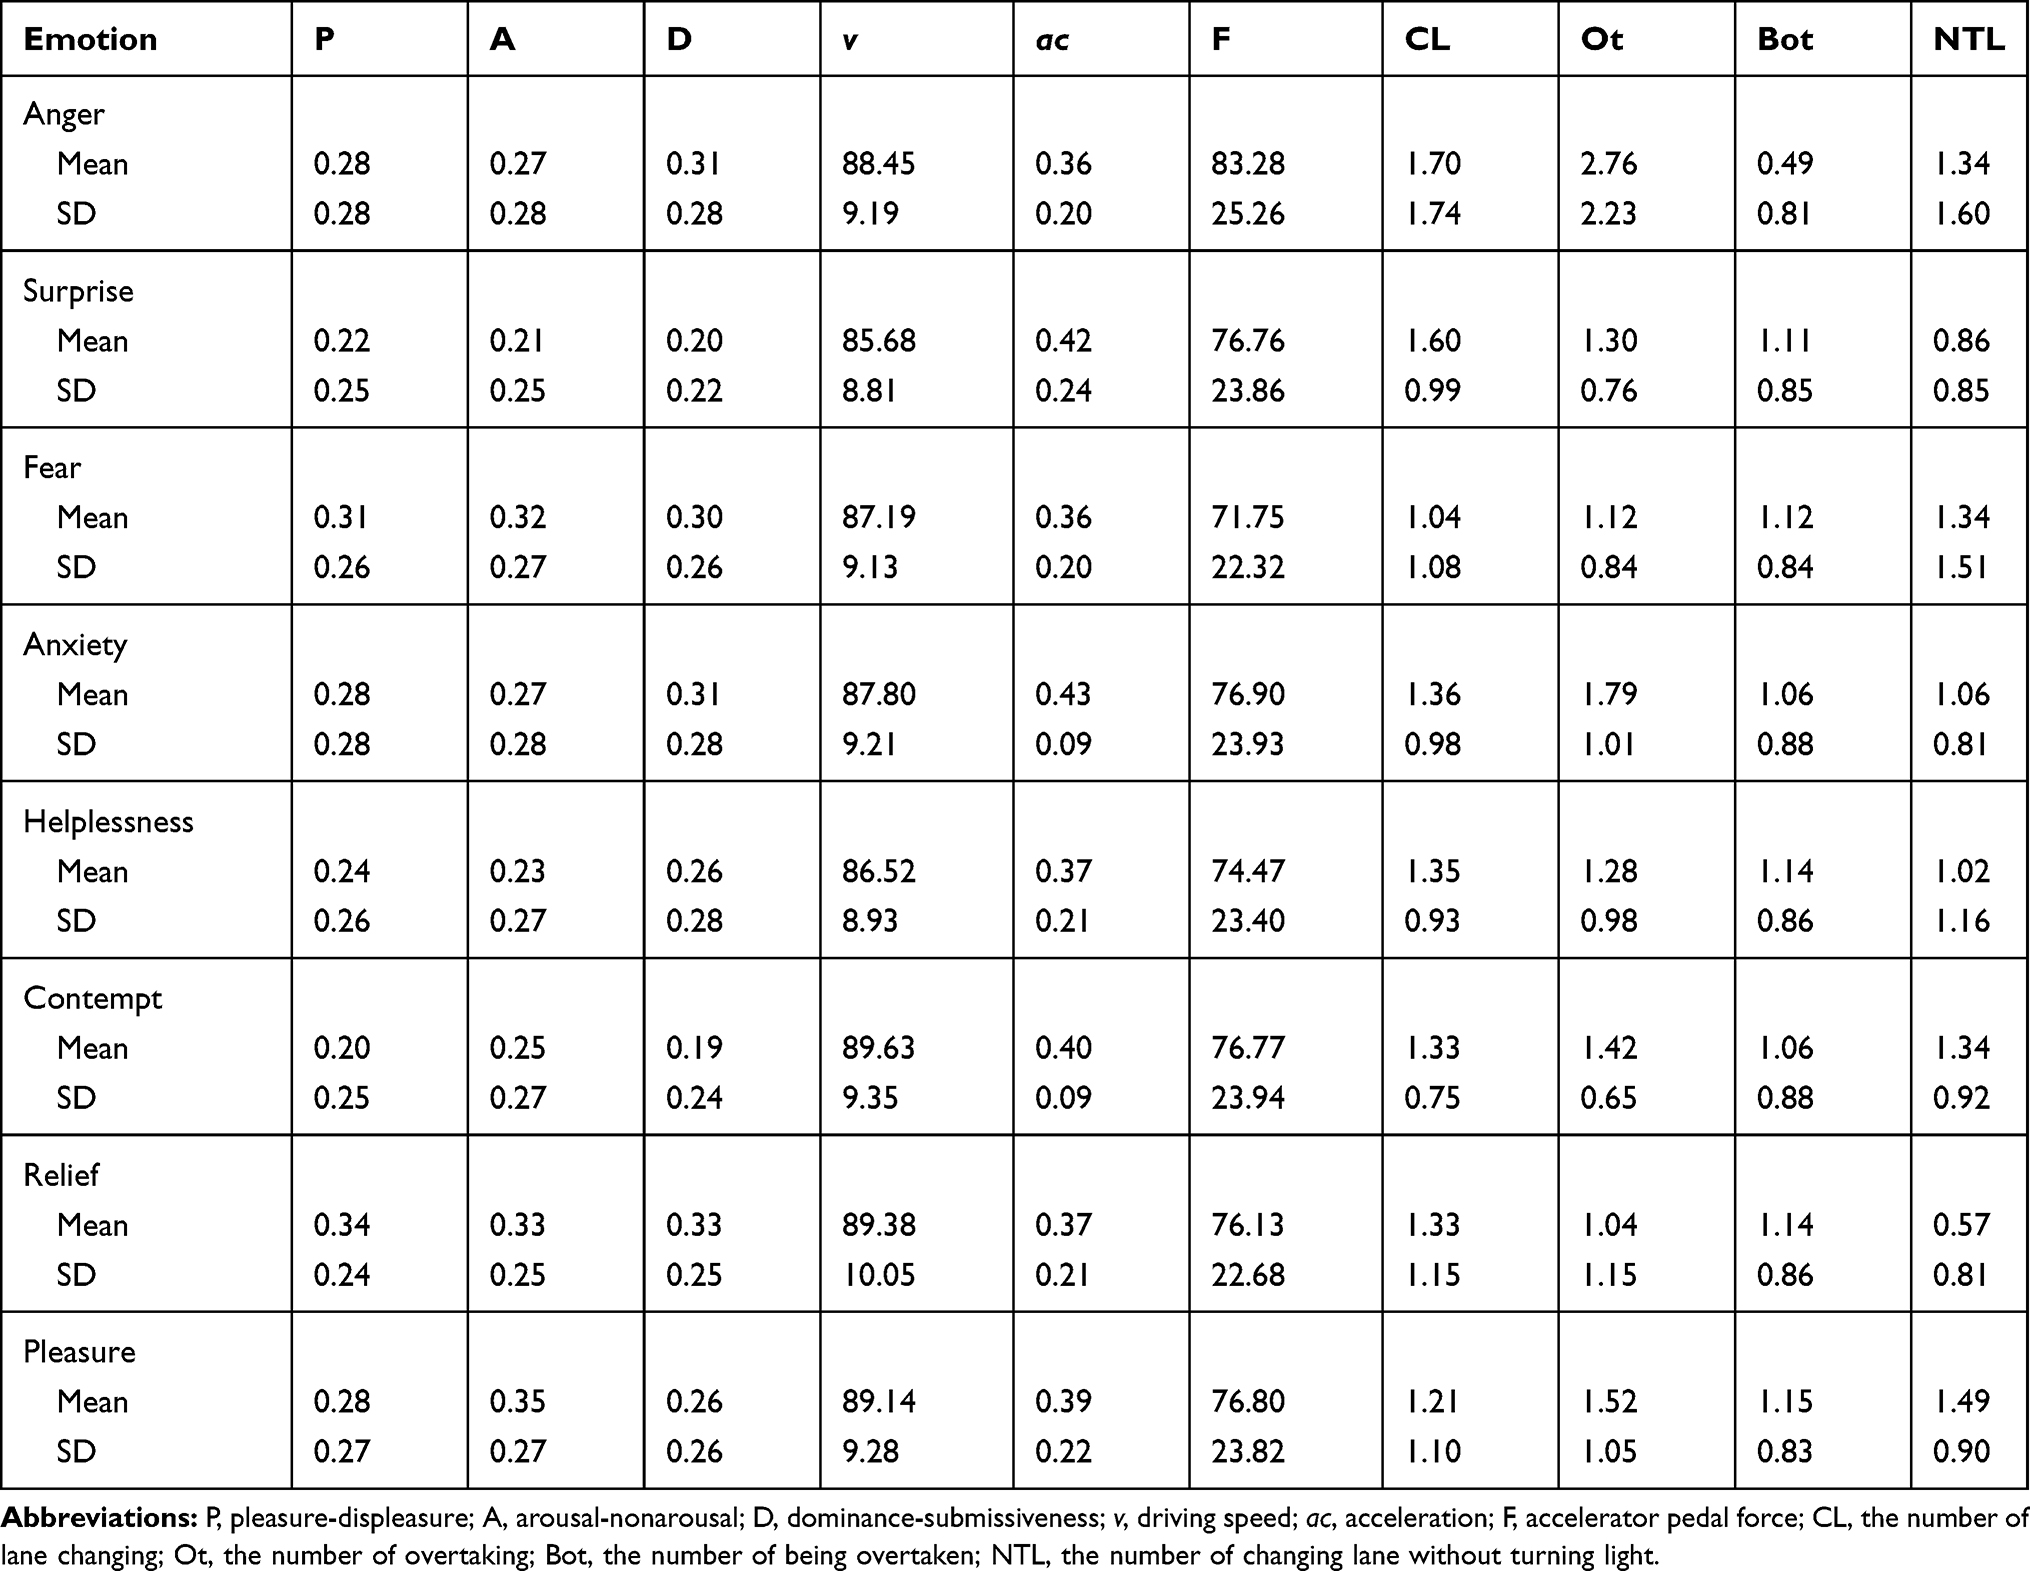 |
Table 2 Descriptive Statistics for Driving Behavior Data Under Different Emotional States |
Structural Equation Modeling
SEM Process
SEM has become increasingly popular in engineering research.46,47 SEM models consist of the structural model and measurement model.48 The structural model quantifies the strengths of relationships between Latent Variables (LVs). The theoretical formula of structural model is shown in Equation (4). The measurement model links the data of MVs to their Measurable Variables (MVs). The theoretical formula of the measurement model is shown in Equation (5).


Where  is the endogenous LVs matrix,
  is the exogenous LVs matrix,
  and
and  are the matrixes of regression coefficients that explain the relationships among LVs,
 denotes the matrix for both endogenous and exogenous LVs,
  indicates the matrix for MVs,
  is the matrix of weights that relate the MVs to their corresponding LVs, and
  and
and  are error matrixes.
Construction of SEMs
In present study, the SSSS, SDBS, emotion and ARD were seen as LVs. The measurable variables of SSSS were TAS, ES, DIS and BS. To test whether the relation between MVs and the corresponding LVs conforms to the designed theoretical relation, the Confirmatory Factor Analysis (CFA) was conducted in the AMOS software. The form of the CFA model was shown in Figure 6. After constant modification, we got the CFA models with good fitness.49 The modified CFA models adapting to different emotions were shown in Figures S1–S8 and the model running results were presented in Tables S1–S8 in the Supplementary Material.
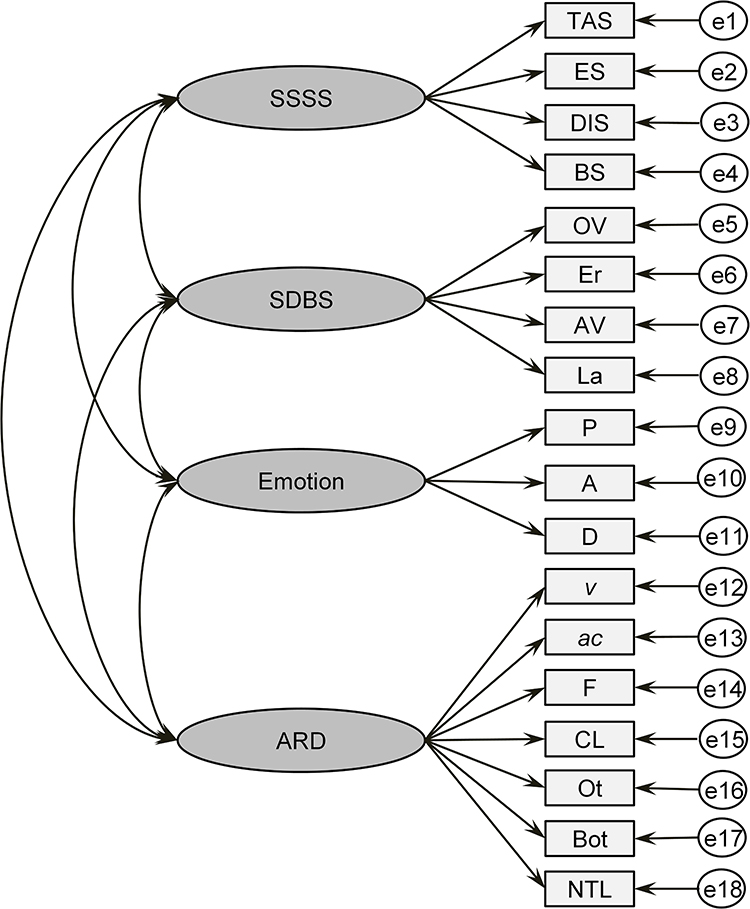 |
Figure 6 Form of CFA model. The form of Confirmatory Factor Analysis (CFA) model. In the CFA model, the emotion represented one of the eight emotions. The one-way relationships between LVs and their corresponding MVs were established and the LVs were interconnected in pairs. |
According to the proposed hypotheses and theoretical framework, the structural models represented the relationships of SSSS, SDBS, emotion and ARD were pretty much settled. The form of structural model in this study is shown in Figure 7. The Dint and Sint were latent variables and the method of the matching product was applied to generate their MVs.50 The moderating effect of emotion on the relationship between SDBS and ARD was considered to valid only when the path coefficient of H4 was significant, and the moderating effect of emotion between SSSS and ARD was considered to valid only when the path coefficient of H5 was significant. It should be noted that the data used to construct SEMs have been standardized in this study.50 Finally, we constructed SEMs that are applicable to the eight typical driving emotions.
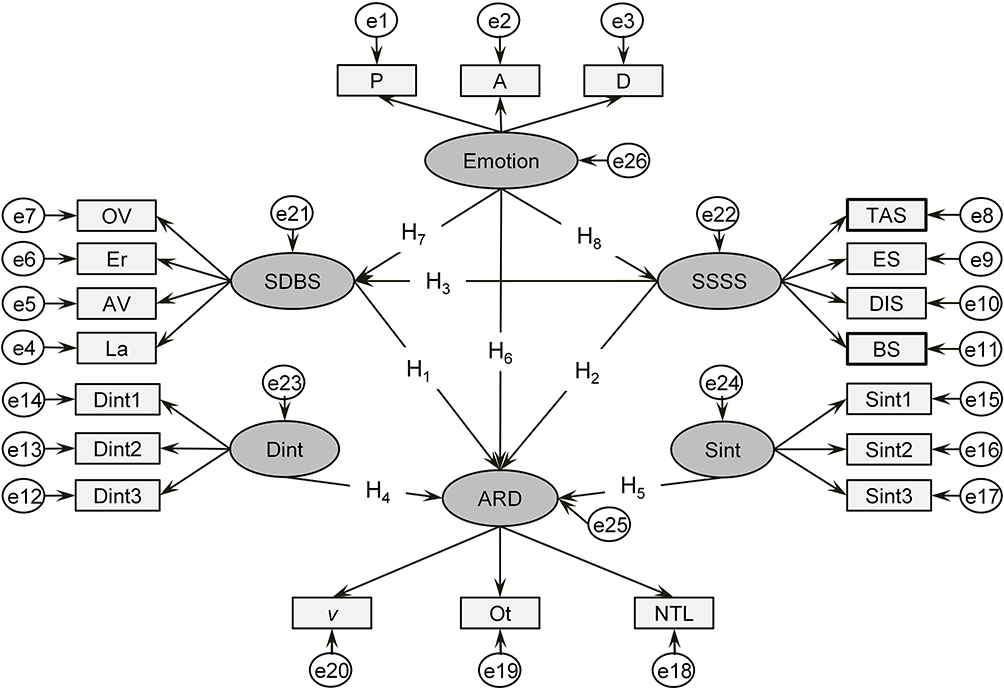 |
Figure 7 Form of structural model. The form of structural model. The structural models represented the relationships of SSSS, SDBS, emotion and ARD. Due to the present study involved the moderating effect of latent variables, the interaction variables Dint and Sint that characterized the moderating effects in the structural equation were needed. The Dint and Sint were latent variables and the method of the matching product was applied to generate their MVs. |
Fit Degree Test of SEMs
A credible SEM constructed on the basis of relevant theories and data must satisfy some statistical assumptions. These assumptions mainly refer to reasonable sample size, continuous endogenous variables that obey the joint normal distribution, identifiable model, and complete data. It can be judged whether the model meets the above-mentioned statistical assumptions by evaluating the fit degree between the model and data. In the present study, the significance probability of Chi-square (SC), goodness of fit index (GFI), root mean square error approximation (RMSEA), adjusted goodness of fit index (AGFI), normal fit index (NFI), normal fit index adjusted with freedom (IFI), dispersed degree of central Chi-square distribution (CFI) were selected as the evaluation indexes of model fit degree.49 In the AMOS software, the values of the above indexes can be obtained by running the model. When the values of these indexes simultaneously satisfy that SC>0.05, GFI>0.9, RMSEA<0.1, AGFI>0.9, NFI>0.9, IFI>0.9, and CFI>0.9, the corresponding model was considered to meet the fitting requirements. After modifications, the fitted SEMs were obtained. The evaluation index values in each model are shown in Table 3.
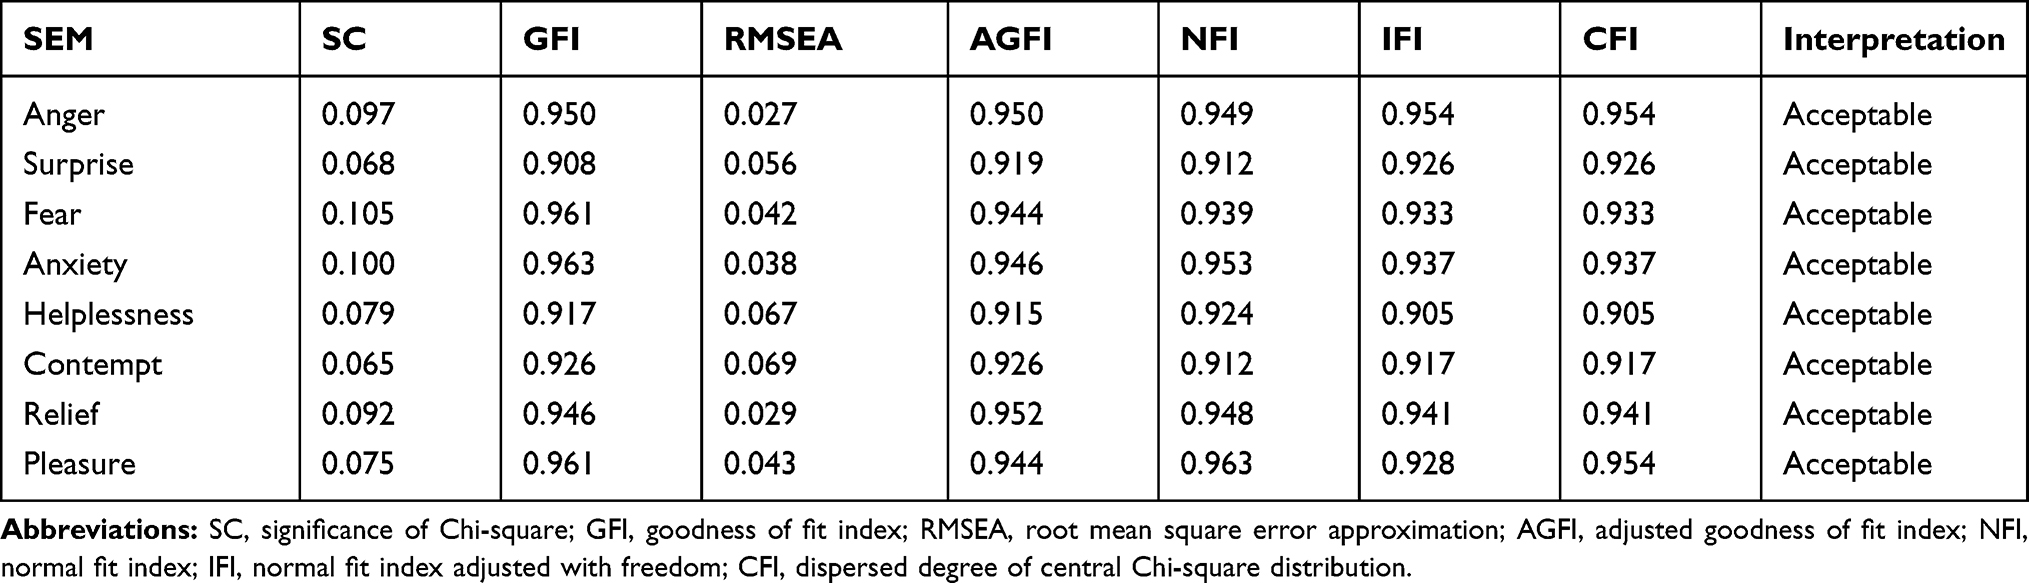 |
Table 3 The Values of Fitness Evaluation Index in Each Structural Equation Model |
Results
Moderating Effect of Anger
The fitted SEM that adapting to anger and its calculation results are shown in Figure 8 and Table 4. As can be seen from the calculation results, the path coefficient from SDBS to ARD was 0.874***. The significant path coefficient indicated that SDBS was positively related to ARD, ie, the H1 was supported. The path coefficient from SSSS to SDBS was 0.568***. The path coefficient from SSSS to SDBS and the path coefficient from SDBS to ARD were both significant and it indicated that SDBS was a mediating variable between SSSS and ARD, ie, H3 was supported. The path coefficient from SSSS to ARD was 0.056 (0.245), indicating that SSSS was not positively related to ARD, ie H2 was not supported. The path coefficient representing the moderating effect of anger on the relationship between SDBS and ARD (path coefficient from Dint to ARD in the SEM) was 0.182***. The significant and positive path coefficient not only indicated that the H4 was supported but also showed anger had a positive effect on the relationship between SDBS and ARD. The path coefficient representing the moderating effect of anger on the relationship between SSSS and ARD (path coefficient from Sint to ARD in the SEM) was −0.017 (0.861). The insignificant path coefficient indicated that anger had no moderating effect on the relationship between SSSS and ARD, ie, H5 was not supported in the SEM adapt to anger.
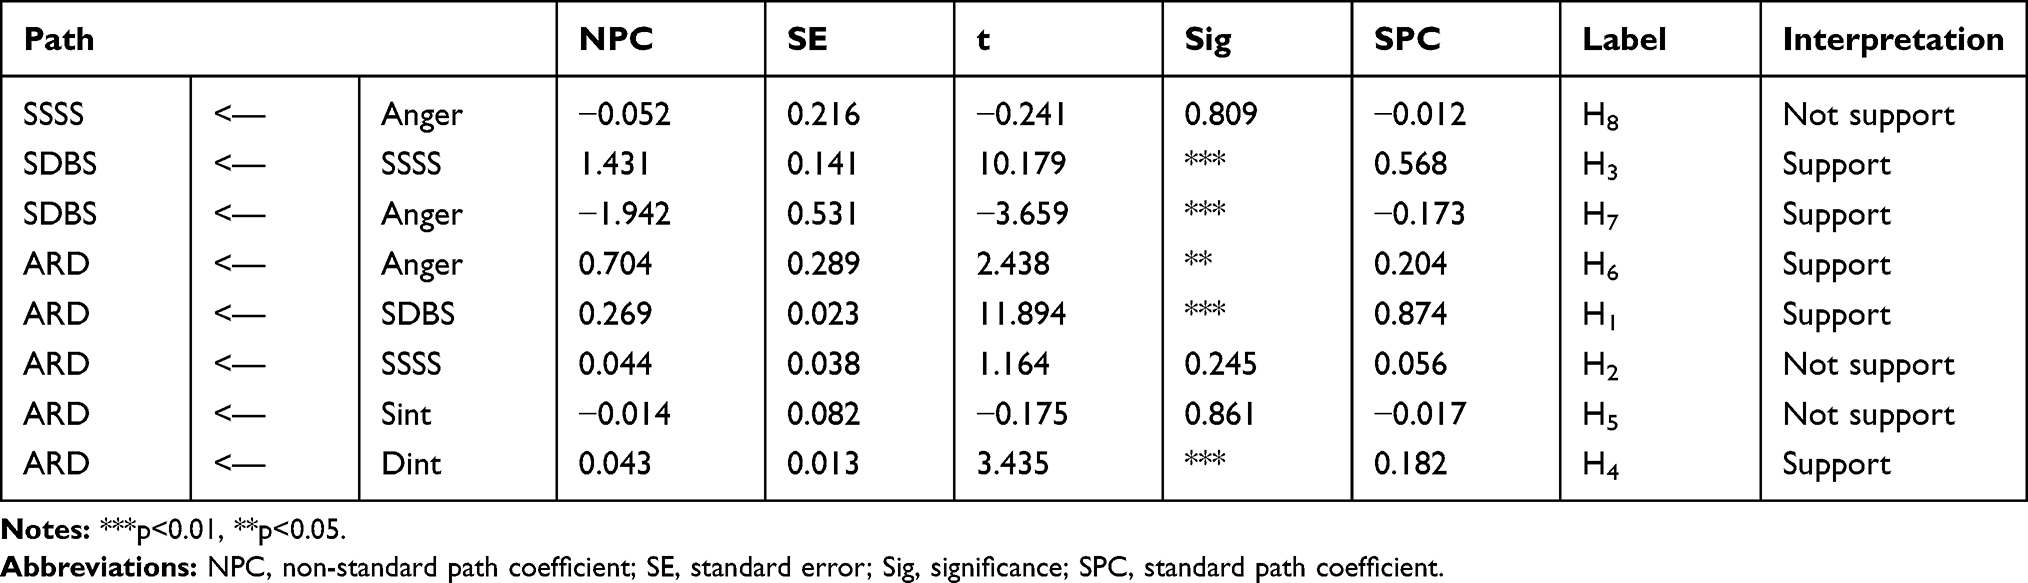 |
Table 4 Significance Test of Path Coefficients Between LVs in the SEM Applicable to Anger |
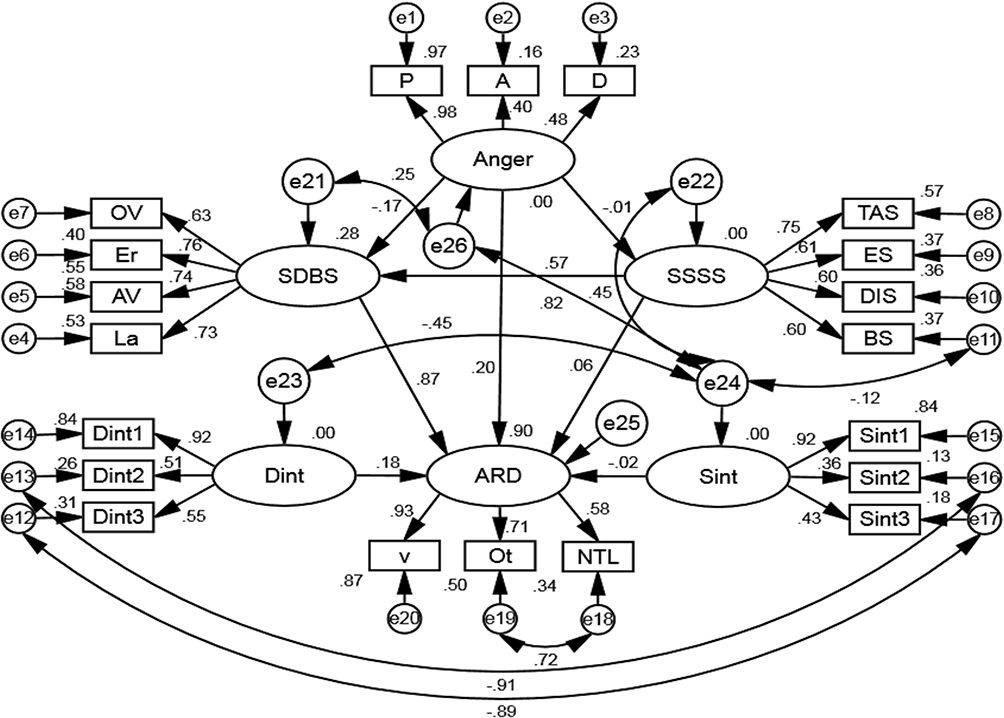 |
Figure 8 Fitted SEM applicable to anger. The fitted SEM that adapting to anger constructed in AMOS software. Compared with the original theoretical model, many two-way paths were added between different variables in the fitted model. The purpose of adding these paths was to better match the experimental data with the model. In the fitted model, the path coefficients were used to determine whether the proposed hypothesis is supported. |
Moderating Effect of Surprise
The final SEM that adapting to surprise and its calculation results are shown in Figure 9 and Table 5. The running results of the model showed that the path coefficient from SDBS to ARD was 0.827***. The significant and positive path coefficient indicated that the H1 was supported. The path coefficient from SSSS to SDBS was 0.574***. The path coefficients from SSSS to SDBS and from SDBS to ARD were both significant which indicated the H3 was supported in the SEM applicable to surprise. The path coefficient from SSSS to ARD was 0.193*** which indicated that that H2 was supported. The path coefficient representing the moderating effect of surprise on the path from SDBS to ARD was −0.137***. The significant and negative path coefficient not only indicated that the H4 was supported but also showed surprise had a negative effect on the relationship between SDBS and ARD. The path coefficient from SSSS to ARD was −0.070 (0.528), indicating that the H5 was not supported in the SEM applicable to surprise.
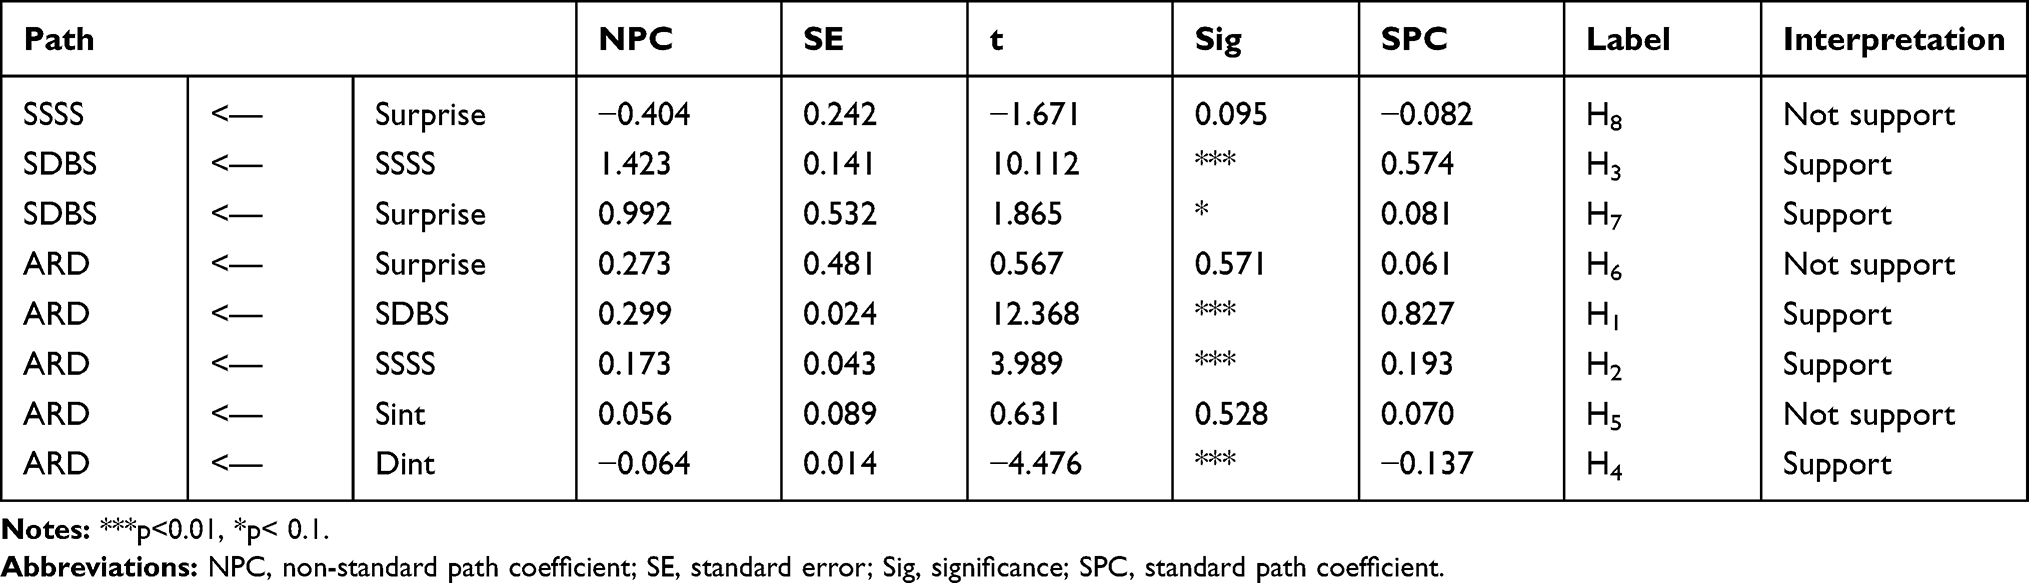 |
Table 5 Significance Test of Path Coefficients Between LVs in the SEM Applicable to Surprise |
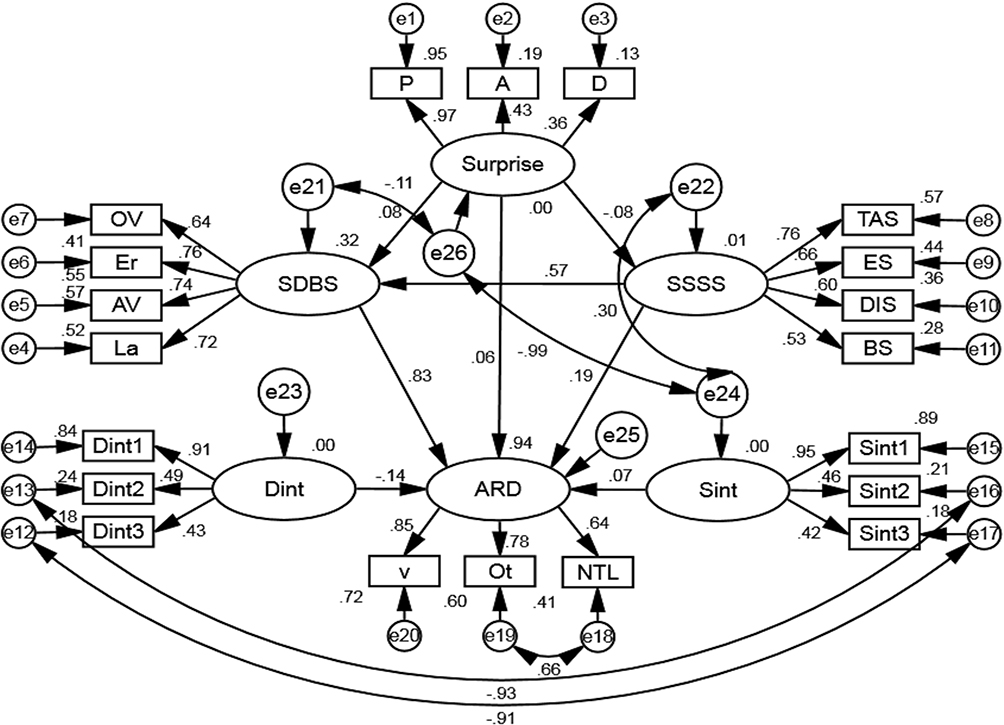 |
Figure 9 Fitted SEM applicable to surprise. The fitted SEM that adapting to surprise. Compared with the original theoretical model, many two-way paths were added between different variables. In the fitted model, the path coefficients were used to determine whether the proposed hypothesis is supported. |
Moderating Effect of Fear
The fitted SEM that adapting to fear and its calculation results are shown in Figure 10 and Table 6. The running results of the model showed that the path coefficient from SDBS to ARD was 0.920***. The significant and positive path coefficient indicated that the H1 was supported. The path coefficient from SSSS to SDBS was 0.568***. The path coefficients from SSSS to SDBS and from SDBS to ARD were both significant, indicating H3 was supported in the SEM applicable to fear. The path coefficient from SSSS to ARD was 0.001 (0.977) which indicated that H2 was not supported. The path coefficient representing the moderating effect of fear on the relationship between SDBS and ARD was −0.254***. The significant and negative path coefficient indicated that the H4 was supported, and also showed fear had a negative effect on the relationship between SDBS and ARD. The path coefficient representing the moderating effect of fear on the relationship between SSSS and ARD was −0.021 (0.792), indicating that the H5 was not supported.
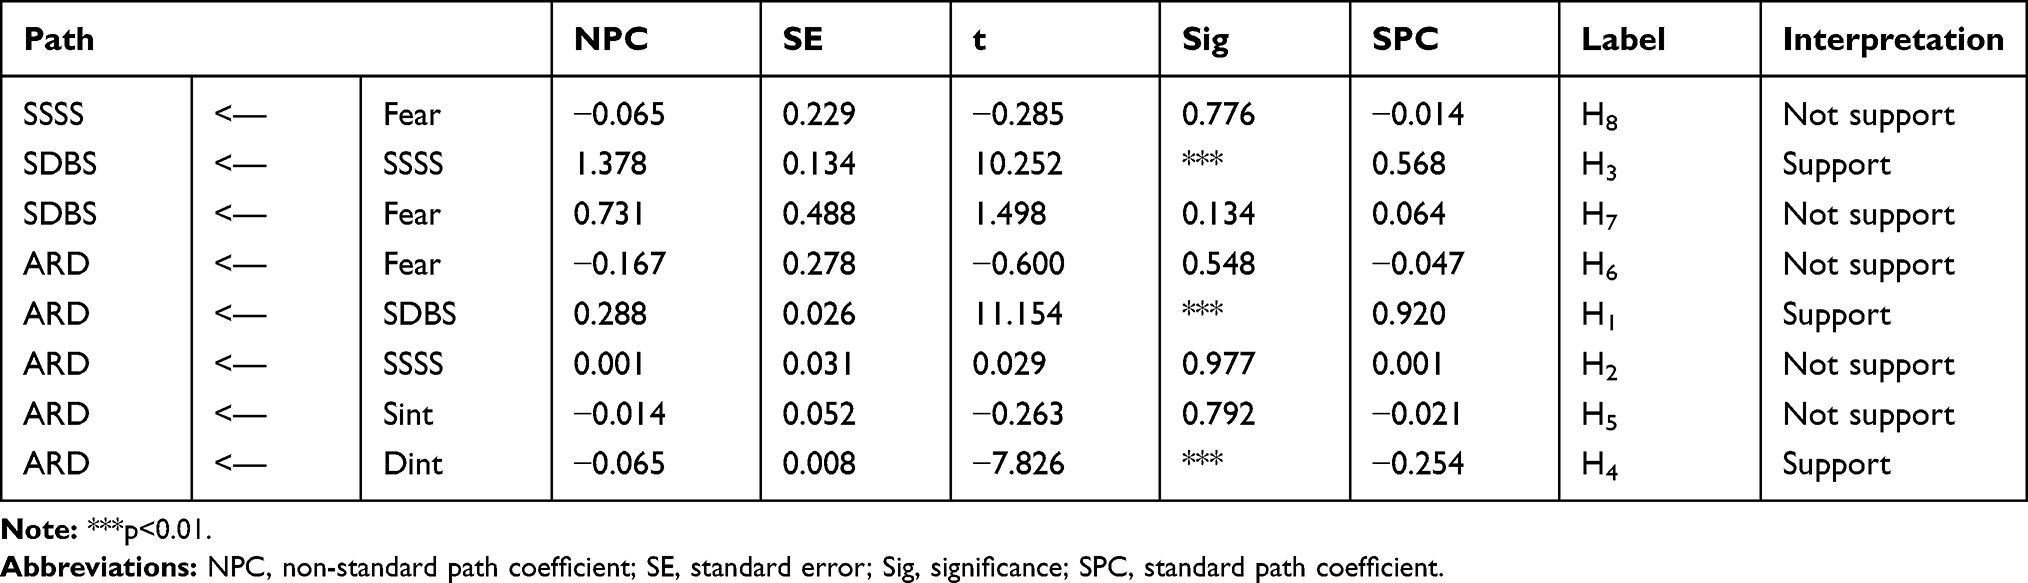 |
Table 6 Significance Test of Path Coefficients Between LVs in the SEM Applicable to Fear |
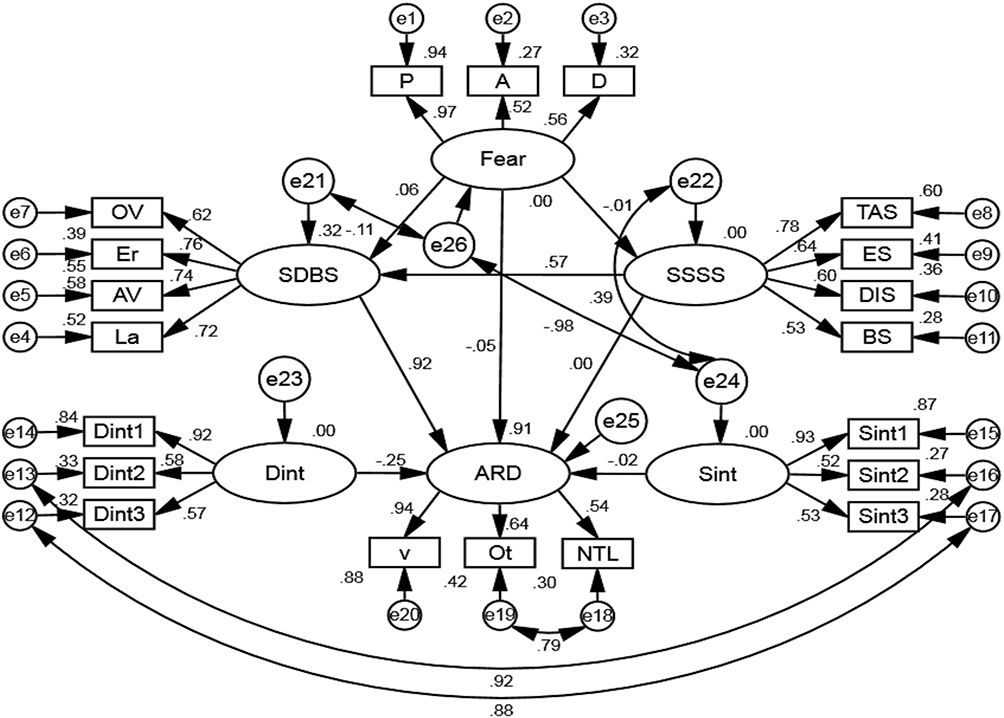 |
Figure 10 Fitted SEM applicable to fear. The fitted SEM that adapting to fear. Compared with the original theoretical model, many two-way paths were added between different variables. In the fitted model, the path coefficients were used to verify the proposed hypothesis. |
Moderating Effect of Anxiety
Figure 11 and Table 7 display the fitted SEM that adapting to anxiety and its calculation results.
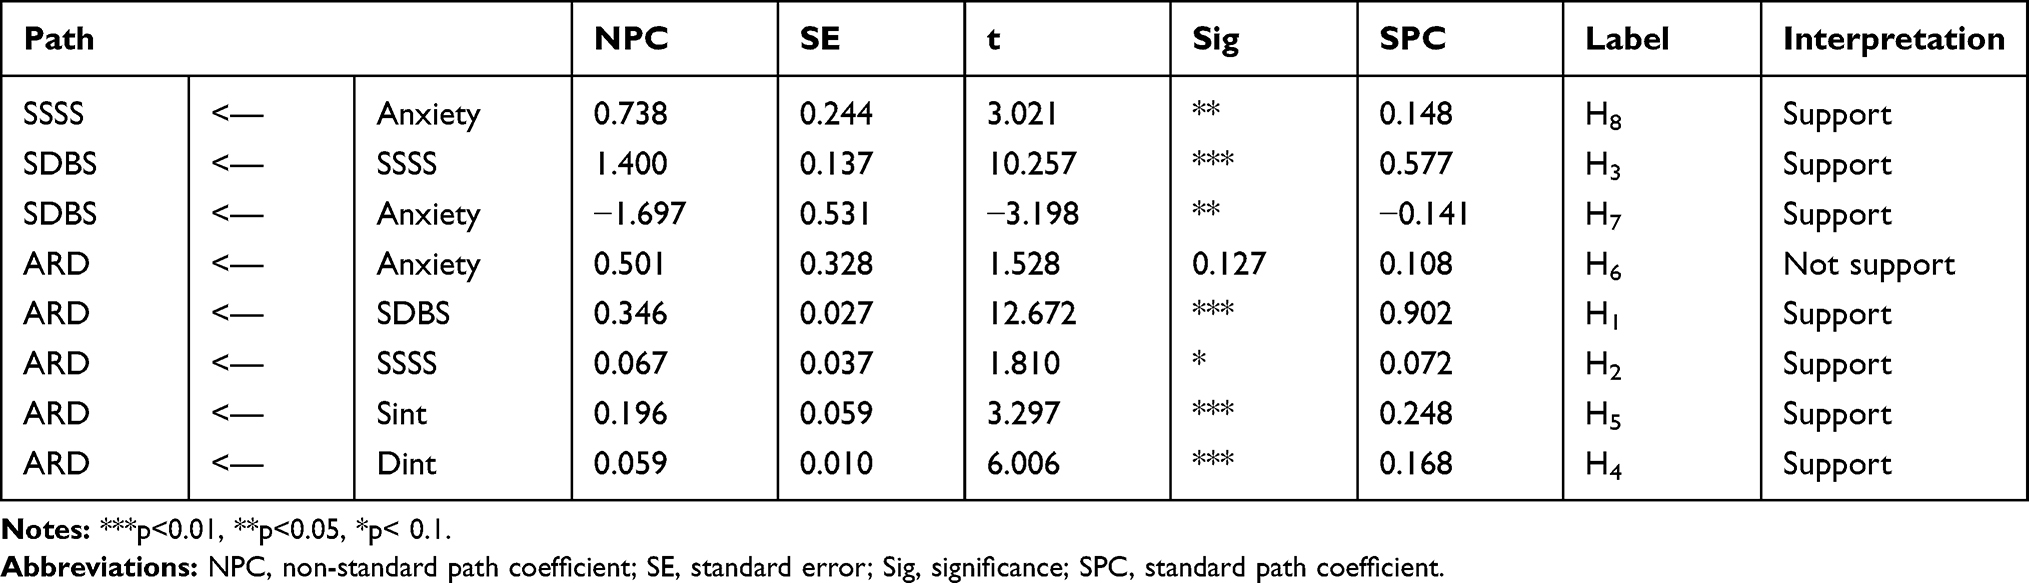 |
Table 7 Significance Test of Path Coefficients Between LVs in the SEM Applicable to Anxiety |
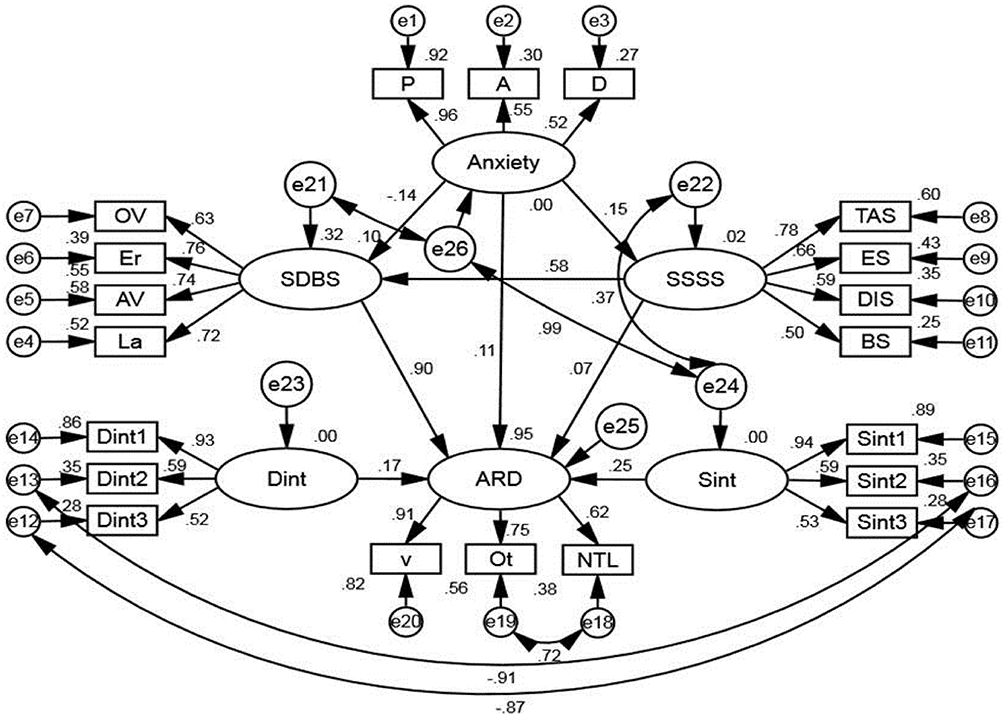 |
Figure 11 Fitted SEM applicable to anxiety. The fitted SEM that adapting to anxiety. Compared with the original theoretical model, many two-way paths were added between different variables. In the fitted model, the path coefficients were used to verify the proposed hypothesis. |
As can be seen from Figure 11 and Table 7, the path coefficient from SDBS to ARD was 0.902***indicating that the H1 was supported. The path coefficient from SSSS to SDBS was 0.577***. The both significant path coefficients from SSSS to SDBS and from SDBS to ARD indicated H3 was supported. The path coefficient from SSSS to ARD was 0.072*indicating that H2 was supported. The path coefficient representing the moderating effect of anxiety on the path from SDBS and ARD was 0.168***. The significant and positive coefficient indicated H4 was supported, and also showed anxiety had a positive effect on the relationship between SDBS and ARD. The path coefficient representing the moderating effect of anxiety on the relationship between SSSS and ARD was 0.248***. The significant and positive path coefficient indicated that H5 was supported, and also showed anxiety had a positive effect on the relationship between SSSS and ARD.
Moderating Effect of Helplessness
Figure 12 and Table 8 display the fitted SEM that adapting to haplessness and its calculation results. The calculation results showed the path coefficient from SDBS to ARD was 0.913***indicating H1 was supported. The path coefficient from SSSS to SDBS was 0.572***. The path coefficients from SSSS to SDBS and from SDBS to ARD were both significant, indicating that H3 was supported. The path coefficient from SSSS to ARD was 0.025 (0.552), indicating H2 was not supported. The path coefficient representing the moderating effect of helplessness on the path from SDBS to ARD was −0.245***. The significant and negative coefficient indicated H4 was supported, and also showed helplessness had a negative effect on the path from SDBS to ARD. The path coefficient representing the moderating effect of helplessness on the path from SSSS to ARD was −0.195***. The significant and negative path coefficient indicated that the H5 was supported, and also showed helplessness had a negative effect on the path from SSSS to ARD.
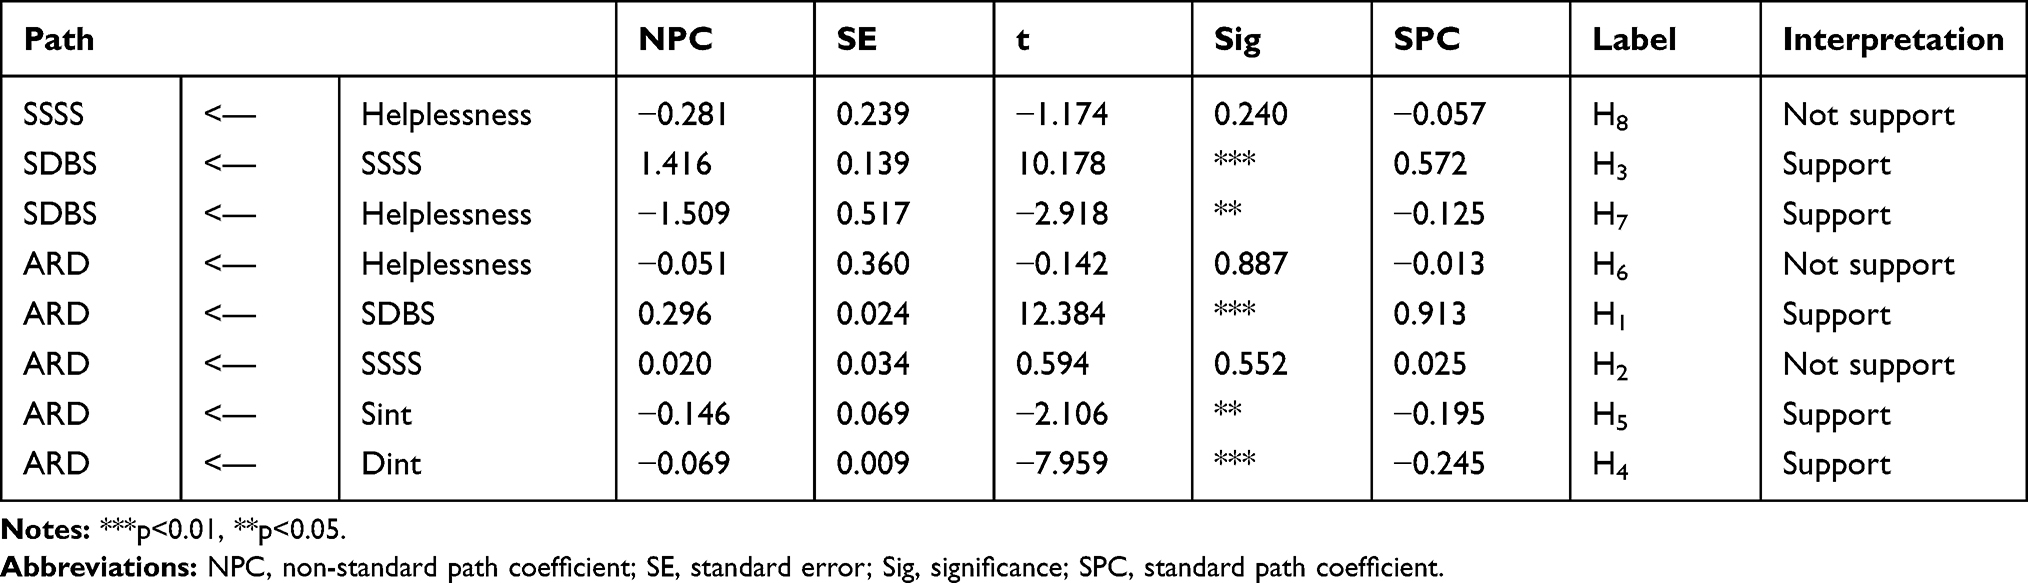 |
Table 8 Significance Test of Path Coefficients Between LVs in the SEM Applicable to Helplessness |
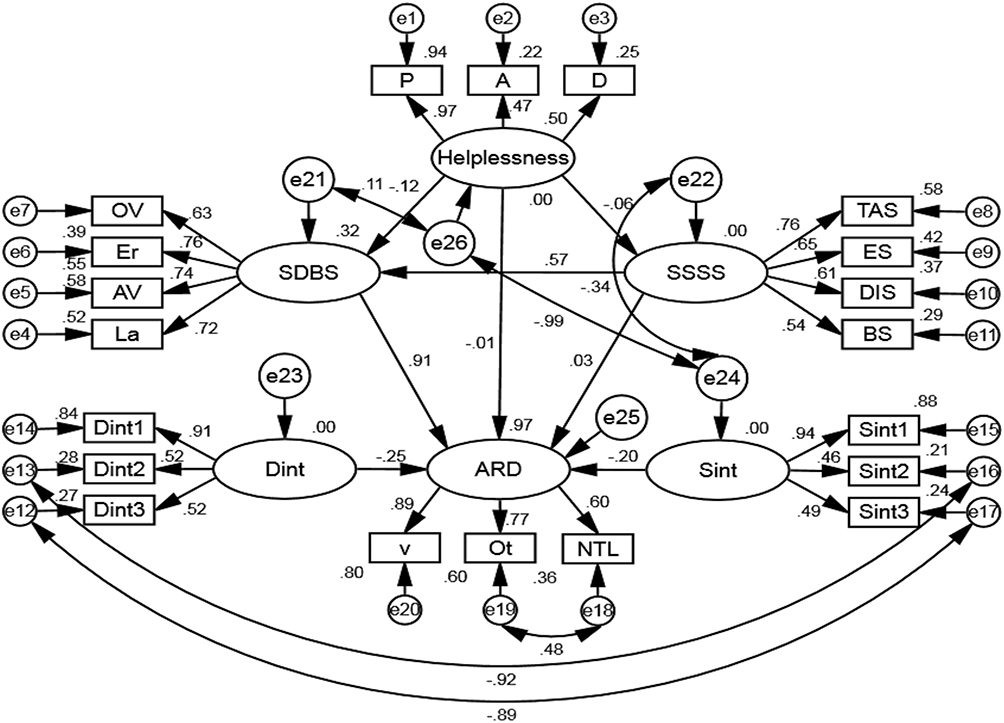 |
Figure 12 Fitted SEM applicable to helplessness. The fitted SEM that adapting to helplessness. Compared with the original theoretical model, many two-way paths were added between different variables. In the fitted model, the path coefficients were used to verify the proposed hypothesis. |
Moderating Effect of Contempt
The fitted SEM that adapting to contempt and its calculation results are shown in Figure 13 and Table 9. It can be concluded that the path coefficient from SDBS to ARD was 0.911***. The path coefficient indicated H1 was supported. The path coefficient from SSSS to SDBS was 0.587***. The both significant path coefficients from SSSS to SDBS and from SDBS to ARD indicated H3 was supported. The path coefficient from SSSS to ARD was 0.016 (0.727), indicating H2 was not supported. The path coefficient representing the moderating effect of contempt on the path from SDBS to ARD was 0.043 (0.190), indicating H4 was not supported. The path coefficient representing the moderating effect of contempt on the path from SSSS to ARD was 0.172***. The significant and positive path coefficient not only indicated that the H5 was supported but also showed contempt had a positive effect on the path from SSSS to ARD.
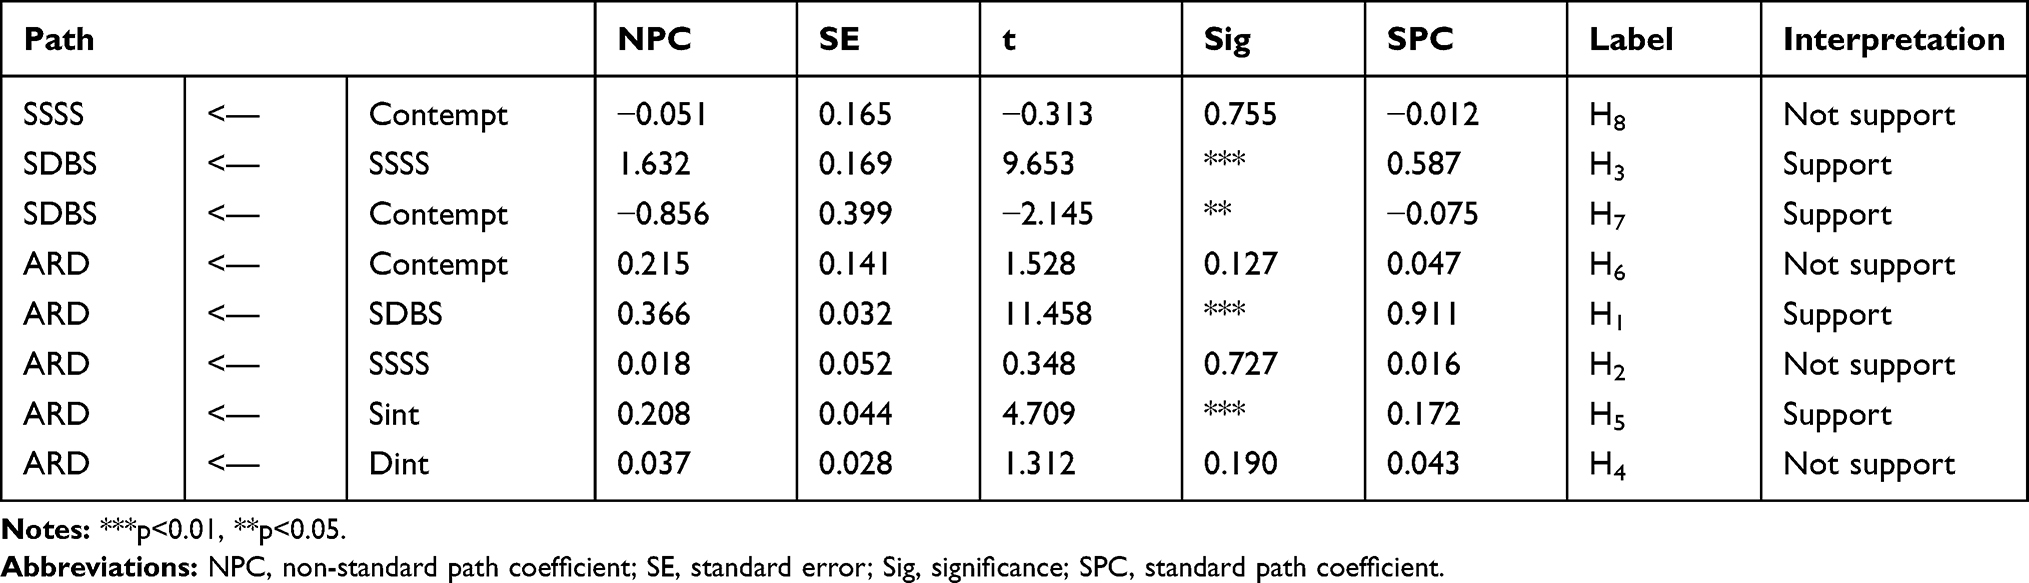 |
Table 9 Significance Test of Path Coefficients Between LVs in the SEM Applicable to Contempt |
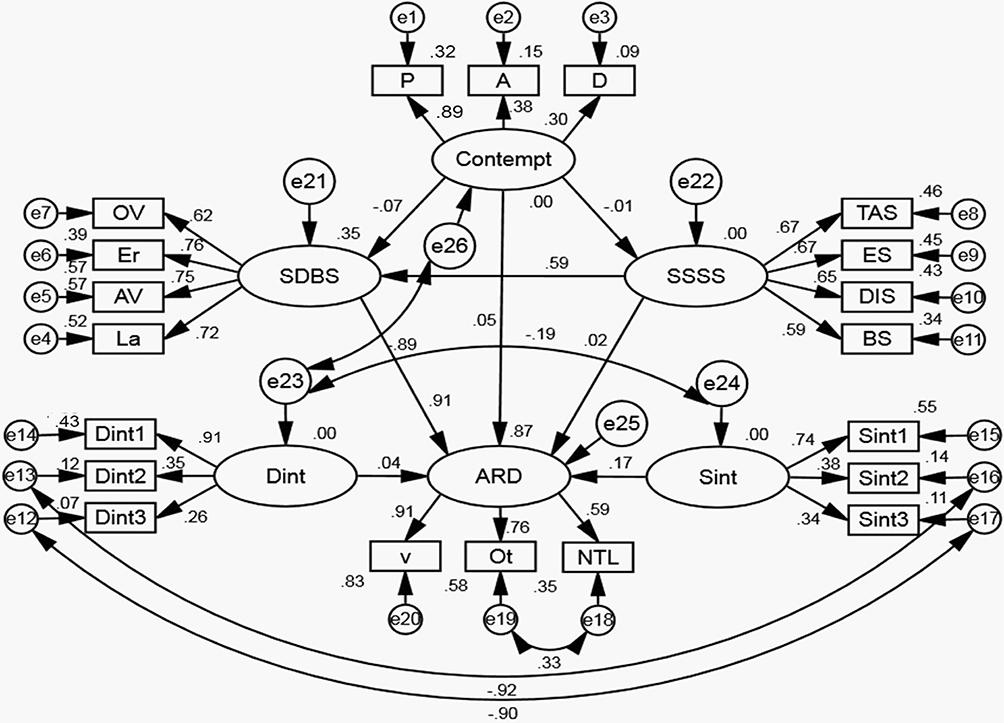 |
Figure 13 Fitted SEM applicable to contempt. The fitted SEM that adapting to contempt. Compared with the original theoretical model, many two-way paths were added between different variables. In the fitted model, the path coefficients were used to determine whether the proposed hypothesis is supported. |
Moderating Effect of Relief
The fitted SEM that adapting to relief and its calculation results are shown in Figure 14 and Table 10. The running result of the model showed that the path coefficient from SDBS to ARD was 0.735***. The significant and positive path coefficient indicated H1 was supported. The path coefficient from SSSS to SDBS was 0.520***. The path coefficients from SSSS to SDBS and from SDBS to ARD were both significant, indicating H3 was supported. The path coefficient from SSSS to ARD was 0.267***indicating that that H2 was supported. The path coefficient representing the moderating effect of relief on the relationship between SDBS and ARD was −0.442***. The significant and negative path coefficient indicated the H4 was supported, and showed relief had a negative effect on the relationship between SDBS and ARD. The path coefficient representing the moderating effect of relief on the relationship between SSSS and ARD was −0.137***meaning H5 was supported and relief had a negative effect on the path from SSSS to ARD.
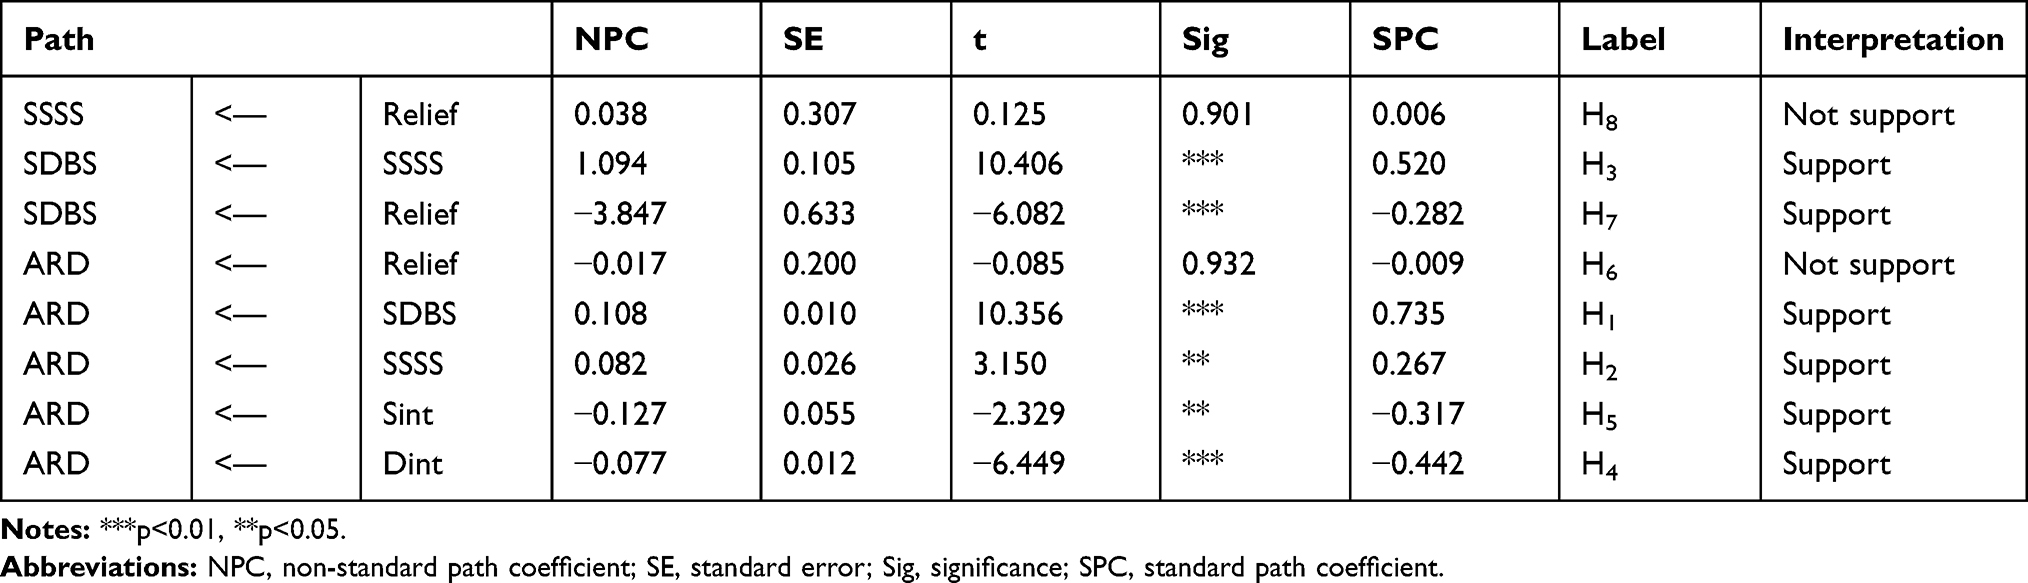 |
Table 10 Significance Test of Path Coefficients Between LVs in the SEM Applicable to Relief |
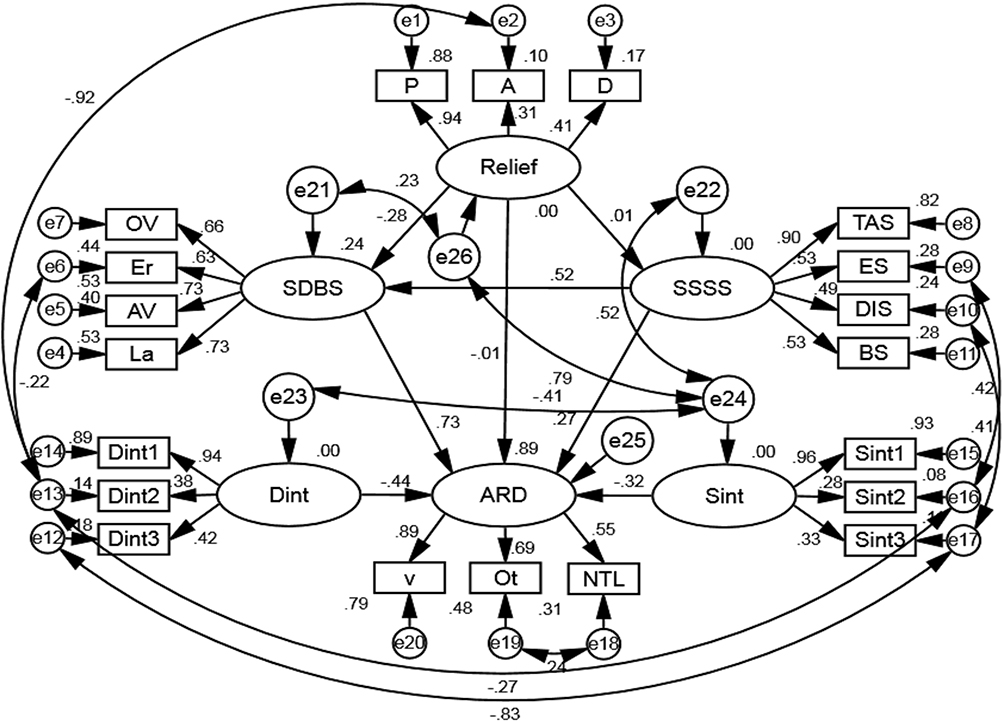 |
Figure 14 Fitted SEM applicable to relief. The fitted SEM that adapting to relief. Compared with the original theoretical model, many two-way paths were added between different variables. In the fitted model, the path coefficients were used to determine whether the proposed hypothesis is supported. |
Moderating Effect of Pleasure
Figure 15 and Table 11 display the fitted SEM that adapting to pleasure and its calculation results. As can be seen from Figure 15 and Table 11, the path coefficient from SDBS to ARD was 0.866***. The path coefficient indicated that H1 was supported. The path coefficient from SSSS to SDBS was 0.572***. The both significant path coefficients from SSSS to SDBS and from SDBS to ARD meant H3 was supported. The path coefficient from SSSS to ARD was 0.025 (0.538), indicating H2 was not supported. The path coefficient representing the moderating effect of pleasure on the path from SDBS to ARD was 0.231***. The significant and positive path coefficient not only indicated that the H4 was supported but also meant pleasure had a positive effect on the path from SDBS to ARD. The path coefficient from SSSS to ARD was 0.062 (0.418), indicating H5 was not supported.
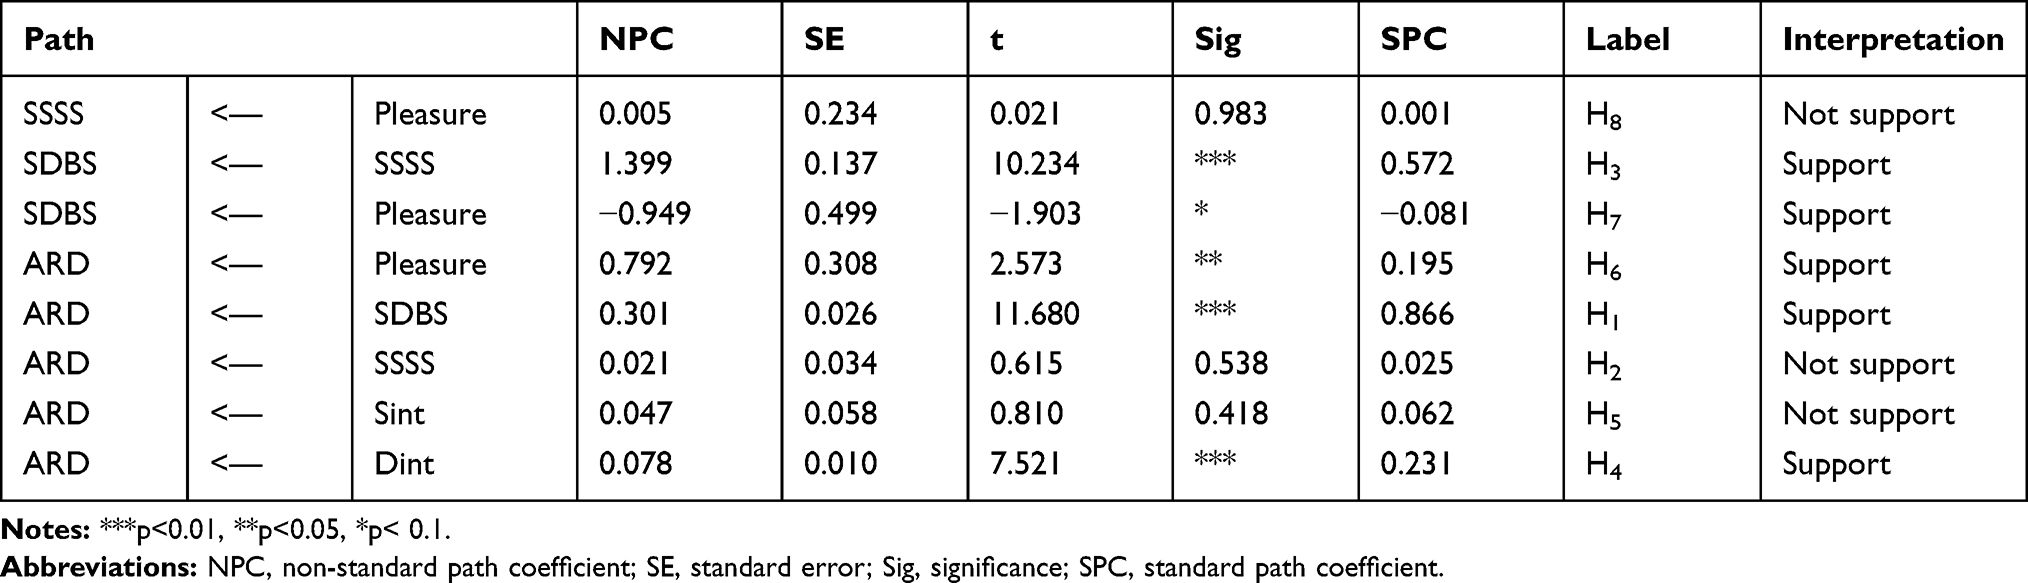 |
Table 11 Significance Test of Path Coefficients Between LVs in the SEM Applicable to Pleasure |
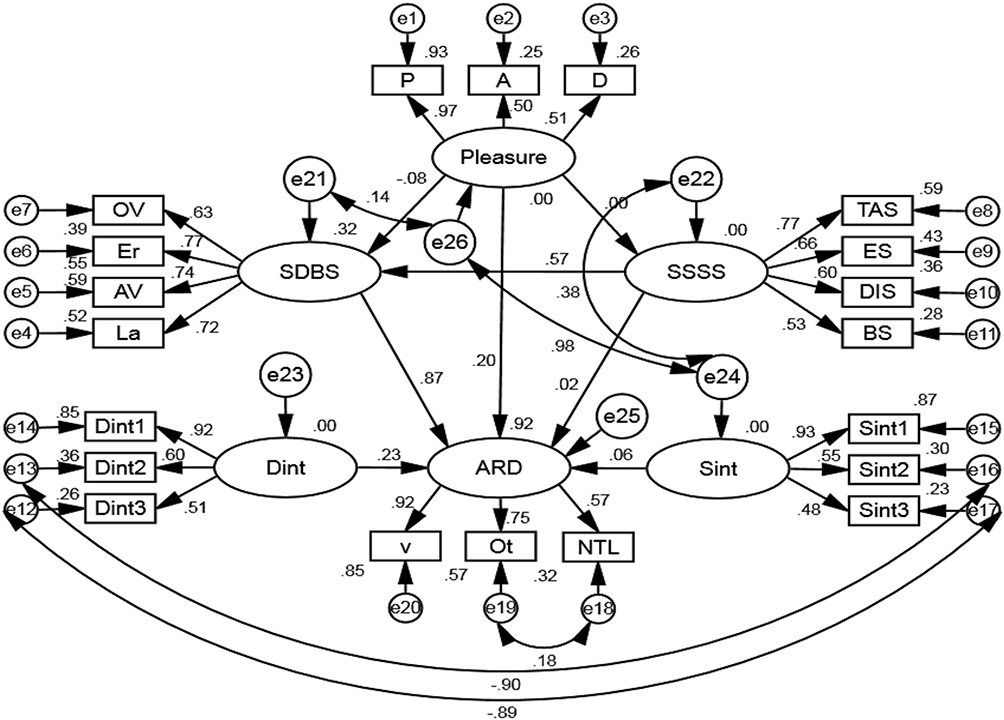 |
Figure 15 Fitted SEM applicable to pleasure. The fitted SEM that adapting to pleasure. Compared with the original theoretical model, many two-way paths were added between different variables. In the fitted model, the path coefficients were used to verify the proposed hypothesis. |
Discussion
In order to illustrate the effects of self-reported driving style and self-reported sensation seeking on actual risky driving behaviors more intuitively, the path coefficients from SSSS to SDBS, from SDBS to ARD, and from SSSS to ARD in the SMEs applicable to different driving emotions are displayed together in Figure 16. As can be seen from Figure 16, the path coefficients from SSSS to SDBS and from SDBS to ARD were all significant and positive in the SEMs applicable to the eight driving emotions, and the values of these path coefficients in different models were similar. Yet, the path coefficients from SSSS to ARD were significant only in the SEMs applicable to surprise, anxiety and relief. On the one hand, it can be concluded that the DBQ can predict a driver’s risky driving preferences accurately and steadily. One the other hand, this also showed that SSSS had a significant positive effect on ARD and this positive effect more indirectly affected ARD by affecting SDBS. For the correlation between DBQ and ARD, some similar findings have been seen in previous researches51,52 and the results of this study can prove the rationality of using DBQ data to help identify potentially high-risk drivers.53 For the relationship between SSSS and ARD, the results similar to this study also can be found in previous studies.54,55
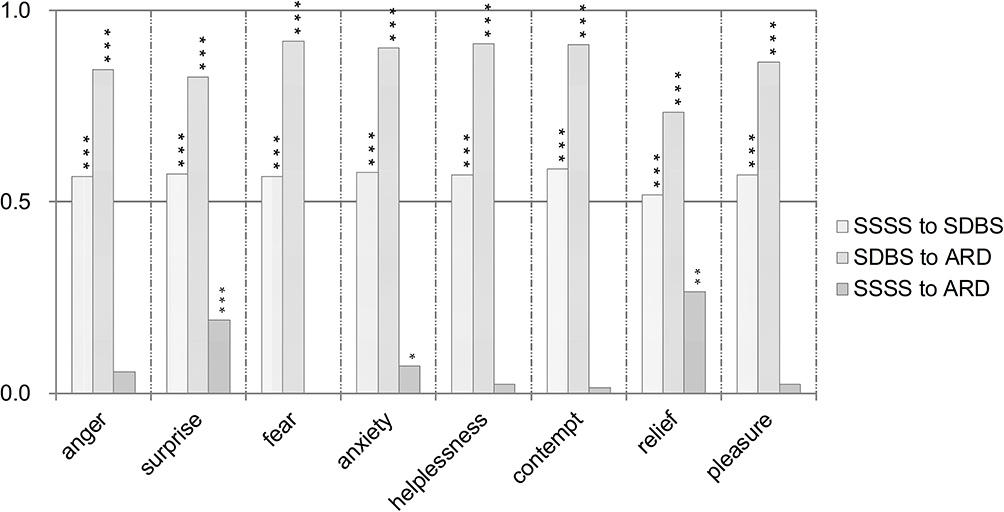 |
Figure 16 Path coefficients from SSSS to SDBS, from SDBS to ARD, and from SSSS to ARD in different SMEs. The path coefficients from SSSS to SDBS, from SDBS to ARD, and from SSSS to ARD in the SMEs applicable to different driving emotions. ***Indicated that the path coefficient was significant at the level of 0.01, **Indicated that the path coefficient was significant at the level of <0.05, *Indicated that the path coefficient was significant at the level of <0.1. |
Figure 17 shows the moderating effects of different driving emotions on the paths from SDBS to ARD and from SSSS to ARD. The positive moderating effect of anger on the relationship between SDBS and ARD was significant while the moderating effect of anger on the relationship between SSSS and ARD was not significant. The SDBS was positively related to ARD, and anger had a significant enhancing effect on this relationship. So it can be inferred that anger would promote risky driving. Similar findings have been seen in the researches of other scholars.23,56,57 In addition, many researchers pointed out that drivers who are in the state of anger tend to drive more irrationally and aggressively, which would increase the possibility of traffic accidents greatly and pose a great threat to traffic safety.58,59 The results of present study may shed light on the relationship between road rage and traffic accidents. The negative moderating effect of surprise on the relationship between SDBS and ARD was significant while the moderating effect of surprise on the relationship between SSSS and ARD was not significant. It can be concluded that surprise weakened the positive effect of SDBS on ARD, ie surprise was negatively related to ARD. Surprise has been proved to trigger a course of emotional syndromes, including several related behavioral and psychological components to promoting cognitive control over events and enabling the body to respond to sudden environmental changes adaptively.60,61 In the state of surprise, drivers tended to be accompanied by a brief state of mind-absence on driving activity.62 The less attention to driving-related factors may prompt drivers to take less risky driving behavior to ensure safety. The negative moderating effect of fear on the relationship between SDBS and ARD was significant while the moderating effect of fear on the relationship between SSSS and ARD was not significant. Therefore, fear weakened the positive effect of SDBS on ARD, ie, fear was negatively related to ARD. Fear refers to the intensely depressing emotional experience that a person feels when they try to get rid of a certain state but is powerless. Drivers in a state of fear are often overly cautious and prefer to choose the driving behaviors with low risk.63 Some scholars also proposed that fear can improve a driver’s risk perception ability which may be the reason why fear had a negative effect on risky driving.64 For the anxiety, the moderating effect between SDBS and ARD was positive and significant, and the moderating effect between SSSS and ARD was positive and significant too. Synchronously, according to Figure 16, both SDBS and SSSS had significant positive effects on ARD in the SEM applicable to anxiety. Therefore, anxiety not only enhanced the positive effect of SDBS on ARD but also enhanced the positive effect of SDBS on ARD. Anxiety was obvious positively related to ARD. Some previous studies have proposed similar results that drivers with anxious emotions often cannot maintain a stable driving state, and driving behavior had a certain degree of aggression.65,66 The moderating effect of helplessness on the relationship between SDBS and ARD was negative and significant, and the moderating effect of helplessness on the relationship between SSSS and ARD was negative and significant too. Although the path coefficient from SSSS to ARD was not significant in the SEM adapt to helplessness, the significant path coefficient from Sint (an interactive variable that represents the joint action of SSSS and helplessness on ARD) to ARD indicated the existence of a moderating effect. It can come to the conclusion that helplessness had a significant negative effect on ARD. Helplessness is similar to fear which has been proposed in previous research.67 The contempt had no significant moderating effect between SDBS and ARD. The moderating effect of contempt between SSSS and ARD was positive and significant, while the path coefficient from SSSS to ARD was not significant in the SEM. The significant positive effect of interaction variable (Sint) on ARD indicated that contempt had a promoting effect on ARD. The positive effect of contempt on the risky driving behaviors also can be found in reference.36 The moderating effect of relief on the relationship between SDBS and ARD was negative and significant, and the moderating effect between SSSS and ARD was negative and significant too. Both SDBS and SSSS had significant negative effects on ARD in the SEM applicable to relief. Therefore, relief not only weakened the positive effect of SDBS on ARD, but also weakened the positive effect of SDBS on ARD. Relief was obvious negatively related to ARD. This result was consistent with the points that drivers with positive emotions are better drivers and produce fewer accidents.68,69 The positive moderating effect of pleasure on the relationship between SDBS and ARD was significant while the moderating effect between SSSS and ARD was not significant. The SDBS was positively related to ARD, and pleasure had a significant enhancing effect on this relationship. So it can be inferred that pleasure would promote risky driving. This result seemed to be contrary to the popular belief and did not support the findings of references 66 and 67. However, this result was similar to the point that positive affect is related to higher willingness to drive recklessly.70
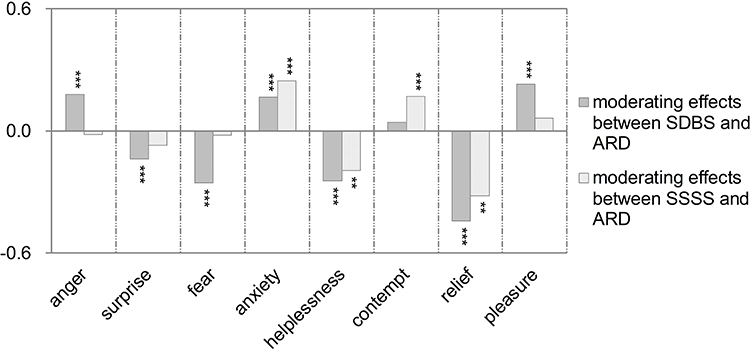 |
Figure 17 Moderating effects of different driving emotions on the influencing paths from SDBS to ARD and from SSSS to ARD. The moderating effects of different driving emotions on the paths from SDBS to ARD and from SSSS to ARD. ***Indicated that the path coefficient was significant at the level of 0.01, **Indicated that the path coefficient was significant at the level of <0.05. |
Overall, the research results validated the proposed hypothesis and demonstrated the diversity of emotional influences on risky driving behaviors. Results showed that anger and pleasure had positive effects on ARD by enhancing the positive relationship between SDBS and ARD. Surprise and fear had a negative effect on ARD by weakening the positive relationship between SDBS and ARD. Anxiety had a positive effect on ARD by simultaneously enhancing the positive relationship between SDBS and ARD and the positive relationship between SSSS and ARD. Helplessness and relief had negative effects on risk driving by simultaneously weakening the positive relationship between SDBS and ARD and the positive relationship between SSSS and ARD. Contempt had a positive effect on ARD by enhancing the positive relationship between SSSS and ARD. In the past cognition, it is generally believed that negative emotions often have an adverse effect on driving safety, and positive emotions can often prompt drivers to produce benevolent driving behaviors. However, our research results contradict this common perception to a certain extent. For example, the results showed that drivers were more inclined to choose low-risk driving behaviors in fear and helplessness, while pleasure had a positive correlation with risky driving behaviors. It should be pointed out that, according to the principle of structural equation, the results drawn in this study were based on the hypothesis that are not rejected by the SEM, rather than the only explanation of the relationship between the relevant variables. In addition, this research only focuses on the two personality traits of driving style and sensory seeking. In the following research, if more individual difference factors, cognitive and psychological factors are considered, more accurate research results may be obtained.
From a practical perspective, the present results are useful for predicting and preventing risky driving behaviors. As we all know, the Advanced Driving Assistance Systems (ADAS) are currently popular vehicle safety aids. ADAS predicts driving behavior and potential risks by monitoring the status of the driver, vehicle and driving environment (such as lane change assistance, lane departure warning, collision warning, etc.), and adopts some intervention measures to prevent the occurrence of danger (such as voice prompts, Safety warning lights, etc.). However, the premise of ADAS safety prediction is that the driver can always conduct a rational analysis of driving safety based on environmental information. In this case, ADAS may make a wrong judgment due to ignoring the driver’s mental state. For example, when a driver is in contempt, he or she is likely to have an unreasonable perception of the interaction between vehicles (such as taking other driver’s normal overtaking behavior as a provocation to themselves), and then adopt aggressive driving behavior. Obviously, if ADAS still follows the conventional model to predict the security situation and behavior, it will inevitably get results that are inconsistent with the actual situation. In addition, if ADAS continues to take intervention measures that are contrary to the driver’s wishes while incorrectly judging the driver’s mental state, it may cause the driver to produce more serious negative emotions and radical behavior. In contrast, if the ADAS can fully consider the driver’s current emotional state of contempt and then realize that the probability of the driver’s aggressive driving behavior will be greatly increased, the accuracy of risky behaviors prediction will be greatly improved. It should be pointed out that the premise of constructing an emotional driving behavior prediction model is that the vehicle-mounted intelligent system can accurately recognize the emotional state of the driver. At present, the dynamic recognition models of driver’s emotion based on data such as expression, behavior, and physiology have become a research hotspot, which provides a practical basis for the prediction of emotional driving behavior in the future.
Conclusions
In present study, we proposed a theoretical framework and a series of hypotheses to describe the relationship between driving emotions, self-reported driving style, self-reported sensation seeking and actual risky driving behavior based on existing theories and findings. In order to verify the proposed theoretical framework and hypotheses, we implemented a series of experiments to obtain 78 participants’ driving style data, sensation seeking data, and actual driving behavior data under the activated state of eight typical driving emotions. And then, the well-fitted SEMs suitable for different driving emotions were constructed severally based on the experimental data. The research results showed that the self-reported driving style and self-reported sensation seeking were both positively related to actual risky driving behaviors, and self-reported sensation seeking mainly affected actual risky driving behaviors indirectly through self-reported driving style. The more important findings of this study were the moderating effects of different driving emotions on the relationship between self-reported driving style and actual risk driving behavior, and between self-reported sensation seeking and actual risk driving behavior. The results of this study not only illustrated the influences of different driving emotions on risky driving but also explained the reasons for these influences to a certain extent. This research provided a source of reference for further understanding the role of driving emotion in risky driving and developing methods to reduce traffic accidents caused by risky driving behaviors.
Ethical Statement
The Ethics Committee at College of Electromechanical Engineering, Qingdao University of Science & Technology supports the practice of protection of human participants in this research. All participants were informed of the research process and provided written informed consent in accordance with the Declaration of Helsinki. The three items involving humans included: questionnaire survey, emotion induction and driving experiment. Before the experiments, all participants were explicitly told that they will be asked to fill out questionnaires and drive in eight emotions in real roads, and their driving data and emotional states in driving will be recorded. The participations were solicited, yet strictly voluntary.
Funding
This study was funded by the Ministry of Science and Technology of China (2018YFB1601500); the Natural Science Foundation of Shandong Province (ZR2020MF082); the Qingdao Top Talent Program of Entrepreneurship and Innovation (19-3-2-11-zhc); and the National Natural Science Foundation of China (71901134).
Disclosure
The authors report no conflicts of interest in this work.
References
1. Tao D, Zhang R, Qu X. The role of personality traits and driving experience in self-reported risky driving behaviors and accident risk among Chinese drivers. Accid Anal Prev. 2017;99:228–235. doi:10.1016/j.aap.2016.12.009
2. Qu W, Zhang W, Ge YJ. The moderating effect of delay discounting between sensation seeking and risky driving behavior. Saf Sci. 2020;123:104558. doi:10.1016/j.ssci.2019.104558
3. Al Reesi H, Freeman J, Davey J, Al Adawi S, Al Maniri A. Measuring risky driving behaviours among young drivers: development of a scale for the Oman setting. Transp Res F. 2018;55:78–89. doi:10.1016/j.trf.2018.02.030
4. Lawton R, Parker D, Manstead A, Stradling S. The role of affect in predicting social behaviors: the case of road traffic violations. J Appl Soc Psychol. 2010;27(14):1258–1276. doi:10.1111/j.1559-1816.1997.tb01805.x
5. Scott-Parker B, Hyde M, Watson B, King M. Speeding by young novice drivers: what can personal characteristics and psychosocial theory add to our understanding? Accid Anal Prev. 2013;50:242–250. doi:10.1016/j.aap.2012.04.010
6. Job F, Hatfield J, Soames job RF. A systematic investigation of the differential predictors for speeding, drink-driving, driving while fatigued, and not wearing a seat belt, among young drivers. Transp Res F. 2010;13(3):179–196. doi:10.1016/j.trf.2010.04.007
7. Carlos M, Gonzalez L, Wahlstrom J, Ramirez G, Runger G. How smartphone accelerometers reveal aggressive driving behavior?–the key is the representation. IEEE Trans Intell Transp. 2019;99:1–11.
8. Sagberg F, Johansson O, Sundfor H. Combining roadside interviews and on-road observation for assessing prevalence of driver inattention. Transp Res F. 2019;62:305–315. doi:10.1016/j.trf.2019.01.004
9. Tosi J, Ledesma R, Lázaro C, Poó F. Implicit attitudes towards risky driving behaviors: evidence of validity for the implicit association test. J Safety Res. 2020;75:284–291. doi:10.1016/j.jsr.2020.08.008
10. Sani SRH, Tabibi Z, Fadardi JS, Stavrinos DJ. Aggression, emotional self-regulation, attentional bias, and cognitive inhibition predict risky driving behavior. Accid Anal Prev. 2017;109:78–88. doi:10.1016/j.aap.2017.10.006
11. Machin M, Sankey K. Relationships between young drivers’ personality characteristics, risk perceptions, and driving behaviour. Accid Anal Prev. 2008;40(2):541–547. doi:10.1016/j.aap.2007.08.010
12. Zahid M, Chen Y, Khan S, Jamal A, Ijaz M, Ahmed TJ. Predicting risky and aggressive driving behavior among taxi drivers: do spatio-temporal attributes matter? Int J Environ Res Public Health. 2020;17(11):3937. doi:10.3390/ijerph17113937
13. Baker AE, Tashjian SM, Goldenberg D, Galván AJ. Neural activity moderates the association between sleep and risky driving behaviors in adolescence. Dev Cogn Neuros Neth. 2020;43:100790. doi:10.1016/j.dcn.2020.100790
14. Rhodes N, Pivik K. Age and gender differences in risky driving: the roles of positive affect and risk perception. Accid Anal Prev. 2011;43(3):923–931. doi:10.1016/j.aap.2010.11.015
15. Leung S, Starmer G. Gap acceptance and risk-taking by young and mature drivers, both sober and alcohol-intoxicated, in a simulated driving task. Accid Anal Prev. 2005;37(6):1056–1065. doi:10.1016/j.aap.2005.06.004
16. Wang C, Xu C, Xia J, Qian Z. The effects of safety knowledge and psychological factors on self-reported risky driving behaviors including group violations for e-bike riders in China. Transp Res F. 2018;56:344–353. doi:10.1016/j.trf.2018.05.004
17. Elander J, West R, French D. Behavioral correlates of individual differences in road-traffic crash risk: an examination of methods and findings. Psychol Bull. 1993;113(2):279–294. doi:10.1037/0033-2909.113.2.279
18. Taubman-Ben-Ari O, Mikulincer M, Gillath O. The multidimensional driving style inventory–scale construct and validation. Accid Anal Prev. 2004;36(3):323–332. doi:10.1016/S0001-4575(03)00010-1
19. Reason JT, Manstead A, Stradling S, Baxter J, Campbell K. Errors and violations on the roads: areal distinction. Ergonomics. 1990;33(10–11):1315. doi:10.1080/00140139008925335
20. Boyce T, Geller E. An instrumented vehicle assessment of problem behavior and driving style: do younger males really take more risks? Accid Anal Prev. 2002;34(1):51–64. doi:10.1016/S0001-4575(00)00102-0
21. Zuckerman M, Eysenck SB, Eysenck HJ. Sensation seeking in England and America: cross-cultural, age, and sex comparisons. J Consult Clin Psychol. 1978;46(1):139–149. doi:10.1037/0022-006X.46.1.139
22. Zuckerman M. Sensation Seeking (Psychology Revivals): Beyond the Optimal Level of Arousal.
23. Lee KW, Yoon HS, Song JM, Park KR. Convolutional neural network-based classification of driver’s emotion during aggressive and smooth driving using multi-modal camera sensors. Sensors. 2018;18(4):957. doi:10.3390/s18040957
24. Navon M, Taubman-Ben-Ari O. Driven by emotions: the association between emotion regulation, forgivingness, and driving styles. Transp Res F. 2019;65:1–9. doi:10.1016/j.trf.2019.07.005
25. Jeon M, Walker BN, Yim JB. Effects of specific emotions on subjective judgment, driving performance, and perceived workload. Transp Res F. 2014;24:197–209. doi:10.1016/j.trf.2014.04.003
26. Herrero-Fernández D, Fonseca-Baeza S. Angry thoughts in Spanish drivers and their relationship with crash-related events. The mediation effect of aggressive and risky driving. Accid Anal Prev. 2017;106:99–108. doi:10.1016/j.aap.2017.05.015
27. Hu TY, Xie X, Li J. Negative or positive? The effect of emotion and mood on risky driving. Transp Res F. 2013;16:29–40. doi:10.1016/j.trf.2012.08.009
28. Bogdan-Ganea S, Herrero-Fernández D. Aggressive thinking on the road. The mediation effect of aggressive thinking in the relationship between driving anger and aggression in Romanian drivers. Transp Res F. 2018;55:153–166. doi:10.1016/j.trf.2018.02.028
29. Ābele L, Haustein S, Møller M, Zettler I. Links between observed and self-reported driving anger, observed and self-reported aggressive driving, and personality traits. Accid Anal Prev. 2020;140:105516. doi:10.1016/j.aap.2020.105516
30. Bogdan SR, Mairean C, Havarneanu CE. A meta-analysis of the association between anger and aggressive driving. Transp Res F. 2016;42:350–364. doi:10.1016/j.trf.2016.05.009
31. Mirón-Juárez C, García-Hernández C, Ochoa-ávila E, Díaz-Grijalva G. Approaching to a structural model of impulsivity and driving anger as predictors of risk behaviors in young drivers. Transp Res F. 2020;72:71–80. doi:10.1016/j.trf.2020.05.006
32. Scott-Parker B, Watson B, King M, Hyde M. A further exploration of sensation seeking propensity, reward sensitivity, depression, anxiety, and the risky behaviour of young novice drivers in a structural equation model. Accid Anal Prev. 2013;50:465–471. doi:10.1016/j.aap.2012.05.027
33. Brown P, George A, Rickwood D. Rash impulsivity, reward seeking and fear of missing out as predictors of texting while driving: indirect effects via mobile phone involvement. Pers Individ Differ. 2021;171:110492. doi:10.1016/j.paid.2020.110492
34. Iversen H. Risk-taking attitudes and risky driving behavior. Transp Res F. 2004;7(3):135–150. doi:10.1016/j.trf.2003.11.003
35. Ulleberg P, Rundmo T. Personality, attitudes and risk perception as predictors of risky driving behaviour among young drivers. Saf Sci. 2003;41(5):427–443. doi:10.1016/S0925-7535(01)00077-7
36. Liu Y, Wang X. The analysis of driver’s behavioral tendency under different emotional states based on a Bayesian network. IEEE Trans Affect Comput. 2020;1. doi:10.1109/TAFFC.2020.3027720
37. Liu Y, Wang X. Differences in driving intention transitions caused by driver’s emotion evolutions. Int J Environ Res Public Health. 2020;17(19):6962. doi:10.3390/ijerph17196962
38. Yang J, Du F, Qu W, Gong Z, Sun X. Effects of personality on risky driving behavior and accident involvement for Chinese drivers. Traffic Inj Prev. 2013;14(6):565–571. doi:10.1080/15389588.2012.748903
39. Zhang Y, Chen Z. Test of sensation seeking scale in Chinese subjects and its factor analysis. J Psychol Sci. 1990;4:1–7.
40. McGinley JJ, Friedman BH. Autonomic specificity in emotion: the induction method matters. Int J Psychophysiol. 2017;118:48–57. doi:10.1016/j.ijpsycho.2017.06.002
41. Clark D. On the induction of depressed mood in the laboratory: evaluation and comparison of the Velten and musical procedures. Adv Behav Res Ther. 1983;5(1):27–49. doi:10.1016/0146-6402(83)90014-0
42. Martin M. On the induction of mood. Clin Psychol Rev. 1990;10(6):669–697. doi:10.1016/0272-7358(90)90075-L
43. Mehrabian A, Epstein N. A measure of emotional empathy. J Res Pers. 1972;40(4):525–543. doi:10.1111/j.1467-6494.1972.tb00078.x
44. Mehrebian A. Evidence for a three-factor theory of emotions. J Res Pers. 1977;11(3):273–294. doi:10.1016/0092-6566(77)90037-X
45. Wang X, Liu Y, Wang F, Wang J, Liu L, Wang J. Feature extraction and dynamic identification of drivers’ emotions. Transp Res F. 2019;62:175–191. doi:10.1016/j.trf.2019.01.002
46. Shen Y, Nakajima M, Zhang Z, Fukuda T. Dynamic force characterization microscopy based on integrated nanorobotic AFM and SEM system for Detachment Process Study. IEEE ASME Trans Mechatron. 2015;20(6):3009–3017. doi:10.1109/TMECH.2015.2413779
47. Marturi N, Tamadazte B, Dembélé S, Piat N. Image-guided nanopositioning scheme for SEM. Sci Eng. 2016;15(1):45–56.
48. Nicolas C, Kim J, Chi S. Quantifying the dynamic effects of smart city development enablers using structural equation modeling. Sust Cities Soc. 2019;53:101916. doi:10.1016/j.scs.2019.101916
49. Qiu H, Lin B. Principle and Application of Structural Equation Modeling. Beijing: China Light Industry Press; 2009.
50. James LR, Brett JM. Mediators, moderators, and tests for mediation. J Appl Psychol. 1984;69(2):307. doi:10.1037/0021-9010.69.2.307
51. Af Wåhlberg A, Dorn L, Kline T. The Manchester driver behaviour questionnaire as a predictor of road traffic accidents. Theor Issues Ergon Sci. 2011;12(1):66–86. doi:10.1080/14639220903023376
52. Wang X, Xu X. Assessing the relationship between self-reported driving behaviors and driver risk using a Naturalistic Driving Study. Accid Anal Prev. 2019;128:8–16. doi:10.1016/j.aap.2019.03.009
53. Martinussen LM, Møller M, Prato CG, Haustein S. How indicative is a self-reported driving behaviour profile of police registered traffic law offences? Accid Anal Prev. 2017;99:1–5. doi:10.1016/j.aap.2016.10.031
54. Gianfranchi E, Tagliabue M, Spoto A, Vidotto G. Sensation seeking, non-contextual decision making, and driving abilities as measured through a moped simulator. Front Psychol. 2017;8:2126. doi:10.3389/fpsyg.2017.02126
55. Rahemi Z, Ajorpaz N, Esfahani M, Aghajani M. Sensation-seeking and factors related to dangerous driving behaviors among Iranian drivers. Pers Individ Dif. 2017;116:314–318. doi:10.1016/j.paid.2017.05.004
56. Navon–Eyal M, Taubman–Ben-Ari O. Can emotion regulation explain the association between age and driving styles? Transp Res F. 2020;74:439–445. doi:10.1016/j.trf.2020.09.008
57. Sullman MJ, Paxion J, Stephens A. Gender roles, sex and the expression of driving anger. Accid Anal Prev. 2017;106:23–30. doi:10.1016/j.aap.2017.05.016
58. Trick L, Brandigampola S, Enns J. How fleeting emotions affect hazard perception and steering while driving: the impact of image arousal and valence. Accid Anal Prev. 2012;45:222–229. doi:10.1016/j.aap.2011.07.006
59. Zhang T, Chan AH, Zhang W. Dimensions of driving anger and their relationships with aberrant driving. Accid Anal Prev. 2015;81:124–133. doi:10.1016/j.aap.2015.05.005
60. Reisenzein R. Exploring the strength of association between the components of emotion syndromes: the case of surprise. Cogn Emot 2000;14(1):1–38. doi:10.1080/026999300378978
61. Gerten J, Topolinski S. Shades of surprise: assessing surprise as a function of degree of deviance and expectation constraints. Cognition. 2019;192:103986. doi:10.1016/j.cognition.2019.05.023
62. Oatley K, Keltner D, Jenkins JM. Understanding Emotions. Washington: Blackwell publishing; 2006.
63. Schmidt-Daffy M. Fear and anxiety while driving: differential impact of task demands, speed and motivation. Transp Res F. 2013;16:14–28. doi:10.1016/j.trf.2012.07.002
64. Lu J, Xie X, Zhang R. Focusing on appraisals: how and why anger and fear influence driving risk perception. J Saf Res. 2013;45:65–73. doi:10.1016/j.jsr.2013.01.009
65. Zinzow HM, Brooks JO, Rosopa PJ, et al. Virtual reality and cognitive-behavioral therapy for driving anxiety and aggression in veterans: a Pilot Study. Cogn Behav Pract. 2018;25(2):296–309. doi:10.1016/j.cbpra.2017.09.002
66. Barnard MP, Chapman P. The moderating effect of trait anxiety on anxiety-related thoughts and actions whilst driving. Pers Individ Differ. 2018;135:207–211. doi:10.1016/j.paid.2018.07.027
67. Peng D, Shi F, Shen T, et al. Altered brain network modules induce helplessness in major depressive disorder. J Affect Disord. 2014;168:21–29. doi:10.1016/j.jad.2014.05.061
68. Eyben F, Wöllmer M, Poitschke T, et al. Emotion on the road-necessity, acceptance, and feasibility of affective computing in the car. Adv Hum Comput Interact. 2010;2010:1–17. doi:10.1155/2010/263593
69. James L. Road Rage and Aggressive Driving: Steering Clear of Highway Warfare. Los Angeles: Prometheus Books; 2009.
70. Taubman-Ben-Ari O. The effects of positive emotion priming on self-reported reckless driving. Accid Anal Prev. 2012;45:718–725. doi:10.1016/j.aap.2011.09.039
 © 2021 The Author(s). This work is published and licensed by Dove Medical Press Limited. The
full terms of this license are available at https://www.dovepress.com/terms
and incorporate the Creative Commons Attribution
- Non Commercial (unported, 3.0) License.
By accessing the work you hereby accept the Terms. Non-commercial uses of the work are permitted
without any further permission from Dove Medical Press Limited, provided the work is properly
attributed. For permission for commercial use of this work, please see paragraphs 4.2 and 5 of our Terms.
© 2021 The Author(s). This work is published and licensed by Dove Medical Press Limited. The
full terms of this license are available at https://www.dovepress.com/terms
and incorporate the Creative Commons Attribution
- Non Commercial (unported, 3.0) License.
By accessing the work you hereby accept the Terms. Non-commercial uses of the work are permitted
without any further permission from Dove Medical Press Limited, provided the work is properly
attributed. For permission for commercial use of this work, please see paragraphs 4.2 and 5 of our Terms.