Back to Journals » Neuropsychiatric Disease and Treatment » Volume 13
The Maugeri Stress Index – reduced form: a questionnaire for job stress assessment
Authors Massidda D, Giorgi I, Vidotto G ![]() , Tringali S, Imbriani M, Baiardi P, Bertolotti G
, Tringali S, Imbriani M, Baiardi P, Bertolotti G ![]()
Received 24 February 2016
Accepted for publication 18 July 2016
Published 24 March 2017 Volume 2017:13 Pages 917—926
DOI https://doi.org/10.2147/NDT.S107030
Checked for plagiarism Yes
Review by Single anonymous peer review
Peer reviewer comments 3
Editor who approved publication: Dr Roger Pinder
Davide Massidda,1 Ines Giorgi,2 Giulio Vidotto,3 Salvatore Tringali,4 Marcello Imbriani,4,5 Paola Baiardi,6 Giorgio Bertolotti7
1Giunti O.S. Organizzazioni Speciali, Firenze, Italy; 2Psychology Unit, ICS Maugeri, IRCCS, Pavia, Italy; 3Department of General Psychology, University of Padova, Padova, Italy; 4ICS Maugeri, IRCCS, UOOML, Pavia, Italy; 5Department of Public Health, Experimental and Forensic Medicine, University of Pavia, Pavia, Italy; 6Scientific Direction, ICS Maugeri, IRCCS, Pavia, Italy; 7Psychology Unit, ICS Maugeri, IRCCS, Tradate, Italy
Introduction and objectives: A multidimensional self-report questionnaire to evaluate job-related stress factors is presented. The questionnaire, called Maugeri Stress Index – reduced form (MASI-R), aims to assess the impact of job strain on a team or on a single worker by considering four domains: wellness, resilience, perception of social support, and reactions to stressful situations.
Material and methods: The reliability of a first longer version (47 items) of the questionnaire was evaluated by an internal consistency analysis and a confirmatory factor analysis. An item reduction procedure was implemented to obtain a short form of the instrument, and the psychometric properties of the resulting instrument were evaluated using the Rasch measurement model.
Results: A total of 14 items from the initial pool were deleted because they were not productive for measurement. The analysis of internal consistency led to the exclusion of eight items, while the analysis performed using structural equation models led to the exclusion of another six items. According to the Rasch model, item properties and the reliability of the instruments appear good, especially for the scales for wellness and resilience. In contrast, the scales for perception of social support and negative coping styles show a lower internal consistency.
Conclusions: The Maugeri Stress Index – reduced form provides a reliable and valid measure, useful for early identification of stress levels in workers or in a team along the eustress–vadistress continuum.
Keywords: occupational stress, stress, psychometrics, questionnaire, validation
Introduction
It is well known that job stress is responsible for poor work performance, high absenteeism, less work productivity, and several diseases.1–5 Recently, results from thirteen independent cohort studies in Europe indicated that job strain is responsible for coronary heart disease, as are lifestyle and orthodox risk factors.6 The population’s attributable risk for job strain was 3.4%, which is lower than that for smoking habits (36%), abdominal obesity (20%), and physical inactivity (12%). However, the INTERHEART study7 showed that work stress doubled the risk of coronary heart disease.
In Finland, the increase in job strain was associated with an increase in the risk of requiring a disability pension. Moreover, as regarding men, a positive association between cardiovascular diseases and an increased risk of disability pension was found.8
Mental health caused disabling conditions in 9% of the population in the UK, and estimations for the 2001–2002 prevalence of self-reported illness caused or made worse by work classified stress, depression, or anxiety as the second most commonly reported illness.9
Within this context, in 2010, in Italy, a governmental commission published several indications for the evaluation of stress. The commission identified a preliminary phase and a second phase for in-depth examination. Instruments for self-evaluation such as psychometric tests are recommended during the second phase. In this context of changes in the cultural and legislative background, the authors have taken the opportunity to contribute to the development of models for the identification and assessment of stress, responding to the demand for specific measurement instruments.
Data from the literature as well as normative requirements suggest the need for methods for the early identification of stress in workers. Some instruments have already been developed, such as the Job Content Questionnaire,10–12 the Work Organization Assessment Questionnaire,13 and the Effort–Reward Imbalance Questionnaire.14,15 These instruments are considered complementary sources since they are based on different concepts of the work-related stress. They are mainly focused on measuring the job climate, the facets of job organization, or the balance between effort and reward, but an in-depth examination of individual resources and capabilities is lacking.
Newman and Beehr16 underlined that job stress is a situation wherein job-related factors interact with the worker to change his/her psychological and/or physiological condition, forcing a person to deviate from normal functioning. From this viewpoint, the focus is not the stressful situation or the subjective perception, but the interaction between these two components.
In agreement with this rationale, we developed a new multidimensional instrument called the Maugeri Stress Index (MASI) designed to investigate individual resources for coping with stressful situations on the job. The instrument was developed for an in-depth examination, but it is also usable in the preliminary phase and for monitoring homogeneous groups of workers when individual resources play a critical role in coping with the demands arising from organizational changes. The development of the instrument has involved mainly health care professionals. This group of workers represents a category particularly at risk for the development of job stress, and for this reason they can be considered a representative sample of the target population.
The first version was tested on a restricted sample (n=329) and has already been published with some clinical qualities and some limitations.17 The aims of this study were to develop a shorter form of the questionnaire using an item reduction procedure and to assess the psychometric properties of the resulting instrument using the Rasch measurement model.
Materials and methods
The MASI (Figure S1) requires participants to express their level of agreement with 51 items on a five-point Likert scale (never, little, enough, much, very much). The questionnaire is composed of four main scales including 47 items: Wellness (eleven items), Resilience (20 items), Perception of social support (nine items), and Negative coping styles (seven items). Further, a Lie scale (four items) is included. A high score on the index shows perceived eustress.
Previously, Giorgi et al17 studied the dimensionality of the instrument by using exploratory factor analysis. In the study here presented, we analyzed the internal consistency of the MASI and its factorial structure by using structural equation models (SEMs).18 Therefore, starting with these results, we developed a reduced form of the instrument, the Maugeri Stress Index – reduced form (MASI-R), which is described in this paper. The psychometric properties of the MASI-R are analyzed using the Rasch measurement model.19 The Scientific and Technical Committee (IRB) of the Care and Research Institute of Tradate (Varese, Italy), Salvatore Maugeri Foundation IRCCS, discussed and approved the study (5/5/2015 cod. Psi1/16).
Participants
The sample comprised 1,182 participants (females: 57.6%; males: 42.4%) with a mean age of 45.7 years (standard deviation =9.0). A large portion of participants (76.1%) were employees or health professionals. Other subjects engaged in the study were factory workers (15.1%), teachers (4.6%), and managers (4.2%). Of the sample, 93.9% had a permanent work contract and 38.0% were shift workers. All the participants filled in the questionnaire voluntarily after a short motivational presentation made by a psychologist. Each participant provided written informed consent for the use of data in anonymous form.
Missing data
Participants who omitted at least 25% of responses (13 items) were not considered in the analysis. Therefore, seven subjects were removed, and 1,175 units were used for analysis. Regarding SEM analysis, the remaining missing data were replaced by the mean of the responses for each item. By contrast, for the Rasch analysis, only the complete cases were considered, leading to a total sample of 904 subjects.
Statistical analyses
Analyses were conducted to study the reliability of the MASI and its factorial structure.
The confirmatory factor analysis was used to test and improve the fit of the data for the hypothesized four-factor model (see “Missing data” section). The confirmatory factor analysis is part of the general methodology of the SEM and allows us to test causal relations between latent and observed variables. The analysis was started by building an independence model, assuming uncorrelated latent factors. As a second step, we tested the presence of relations between the latent factors, performing a model comparison. We used the independence model as a baseline. Step by step, we imposed covariance relations among factors, looking for an improvement in the fit. A similar methodology was applied to select the items in order to reduce their number and to simplify the instrument.
To make model comparisons, we used the Akaike information criterion (AIC)20 and the Bayesian information criterion (BIC)21 to identify which model was better.22,23 Since the best model has the lowest indices, we compared the information criteria of a complex model with those of the simpler one, obtaining two differences: ΔAIC and ΔBIC. A negative difference indicates that the complex model is better than the simpler one; a difference of ΔBIC ≤−2 is generally accepted as positive evidence for the difference between two models.24 In contrast to the AIC, the BIC penalizes greatly complex models: a very complex model would have to improve the fit substantially in order for BIC to choose it as the best. The fit indices used to evaluate the models are summarized in Table 1.
 | Table 1 Fit indices used in the structural equation modeling. Optimal values are indicated |
The item properties were analyzed using the partial credit model,25 a polytomous formulation of the Rasch model. The Rasch model is a well-known one-parameter logistic model, commonly applied for the evaluation of the properties of a unidimensional psychometric test with an ordinal response scale. It assumes that the probability of a person producing a positive outcome to an item depends on the distance between the person’s ability and the item’s difficulty.
In contrast to the classical test theory and the SEM approach, the Rasch model is centered on the study of items and their properties. The model tests the calibration of the instrument on a population, putting persons’ abilities and item difficulties into the same scale. It can distinguish between the easiest and hardest items and evaluate if the instrument leads to a reliable measure of the latent trait.
The scales of the MASI were studied separately, fitting one partial credit model for each scale. The reliability was evaluated using the separation index G for persons (GP) and items (GI) and the person separation reliability R, which corresponds to Cronbach’s α.26 A high variability in persons’ abilities and in item difficulties is necessary so that the measurement is reliable. Gp quantifies the number of strata of abilities that the instrument can separate and identify as different; a low value (GP <2) is a sign that the instrument may not be sensitive enough to distinguish between individuals with high and low performance abilities.27 By contrast, a low GI value (GI <3) indicates that either the variance of item difficulties is too small or the sample is not large enough.
Item properties have been evaluated using two popular indices:27 Infit (information-weighted fit) and Outfit (outlier-sensitive fit). Both indices are calculated based on the mean square of standardized residuals for items, but Outfit is more sensitive to outliers than Infit. Acceptable values range between 0.6 and 1.4;28 lower values indicate underfit (ie, the presence of unexplained variance) and higher values indicate overfit (ie, redundancy in the set of items).
The unidimensionality of each scale was assessed by evaluating the strength of correlations between residuals and the results of the principal component analysis performed on the residuals.29 Since the Rasch analysis extracts the first, and theoretically, the only latent component within each scale, residuals should be constituted only by random noise. A simple rule of thumb27 is that if the residuals are constituted by pure random noise, the eigenvalue of the first extracted component must be less than 2 (ie, a strength of less than two items). Furthermore, we used the Martin-Löf test,30 which splits the scale into two clusters of items on the basis of the median difficulty and performs a likelihood ratio test. Unidimensionality is highlighted by a nonsignificant χ2 value.
Analyses were performed in the R environment,31 using the packages lavaan 0.5–1132 for the confirmatory factor analysis and eRm 0.15–033 for the Rasch analysis.
Results
Internal consistency of the MASI
The internal consistency, measured by the Cronbach’s α, appeared good for the scales Wellness (α=0.94) and Resilience (α=0.89). In contrast, for the scales Perception of social support (α=0.64) and Negative coping styles (α=0.65), the values were not so good, although they were acceptable.
We considered the correlation between each item and the total score of the respective scale (calculated excluding the target item). Within the scale of perception of social support, we identified four items with an item-total correlation lower than 0.3. These items were: 4, 13, 17, and 28 (the content of items are reported in Figure S1). Whereas the item-total correlation for items 4 and 28 were near 0.3, the indices for items 13 and 17 were lower than 0.2. The most problematic item was 13, because the Cronbach’s α of the respective scale increased if this item was deleted.
We observed a medium-sized Pearson’s correlation between the scales Resilience and Wellness (r=0.53, P<0.001) and between Resilience and Perception of social support (r=0.45, P<0.001).
Confirmatory factor analysis of the MASI
The confirmatory factor analysis started with the estimation of the independence model, assuming uncorrelated latent dimensions. All parameters were estimated to be significantly different from zero for P<0.001. For the Wellness scale, the standardized parameters ranged between 0.61 and 0.87, while the values for the Resilience scale were between 0.33 and 0.71. In the Perception of social support scale, the coefficients ranged between 0.11 and 0.66 (item 13 was the only one that was significant for P<0.01). Finally, in the Negative coping styles scale, the values ranged between 0.35 and 0.55.
The goodness-of-fit indices highlighted a poor fit (comparative fit index [CFI] =0.78, nonnormed fit index [NNFI] =0.77, root mean squares error of approximation [RMSEA] =0.06). Therefore, we proceeded to free the covariance relations between the latent dimensions one by one, looking for an improvement. We released, in sequence, the covariance parameters for Wellness, Resilience, and Perception of social support. In the last step, we freed the covariance relations with the Negative coping styles scale. At each step, the new model was compared with the previous one using the difference in AIC and BIC. The progressive deletion of constraints in covariance parameters improved the model (CFI =0.82, NNFI =0.81, RMSEA =0.06).
Item reduction procedure
In order to develop a short form of the MASI, we implemented an item selection procedure to reduce the length of the questionnaire. As a first step, starting from the identified model in the “Confirmatory factor analysis of the MASI” section (correlated factors), we deleted selected items one by one, looking for a better internal consistency. The candidate items for deletion were those with an item-total correlation of less than 0.3 and those that, if deleted, caused an increase in the Cronbach α. We deleted three items from the scale Perception of social support (13, 17, and 4), three items from the scale Resilience (36, 8, and 22), and two items from the Negative coping styles scale (38 and 15). The resulting model showed a better fit than the starting model (CFI =0.86, NNFI =0.85, RMSEA =0.06).
As the second step, using SEM, we tested the presence of covariance between errors. Inspecting modification indices, we identified several candidate parameters to free, concentrating our attention on items with semantic similarities in content. Table 2 reports the pairs of correlated items analyzed.
 | Table 2 Pairs of items correlated according to the study of errors |
Freeing these parameters one at a time, AIC and BIC showed an improvement of the fit for each step; further, the final model showed better fit indices (CFI =0.89, NNFI =0.88, RMSEA =0.05) than the starting one.
Since the semantic content of several items was very similar, we kept only one item from each pair, considering the relevance of the item in a clinical perspective as driving principle for the choice. Competing items are reported in Table 2, with bold items being included in the final model. In one case (6S and 11S), we deleted both items, and in two cases, (items 33 and 25 and items 29 and 39) we kept both items. The final model considered item 37, marked in bold in Figure S1, which constitutes the short version of the tool, called MASI-R. Figure 1 is a graphical description of the model with estimated parameters; fit indices indicate an acceptable fit with the data (CFI =0.88, NNFI =0.87) and a good error of approximation of the model (RMSEA =0.05).
 | Figure 1 Path diagram and estimated parameters for the selected model of the MASI-R. |
Rasch analysis of the MASI-R
Preliminarily, we evaluated the possible presence of a differential item functioning on the scales. Using the regression approach, we tested the invariance of item scores across several clusters of subjects, taking into account the sex of participants, their age, the presence/absence of job shifts, and the length of service. For each scale, F-tests sometimes showed significant results at the 5% level, but the effect sizes were always very low (η2 <0.05). Since the effect of these variables on the total scores was not noticeable, they were not considered significant.
Regarding the issue of reliability, the results of the analyses on the MASI-R were similar to the results of the analyses on the MASI. The person reliability appeared good for the scales Wellness (R=0.89) and Resilience (R=0.89) and were acceptable for the scales Perception of social support (R=0.70) and Negative coping styles (R=0.50). In the two latter scales, the persons’ separation indices seemed critical: GP =1.52 for Perception of social support and GP =0.99 for Negative coping styles. In contrast, for the Wellnesss (GP =2.87) and Resilience (GP =2.79) scales, the persons’ separation indices were more adequate.
Both Infit and Outfit were always good (Table 3) and neither underfit nor overfit affected the items.
 | Table 3 Fit indices for items for the partial credit model of the MASI-R |
Figure 2 depicts the calibration of the instrument, comparing the distribution of the persons’ abilities and item difficulties along the logit scale. For each panel, the scores on the left side represent persons with high stress (ie, low “ability”), while the right side represents persons with low stress (ie, high “ability”). Similarly, the item thresholds are ordered from easiest to hardest. The matched distributions of persons’ abilities and item difficulties show that difficulties cover the abilities quite well. This is confirmed by the separation indices GI, for which the values are always good (Wellness: 15.10, Resilience: 6.80, Perception of social support: 11.01, Negative coping styles: 4.55), showing that the variances of item difficulties are adequate for measuring latent dimensions because they cover the entire spectrum of each trait.
 | Figure 2 Person–item maps for: (A) wellness, (B) resilience, (C) perception of social support and (D) negative coping styles. |
Finally, we tested the actual unidimensionality of the MASI-R scales. For each one, all of the correlations between residuals were lower than 0.4 (rarely did they exceed 0.3). Further, the eigenvalues estimated by the principal component analyses were always lower than 2. Moreover, the Martin-Löf test confirmed that no other components appeared to be present within the four scales: χ2 values were never significant.
Discussion
This paper presents the MASI-R, a new psychometric instrument that aims to screen for job stress. The instrument is structured as a self-report questionnaire that is relatively short but psychometrically comprehensive. It is easy to administer and can be completed quickly by most respondents. The MASI-R allows us to obtain a reliable measure of exposure to workplace stress and its impact on workers.
Using four correlated subscales (Wellness, Resilience, Perception of social support, Negative copying styles) and a Lie index, the questionnaire measures several dimensions that determine the total index. The total index can be obtained as the sum of responses (coded from 1 to 5). When the response pattern presents missing items, these values can be estimated by the mean of the provided responses.
The MASI-R originates from a reduction of the original longer MASI, whose scales include an overall pool of 47 items. Using an item selection procedure, we selected and removed those items that did not adequately contribute to the measurement. The structure of the instrument was further improved using an SEM. Redundant items were deleted, keeping only those considered relevant in a clinical perspective. The Rasch model indicated good item properties with neither underfit, overfit, nor differential item functioning between population strata. Furthermore, item difficulties covered the persons’ abilities quite well.
The scales of Wellness and Resilience showed the best internal consistency. The first one refers to a general condition of wellness, serenity, and satisfaction; it is defined by the absence of negative symptoms and by the presence of optimism regarding the work experience. The Resilience scale evaluates skills such as tenacity, flexibility, and the ability to deal with problems on the job.
The other two scales have a restricted number of items. Perception of social support explores a component that plays a fundamental role in stress and burnout, consisting of the perception of adequate support and assistance from colleagues and superiors.34 By contrast, the Negative coping styles scale investigates the presence of social isolation, behavioral disengagement, anxiety, or irritability in reaction to stressor situations. For both scales, we registered low persons’ separation indices. This was probably due to the small number of items included in the scales, but it might also indicate a restricted ability range within the selected sample.27
The MASI-R assumes stress as a general and unidimensional latent factor that shows itself in a broad spectrum of facets. These facets are clustered in the four identified components. According to this point of view, the four extracted factors are different expressive features of the same latent trait. Since the factors depend on the same underlying trait, they are strictly related. The correlation between the four latent traits suggests that the number of items could be further reduced and the total score could be used as a uniform one-factorial measure. Future studies are required in this direction.
Recently, a study regarding the discriminant validity of the MASI-R was published35 and the results show that workers exposed to workplace mobbing showed higher work stress levels compared to the control group in all aspects measured.
Conclusion
In summary, using only 37 items, the MASI-R can measure the perception of wellness and support, the resilience capability, and the behavioral reactions of individuals coping with stressful situations in the workplace. Further, unlike other instruments, the MASI-R provides a Lie index capable of identifying cheating responders, a phenomenon that can occur in workplace contexts. It is focused on the relation between the worker and stressful situations on the job, and it could be used to drive interventions centered on the interaction between the work environment and individual perceptions and resources.
Disclosure
The authors report no conflicts of interest in this work.
References
Aboa-Éboulé C, Brisson C, Maunsell E, et al. Effort-reward imbalance at work and recurrent coronary heart disease events: a 4-year prospective study of post-myocardial infarction patients. Psychosom Med. 2011;73:436–447. | ||
Belkic KL, Landsbergis PA, Schnall PL, Baker D. Is job strain a major source of cardiovascular disease risk? Scand J Work Environ Health. 2004;30:85–128. | ||
Boehm JK, Peterson C, Kivimaki M, Kubzansky LD. Heart health when life is satisfying: evidence from the Whitehall II cohort study. Eur Heart J. 2011;32(21):2672–2677. | ||
Brosschot JF, Van Dijk E, Thayer JF. Daily worry is related to low heart rate variability during waking and the subsequent nocturnal sleep period. Int J Psychophysiol. 2007;63:39–47. | ||
Giorgi I, Calsamiglia G, Negri M, et al. Gestione dello stress occupazionale in un campione di cardiopatici. [Management of occupational stress among patients with cardiac diseases]. G Ital Med Lav Erg. 2007; 29(3):695–696. Italian. | ||
Karasek R, Collins S, Clays E, Bortkiewicz A, Ferrario M. Description of a large-scale study design to assess work-stress-disease associations for cardiovascular disease. Int J Occup Med Environ Health. 2010;23:293–212. | ||
Kivimäki M, Nyberg ST, Batty D, et al; IPD-Work Consortium. Job strain as a risk factor for coronary heart disease: a collaborative meta-analysis of individual participant data. Lancet. 2012;380:1491–1497. | ||
Yusuf S, Hawken S, Ounpuu S, et al; INTERHEART Study Investigators. Effect of potentially modifiable risk factors associated with myocardial infarction in 52 countries (the INTERHEART study): case-control study. Lancet. 2004;364:937–952. | ||
Mäntyniemi A, Oksanen T, Salo P, et al. Job strain and the risk of disability pension due to musculoskeletal disorders, depression or coronary heart disease: a prospective cohort study of 69,842 employees. Occup Environ Med. 2012;69:574–581. | ||
Choi B, Bjorner JB, Ostergren PO, et al. Cross-language differential item functioning of the job content questionnaire among European countries: the JACE study. Int J Behav Med. 2009;16:136–147. | ||
Karasek RA. Job demands, job decision latitude and mental strain: implications for job redesign. Adm Sci Q. 1979;24:285–288. | ||
Karasek R, Brisson C, Kawakami N, Houtman I, Bongers P, Amick B. The Job Content Questionnaire (JCQ): an instrument for internationally comparative assessments of psychosocial job characteristics. J Occup Health Psychol. 1998;3:322–355. | ||
Griffiths A, Cox T, Karanika M, Khan S, Tomàs JM. Work design and management in the manufacturing sector: development and validation of the Work Organisation Assessment Questionnaire. Occup Environ Med. 2006;63:669–675. | ||
Siegrist J. Adverse health effects of high-effort/low-reward conditions. J Occup Health Psychol. 1996;1:27–34. | ||
Siegrist J, Starke D, Chandola T, et al. The measurement of effort-reward imbalance at work: European comparisons. Soc Sci Med. 2004;58:1483–1499. | ||
Newman JE, Beehr TA. Personal and organizational strategies for handling job stress: a review of research and opinion. Pers Psychol. 1979;32:1–43. | ||
Giorgi I, Baiardi P, Tringali S, et al. Il Maugeri Stress Index questionnaire per la valutazione dello stress lavoro correlato. [The Maugeri Stress Index: a questionnaire to assess work-related psychological stress]. G Ital Med Lav Ergon. 2011;33(3):B78–B84. Italian. | ||
Jöreskog KG. A general method for estimating a linear structural equation system. In: Goldberger A, Duncan O, editors. Structural Equation Models in the Social Sciences. New York, NY: Seminar Press; 1973:85–112. | ||
Rasch G. Probabilistic Models for Some Intelligence and Attainment Test. Copenhagen, Denmark: Danish Institute for educational Research; 1960. | ||
Akaike H. A new look at the statistical model identification. IEEE Trans Aut Control. 1974;19:716–723. | ||
Schwarz G. Estimating the dimension of a model. Ann Stat. 1978;6:461–464. | ||
Burnham KP, Anderson DR. Multimodel inference: understanding AIC and BIC in model selection. Sociol Method Res. 2004;3:261–304. | ||
Vrieze SI. Model selection and psychological theory: a discussion of the differences between the Akaike Information Criterion (AIC) and the Bayesian Information Criterion (BIC). Psychol Methods. 2012;17:228–243. | ||
Raftery AE. Bayesian model selection in social research. Sociol Methodol. 1995;25:111–163. | ||
Wright BD, Masters GN. Rating Scale Analysis. Chicago, IL: MESA Press; 1982. | ||
Linacre JM. KR-20/Cronbach alpha or Rasch person reliability: which tells the “truth?” Rasch Meas Trans. 1997;11:580–581. | ||
Linacre JM. A User’s Guide to WINSTEPS MINISTEP Computer Programs. Computer Program Manual. Chicago, IL: Mesa Press; 2012. | ||
Bond TG, Fox CM. Applying the Rasch Model .Fundamental Measurement in the Human Sciences. 2nd ed. New York, NY: Routledge; 2007. | ||
Tennant A, Pallant JF. Unidimensionality matters! (a tale of two Smiths?). Rasch Meas Trans. 2006;20:1048–1051. | ||
Christensen KB, Bjorner JB, Kreiner S, Petersen JH. Testing unidimensionality in polytomous Rasch models. Psychometrika. 2012;67:563–574. | ||
R Core Team. R: A Language and Environment for Statistical Computing. R Foundation for Statistical Computing, Vienna, Austria; 2013. ISBN 3-900051-07-0. Available from: http://www.R-project.org. Accessed December 18, 2016. | ||
Rosseel Y. Lavaan: an R package for structural equation modeling. J Stat Softw. 2012;48(2):1–36. | ||
Mair P, Hatzinger R. Extended Rasch modeling: the eRm package for the application of IRT models in R. J Stat Softw. 2007;20:9. | ||
Lindblom KM, Linton SJ, Fedeli C, Bryngelsson IL. Burnout in the working population: relations to psychosocial work factors. Int J Behav Med. 2006;13:51–59. | ||
Giorgi I, Mainetti P, Fiabane E, et al. Capacita discriminante del questionario MASI-R nella percezione di stress lavoro-correlato. [Discriminating capacity of the MASI-R questionnaire in the perception of work-stress]. G Ital Med Lav Ergon. 2014;36(3):175–180. Italian. |
Supplementary material
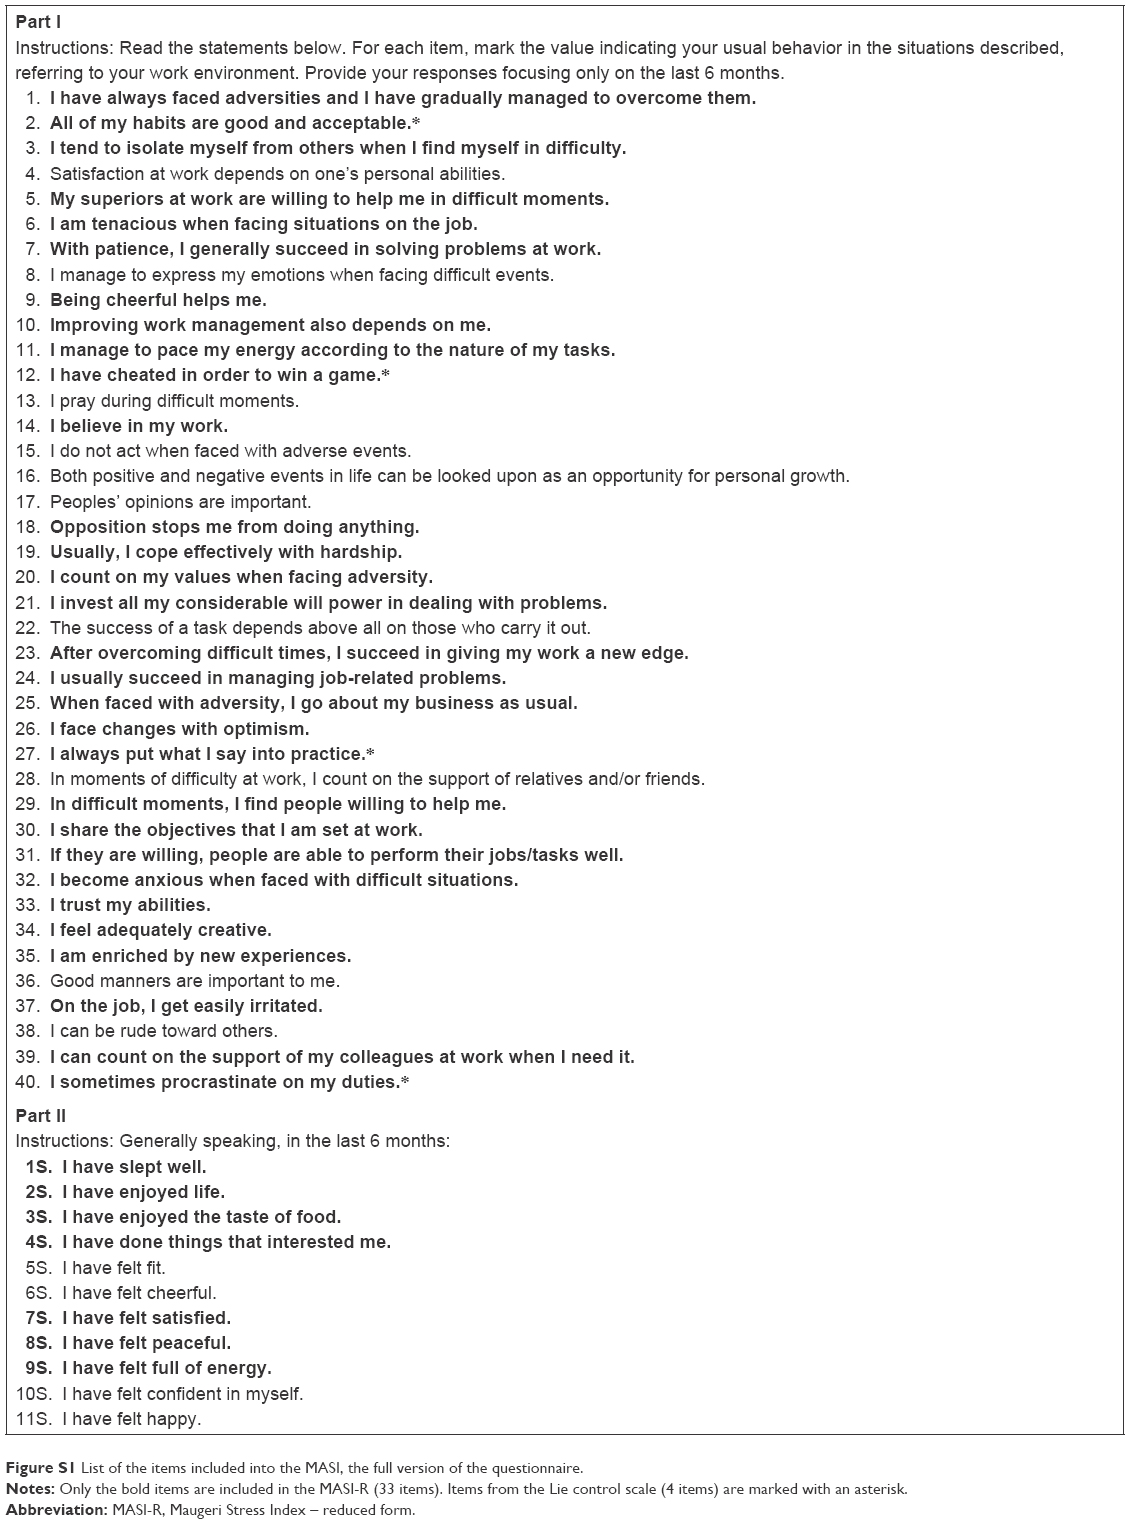 | Figure S1 List of the items included into the MASI, the full version of the questionnaire. |
 © 2017 The Author(s). This work is published and licensed by Dove Medical Press Limited. The
full terms of this license are available at https://www.dovepress.com/terms
and incorporate the Creative Commons Attribution
- Non Commercial (unported, 3.0) License.
By accessing the work you hereby accept the Terms. Non-commercial uses of the work are permitted
without any further permission from Dove Medical Press Limited, provided the work is properly
attributed. For permission for commercial use of this work, please see paragraphs 4.2 and 5 of our Terms.
© 2017 The Author(s). This work is published and licensed by Dove Medical Press Limited. The
full terms of this license are available at https://www.dovepress.com/terms
and incorporate the Creative Commons Attribution
- Non Commercial (unported, 3.0) License.
By accessing the work you hereby accept the Terms. Non-commercial uses of the work are permitted
without any further permission from Dove Medical Press Limited, provided the work is properly
attributed. For permission for commercial use of this work, please see paragraphs 4.2 and 5 of our Terms.