Back to Journals » Diabetes, Metabolic Syndrome and Obesity » Volume 13
The Long Noncoding RNA Blnc1 Protects Against Diet-Induced Obesity by Promoting Mitochondrial Function in White Fat
Authors Tang S, Zhu W, Zheng F, Gui W, Zhang W, Lin X ![]() , Li H
, Li H
Received 7 February 2020
Accepted for publication 27 March 2020
Published 17 April 2020 Volume 2020:13 Pages 1189—1201
DOI https://doi.org/10.2147/DMSO.S248692
Checked for plagiarism Yes
Review by Single anonymous peer review
Peer reviewer comments 2
Editor who approved publication: Prof. Dr. Antonio Brunetti
Shengjie Tang, Weifen Zhu, Fenping Zheng, Weiwei Gui, Wenjing Zhang, Xihua Lin, Hong Li
Department of Endocrinology, The Affiliated Sir Run Run Shaw Hospital, Zhejiang University, School of Medicine, Hangzhou 310016, Zhejiang, People’s Republic of China
Correspondence: Xihua Lin; Hong Li Email [email protected]; [email protected]
Introduction: Long noncoding RNAs (lncRNAs) play critical regulatory roles in metabolic disorder. Whereas, the regulatory role of lncRNAs in mitochondrial function of white adipose tissue (WAT) is unknown.
Materials and Methods: We investigated the role of Blnc1 in metabolic homeostasis and mitochondrial function of C57BL/6 mice fed a high-fat diet (HFD) for 12 weeks, followed by multi-point injection of adenovirus carrying Blnc1 into epididymal fat (eWAT). In vitro, mitochondrial biogenesis and function were analyzed in 3T3-L1 pre-adipocytes with Blnc1 overexpression or knockdown. Mechanically, RNA immunoprecipitation (RIP) and chromatin immunoprecipitation (ChIP) were used to highlight the molecular mechanism of Blnc1 in pre-adipocytes.
Results: Gross eWAT weight was significantly decreased and insulin resistance was improved in HFD-Ad-Blnc1 mice. Mitochondrial biosynthesis was induced by Blnc1 in eWAT, as evidenced by an increased mitochondrial DNA and enhanced Mito-tracker staining. The expression of mitochondria-related genes was increased in eWAT, hepatic fatty acid oxidation was upregulated, and lipid deposition was reduced in HFD-Ad-Blnc1 mice. Knockdown of Blnc1 in 3T3-L1 pre-adipocytes resulted in mitochondrial dysfunction. The mechanistic investigation indicated that Blnc1 stimulated the transcription of Pgc1β via decoying hnRNPA1.
Conclusion: Therefore, eWAT-specific overexpression of Blnc1 improves hepatic steatosis and systemic insulin sensitivity, likely by enhancing mitochondrial biogenesis and function.
Keywords: lncRNA-Blnc1, mitochondria, white adipose tissue, obesity, ribonucleoprotein, Pgc1β
Introduction
Obesity is a global public health issue and acts as an important risk factor for chronic diseases such as type 2 diabetes, non-alcoholic fatty liver disease (NAFLD), cardiovascular disease, and cancer.1 Indeed, the global prevalence of obesity has almost tripled since 1975. In 2016, more than 1.9 billion adults were overweight; of them, over 650 million were obese.2
Long noncoding RNA (lncRNAs), as non-protein coding transcripts of >200 nucleotides, are key regulators of gene expression and cellular physiology.3 LncRNAs can be found in the nucleus or cytosol. LncRNAs play important roles in chromatin modification, transcriptional regulation, ribonucleoproteins, microRNA sponges, and mRNA stability.4
Recent studies have focused on lncRNAs as regulators of the endocrine system. Brown fat lncRNA1 (Blnc1) was discovered in a study of the role of lncRNAs in thermogenic adipocyte differentiation.5 Zbtb7b recruits the Blnc1/heterogeneous nuclear ribonucleoprotein U (hnRNPU) complex to activate the thermogenic program in brown adipocytes.6 Blnc1 also orchestrates adipocyte adaptation to obesity and maintains systemic metabolic health.7 In liver tissue, Blnc1 acts as a transcriptional checkpoint to exacerbate insulin resistance and NAFLD.8
Mitochondria play a vital role in maintaining metabolic homeostasis in white and brown adipocytes.9 White adipocytes contain fewer and smaller mitochondria than those of brown adipocytes, but they are important in adipogenesis, adipokine secretion, lipogenesis, lipolysis, and other functions.10 Mitochondrial dysfunction in white adipocytes is associated with metabolic disorders, including obesity and type 2 diabetes.11 Obesity suppresses the oxidative capacity, enhances the production of reactive oxygen species, and reduces the amount of mitochondrial DNA.12
Peroxisome proliferator-activated receptor gamma coactivator 1 (PGC1) family of transcriptional coactivators includes Pgc1α and Pgc1β, plays a central role in regulating mitochondrial biogenesis and function.13 In cardiac cells, the PGC-1 coactivators interact with nuclear respiratory factor 1 (NRF1), estrogen-related receptor a(ERRa) and peroxisome proliferator-activated receptor a(PPARa), leading to stimulate mitochondrial biogenesis.14 In both white and brown adipocyte differentiation, the expression of Pgc1α and Pgc1β was significantly increased along with the progress.15
Heterogeneous nuclear ribonucleoproteins (hnRNPs) are a large number of RNA-binding proteins associated with complex and diverse biological processes.16,17 It has been widely reported that hnRNPA1 is the most abundant and acts as an important modulator in various gene regulatory networks.18 Moreover, hnRNPA1 regulates the gene expression and translation of several key factors associated with cell proliferation, metabolism, adaptation to stress.19,20
However, few studies have investigated the regulatory role of lncRNAs in mitochondrial function in WAT.21 We evaluated the role of lncRNA-Blnc1 in metabolic homeostasis and its association with mitochondrial function in white fat.
Materials and Methods
Animal Studies and Adenovirus Administration
Five-week-old male C57BL/6 mice were purchased from the Slack Experimental Animal Center of the Chinese Academy of Sciences. Mice were maintained at 22°C under a 12/12 h light/dark cycle, with ad libitum access to water and standard rodent chow (63.92% carbohydrate, 26.18% protein, and 9.9% fat) or a high-fat diet (HFD; 35% carbohydrate, 20% protein, and 60% fat) for 12 weeks. After 12weeks of HFD feeding, 2 × 10¹⁰ purified adenovirus particles (control or Blnc1) were multi-point injected into eWAT on both sides. After 5 weeks, mice were euthanized by CO2 asphyxiation and the injected eWAT was subjected to assay of the expression of Blnc1 and mitochondria-related genes by quantitative real-time PCR (qRT-PCR) and Western blotting. The eWAT, perirenal WAT (prWAT), inguinal subcutaneous WAT (ingWAT), brown adipose tissue (BAT), and liver were isolated, weighed, and stored at −80°C until use. All protocols for animal use and maintenance were approved by Zhejiang University Animal Care and Use Committee.
In vivo imaging of treated mice was performed using the Xenogen IVIS Lumina imaging system (Caliper). Mice were anesthetized by isoflurane inhalation for 10 to 15 min and imaged in an imaging chamber. The photo images were analyzed using Living Image 4.3 software.
Cell Culture
Mouse 3T3-L1 pre-adipocytes were purchased from ATCC and cultured in Dulbecco’s modified Eagle’s medium (DMEM) supplemented with 10% fetal bovine serum and penicillin-streptomycin at 37°C in an atmosphere containing 5% CO2. Pre-adipocytes were plated onto six-well plates 1 day before transduction with over-Blnc1 adenovirus or knockdown (KD)-Blnc1 lentivirus in medium containing 5 μg/mL Polybrene. After 72 h, the cells were harvested and processed for mitochondrial content and gene expression analysis.
Metabolic Analysis
Intraperitoneal glucose tolerance tests (IPGTTs) and insulin tolerance tests (ITTs) were performed at the end of 5 weeks after adenovirus particles injection, as described previously. For IPGTTs, mice were fasted for 6 h and injected IP with glucose solution at 2.0 g/kg body weight.22 For ITTs, mice were fasted for 4 h and insulin was administered IP at 1 U/kg body weight. The plasma glucose level was measured at 0, 15, 30, 60, and 120 min after injection.
Assays of Blood Biochemical Parameters and Serum Insulin and Adiponectin Levels
At the end of 5 weeks after adenovirus particles injection, mice were fasted for 12 h. Blood samples were obtained, allowed to stand at room temperature for 30 min, and centrifuged at 3000 rpm for 10 min at 4°C to obtain serum. The total cholesterol (TC), triglyceride (TG), low-density lipoprotein cholesterol (LDL-c), high-density lipoprotein cholesterol (HDL-c), and free fatty acid (FFA) levels were determined using an automatic analyzer (Hitachi 7020, Japan). The non-HDL-c level was calculated as: non-HDL-c = TC – (HDL-c). The plasma adiponectin level was measured using an enzyme-linked immunosorbent assay kit (FT102, EZassay, China) according to the manufacturer’s protocol.
Histological Analysis of eWAT and Liver Tissue
The eWAT and liver tissue was weighed, fixed, and sectioned at 6 μm thickness. The sections were stained with hematoxylin and eosin (H&E) and inspected under a light microscope.
Measurement of Hepatic TG and TC Levels
Hepatic TG and TC levels were measured in frozen liver samples (100 mg). Tissue was mixed with 1 mL of phosphate-buffered saline (PBS) and homogenized at 2500 rpm. The supernatant was assayed using a TG and TC kit (Nanjing JianCheng, China) according to the manufacturer’s protocol.
Assay of Mitochondrial Function
Mitochondria were assayed in terms of DNA copy number, Mito-tracker staining, and ATP production. For Mito-tracker staining, 3T3-L1 preadipocytes were incubated in Mito-tracker Red CMXRos solution (final concentration, 25 nM) for 30 min. The cells were visualized under an inverted fluorescence microscope (Zeiss, Germany). The eWAT weighed to a certain weight and fully ground with liquid nitrogen. And pre-adipocytes were collected by trypsin digestion. Then, the eWAT and the pre-adipocytes of total DNA was isolated according to the manufacturer’s protocol (QIAamp DNA Mini Kit, Qiagen, Germany). The qRT-PCR was performed to measure the mitochondrial DNA (mtDNA) copy number by assessing the ratio of mitochondrial to nuclear DNA. The ATP concentration was measured using an ATP Assay Kit (Beyotime Biotechnology, China).
Measurement of the Mitochondrial Oxygen Consumption Rate
The oxygen consumption rate (OCR) of 3T3-L1 pre-adipocytes was measured using a Seahorse Bioscience XF-96 extracellular flux analyzer (Seahorse Bioscience, Billerica, MA, USA), as detailed previously.23,24
Transmission Electron Microscopy (TEM)
3T3-L1 pre-adipocytes (3 × 10⁶) were digested with trypsin, centrifuged at 1000 rpm for 5 min. After washing with PBS, the cells were fixed in 2.5% glutaraldehyde at 4°C for 4 h and post-fixed in 1% osmic acid at room temperature for 1 h. The samples were dehydrated in increasing concentrations of ethanol for 15 min and transferred to absolute acetone for 20 min. After placing in a 1:1 mixture of absolute acetone and embedding agent for 2 h at room temperature, the samples were cut into 70 nm sections using a microtome. Finally, the cellular ultrastructure was visualized by transmission electron microscopy (FEI TecnaiT10).
Quantitative Real-Time PCR
Total RNA was extracted using RNAiso Plus (TaKaRa) according to the manufacturer’s instructions. Total RNA (1 μg) was reversed-transcribed using the First-Chain cDNA Synthesis Kit (TaKaRa). Real-time PCR was carried out on a Roche LightCycler 480 PCR System using SYBR Green Master Mix and gene-specific primers. The 2−ΔΔCT method was used to analyze relative changes in gene expression normalized to b-actin as the internal control.
Western Blotting
Total protein was isolated from eWAT in lysis buffer for 30 min at 4°C. Protein concentrations were measured using BCA Protein Assay Reagent (P0011, Beyotime Biotechnology, China). Proteins were transferred to a polyvinylidene difluoride membrane, blocked with 5% nonfat dry milk in PBS with 0.02% (v/v) Tween-20, and incubated with the primary antibodies at 4°C overnight. Next, the membrane was washed and incubated for 1 h at room temperature with a peroxidase-labeled secondary antibody. After washing, protein bands were visualized by electrochemiluminescence (FD8030, FDBio Science, China). The anti-mitochondrial oxidative complex cocktail antibody (ab110413, 1:200 dilution) and anti-hnRNPA1 antibody (sc365486) were obtained from Abcam (Cambridge, UK) and Santa Cruz (USA), respectively. The mouse anti-b-actin antibody (A5441) was purchased from Sigma-Aldrich (St. Louis, MO, USA).
RNA Pulldown Assay
RNA pulldown was performed as described previously.25 The RNA-protein complexes were eluted, resolved by sodium dodecyl sulfate-polyacrylamide gel electrophoresis, and stained with Silver Stain Plus (P0017S, Beyotime Biotechnology, China). Bands specifically pulled down by biotinylated Blnc1 were excised from the gel, digested.
RNA Immunoprecipitation
RNA immunoprecipitation (RIP) was performed with a RIP kit (Millipore, USA) as described previously.26 For endogenous RIP assay, anti-hnRNPA1 antibody (sc365486, Santa Cruz, USA) or normal mouse IgG was incubated with magnetic beads for 30 min at room temperature, total cell lysate was added, and the samples were incubated at 4°C overnight. RNA was extracted, purified using an organic solvent, and assayed by qRT-PCR using mBlnc1 primers (forward, 5ʹ-CAAGGAAGTCATGAGCCCAATG-3ʹ and reverse, 5ʹ-TAAAGGCTTCAACGGTGGCTG-3ʹ).
ChIP Assay
ChIP assay was performed using Simple ChIPTM Enzymatic Chromatin IP Kit (Magnetic Beads) (Cell Signaling Technology, USA) as previously reported.27 In brief, 3T3-L1 pre-adipocytes were cross-link with 1% formaldehyde for 10 min, which was then stopped by incubation with 10 X glycine at room temperature for 5 min. The cell suspension was incubated by Micrococcal nuclease in order to digest the DNA chains into small fragments and sonicated to break the nuclei. The DNA fragments were then incubated with rabbit monoclonal antibody to rabbit polyclonal antibodies to hnRNPA1 (sc365486, Santa Cruz Biotechnology, USA), or control rabbit IgG 4 h to overnight for immunoprecipitation. Chromatin association was measured using qPCR, the forward and reverse primers were: 5ʹ- CAAGGTACAAGGGAGGCTGAGAC −3ʹ and 5ʹ- CCCATTGGCCTCCCTTTTCTT −3ʹ for mouse Pgc1β promoter.
Statistical Analysis
Data are expressed as means ± standard error of the mean. Statistical analysis was conducted with SPSS version 20.0 software, using one-way analysis of variance (ANOVA) for multiple group comparisons or Student’s t-test for two-group comparisons. A value of P < 0.05 was taken to indicate statistical significance.
Results
Overexpression of lncRNA-Blnc1 in eWAT Ameliorates Obesity-Induced Insulin Resistance
To assess the role of Blnc1 in eWAT in metabolic health, adenovirus particles carrying Blnc1 were multi-point-injected into eWAT on both sides of HFD-induced obese mice. The qRT-PCR and in vivo imaging showed that Blnc1 was overexpressed in eWAT of HFD-Ad-Blnc1-treated mice (Figure 1A and B). Overexpression of Blnc1 tended to decrease the rate of increase in body weight (Figure S1A) and the gross eWAT mass (Figure 1C) in HFD-induced obese mice. The expression of Blnc1 was slightly upregulated in BAT but was not significantly changed in ingWAT of HFD-Ad-Blnc1 mice (Figure S1B and C), and the other three adipose tissues were unchanged (Figure S1D and F). The blood glucose level was similar in HFD-Ad-Blnc1 mice (Figure 1D). Surprisingly, HFD-Ad-Blnc1 mice exhibited a significant increase in the plasma adiponectin concentration (Figure 1E), which is closely related to insulin resistance and crosstalk between WAT and the liver. Furthermore, IPGTTs and ITTs revealed that overexpression of Blnc1 ameliorated obesity-induced glucose tolerance and insulin sensitivity (Figure 1F1, F2, G1, G2).
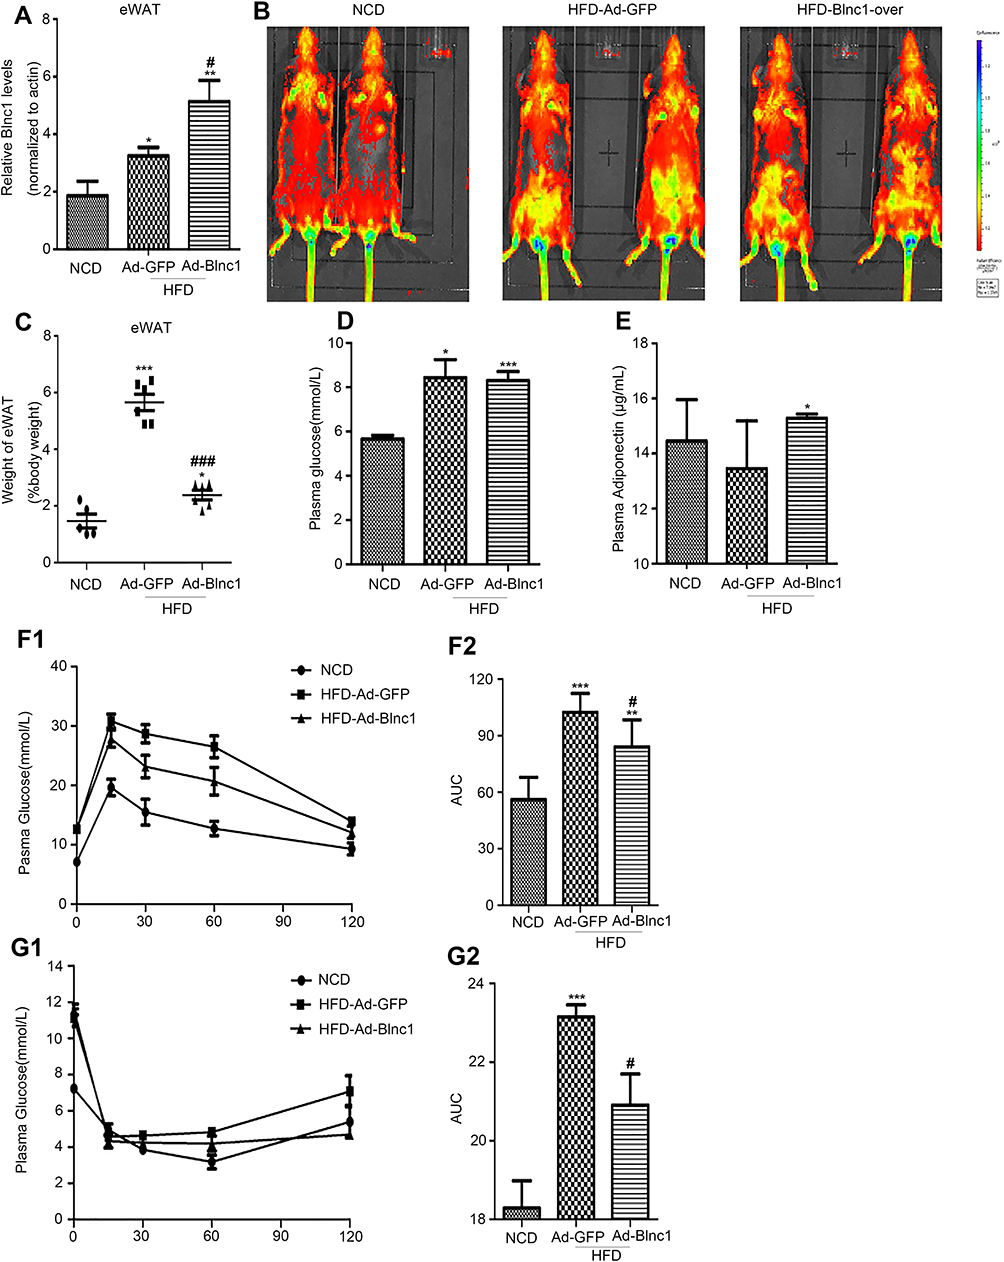 |
Figure 1 (A) Blnc1 expression in eWAT following infection with Ad-GFP or Ad-Blnc1 adenovirus; (B) tissue distribution of GFP expression; (C) eWAT/body weight (%); (D) blood glucose level; (E) plasma adiponectin concentration; (F1, F2) IPGTTs and AUC of plasma glucose; (G1, G2) ITT and AUC of plasma glucose, IPGTT and ITT were measured in mice fed a HFD for 17 weeks. *p < 0.05, **p < 0.01, ***p < 0.001, NCD vs. HFD-Ad-GFP groups; #p < 0.05, ###p < 0.001, HFD-Ad-GFP vs. HFD-Ad-Blnc1 groups (n = 5). |
Meanwhile, Blnc1 activation in eWAT had a slight impact on dyslipidemia in HFD-induced obese mice. Consistent with HFD feeding, the plasma TC and non-HDL-c levels were significantly lower in HFD-Ad-Blnc1 mice (Figure S2A and B). However, the plasma TG, FFA, LDL-c, and HDL-c concentrations were not significantly different between HFD-Ad-GFP and HFD-Ad-Blnc1 mice (Figure S2C–F).
The eWAT-Specific Overexpression of Blnc1 Alleviates the Hepatic Damage Induced by HFD
We next determined whether eWAT-specific activation of Blnc1 influenced HFD-induced hepatic steatosis. The liver mass had a slight difference between HFD-Ad-GFP and HFD-Ad-Blnc1 groups (Figure 2A). However, H&E staining showed that hepatocytes of HFD-Ad-GFP group contained more lipid droplets and exhibited more ballooning-induced degeneration than those of the NCD group (Figure 2B). The eWAT-specific activation of Blnc1 alleviated HFD-induced pathological hepatic steatosis (Figure 2B). The hepatic triglyceride content was significantly reduced in HFD-Ad-Blnc1 mice (Figure 2C), whereas the hepatic TC content was not different between HFD-Ad-GFP and HFD-Ad-Blnc1 groups (Figure 2D). The hepatic mRNA levels of genes in adiponectin-related pathway—AdipoR2, APPL1, and PPARα were increased in the liver of HFD-Ad-Blnc1 mice (Figure 2E). Furthermore, the hepatic mRNA levels of key genes in fatty-acid oxidation—CPT1α, Acadl, Aox, and Ehhadh—were significantly upregulated (Figure 2F).
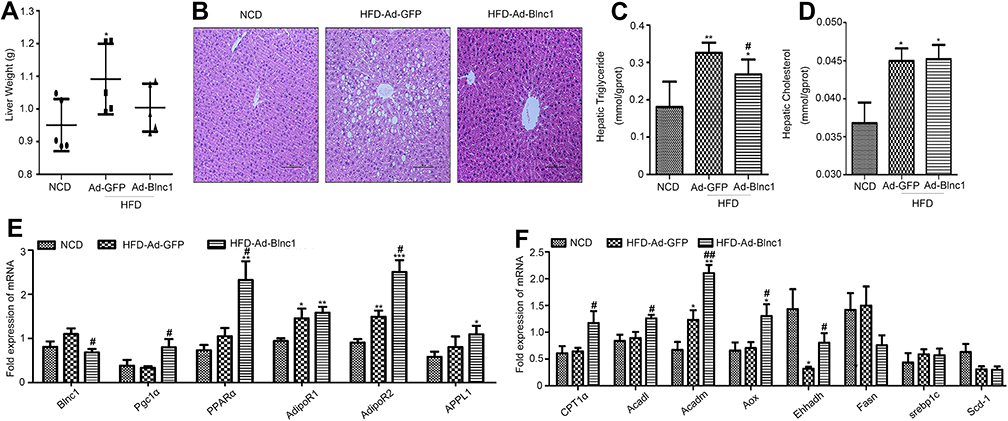 |
Figure 2 (A) Liver weight (g); (B) H&E staining of liver sections (scale bar = 100 μm); (C, F, D) hepatic triglyceride level; (D) hepatic total cholesterol level; and (E, F) hepatic gene expression by qRT-PCR. *p < 0.05, **p < 0.01, ***p < 0.001, NCD vs. HFD-Ad-GFP groups; #p < 0.05, ##p < 0.01, HFD-Ad-GFP vs. HFD-Ad-Blnc1 groups (n = 5). |
Overexpression of Blnc1 Reverses Mitochondrial Dysfunction in Obese Mice
To clarify the mechanism by which overexpression of Blnc1 in eWAT resulted in improvement of systemic metabolic homeostasis, we investigated the structure and function of eWAT. H&E staining suggested that Blnc1 overexpression decreased the size of adipocytes compared with those of HFD-Ad-GFP mice (Figure 3A1, upper). Mitochondrial mass was markedly induced by Blnc1 overexpression in eWAT, as determined by increased Mito-tracker staining and mtDNA content (Figure 3A1 lower, A2, B). Mitochondrial protein complexes (I–V) of the electron transport chain (ETC) mediate oxidative phosphorylation. The expression of genes related to mitochondrial biosynthesis and function (Pgc1α, Pgc1β, adiponectin and ETC complexes) was increased in eWAT of HFD-Ad-Blnc1 mice (Figure 3C1, Figure 3C2–E).
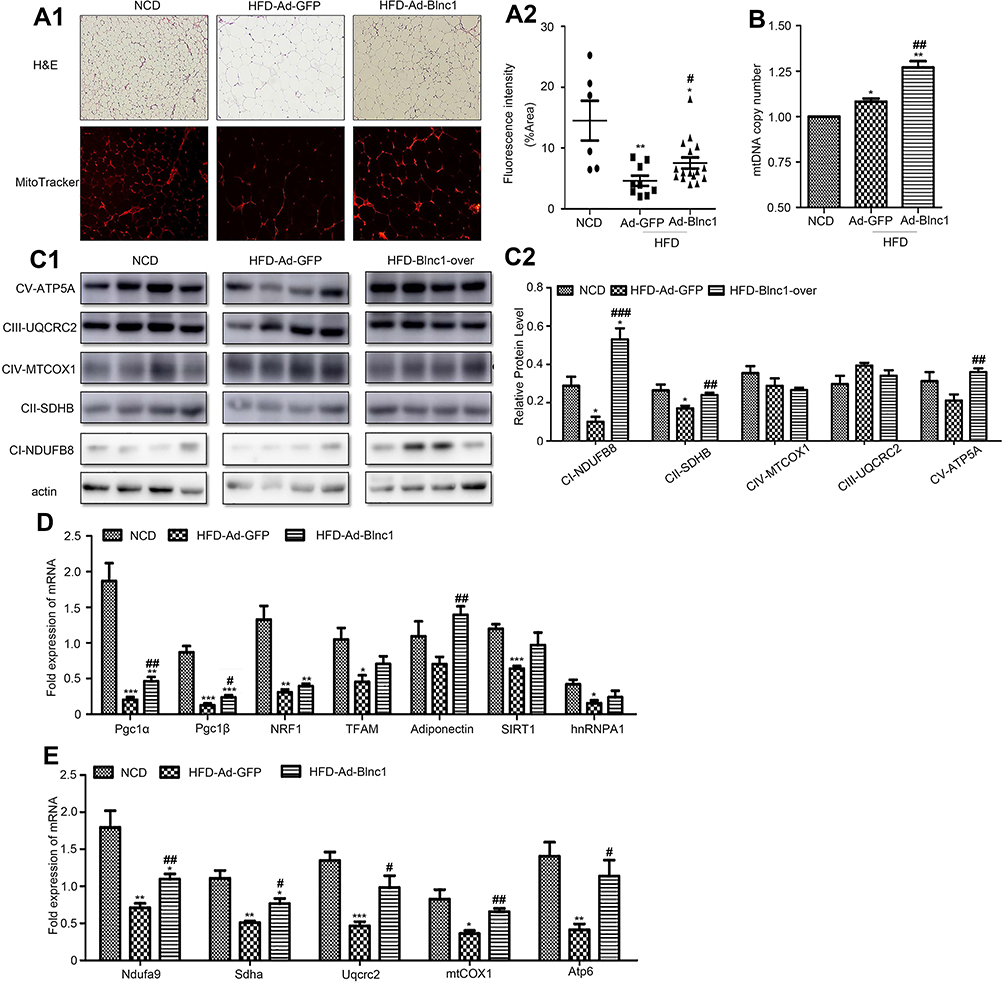 |
Figure 3 (A1) H&E staining (upper) and mitochondrial staining (Mito-tracker) (lower), 200.; (A2) fluorescence intensity (%); (B) mtDNA content; (C1) protein levels of ETC complexes (ATP5A, UQCRC2, MTCOX1, SDHB, and NDUFB8) and (C2) its semi-quantitative analysis(n = 4); and (D, E) eWAT gene expression by qRT-PCR. *p < 0.05, **p < 0.01, ***p < 0.001, NCD vs. HFD-Ad-GFP groups; #p < 0.05, ##p < 0.01, ###p < 0.001, HFD-Ad-GFP vs. HFD-Ad-Blnc1 groups (n = 5). |
Role of Blnc1 in Mitochondrial Biogenesis and Function in Pre-Adipocytes
Blnc1 overexpression in vivo suggested that Blnc1 of eWAT plays an important role in metabolic homeostasis. Accordingly, the improvement of metabolic health is dependent on WAT mitochondria and its remodeling. To test this hypothesis, we analyzed mitochondrial biogenesis and function in 3T3-L1 pre-adipocytes with Blnc1 overexpression or knockdown.
The mtDNA content was significantly increased in Blnc1-overexpressing pre-adipocytes (Figure 4A and B). Consistently, Blnc1 activation upregulated the expression of mitochondrial biogenesis-related genes, including Pgc1β, NRF1, hnRNPA1 and adiponectin (Figure 4C). Furthermore, the mRNA levels of ETC complexes were increased by Blnc1 overexpression (Figure 4D). To examine whether Blnc1 affected mitochondrial function in pre-adipocytes, we assayed the ATP level and OCR assay in Blnc1-overexpressing cells. The Blnc1- overexpressing pre-adipocytes presented a higher ATP level (Figure 4E) and OCR (Figure 4F), particularly in maximal and spare respiration capacity (Figure 4G–I).
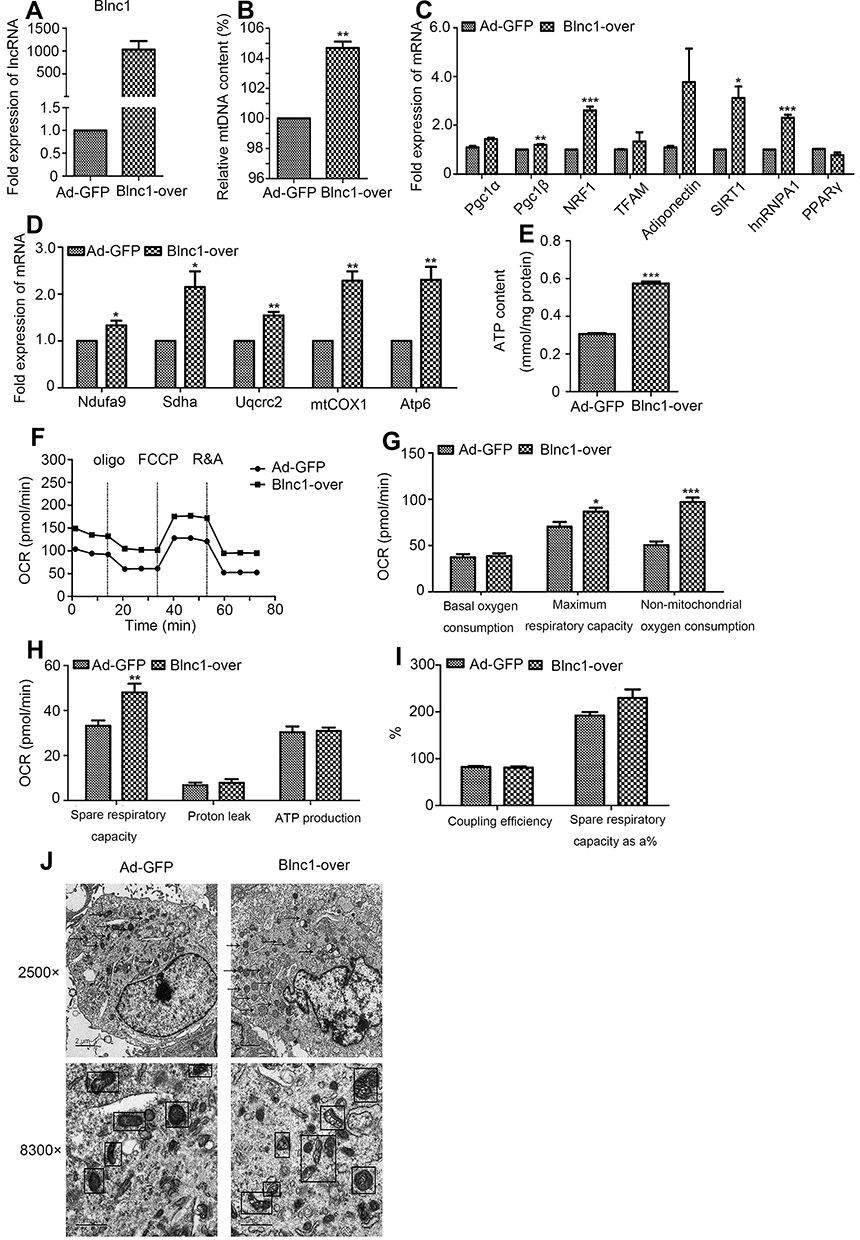 |
Figure 4 (A) mRNA level of Blnc1 following treatment with Ad-GFP or Ad-Blnc1 adenovirus; (B) mtDNA content of 3T3-L1 pre-adipocytes; (C, D) expression of genes related to mitochondrial biogenesis and function by qRT-PCR; (E) ATP content; and (F – I) OCR. Dotted lines indicate injection of the respiratory inhibitors oligomycin (Oligo), FCCP, and rotenone and antimycin (R&A). (J) Representative TEM images of the mitochondrial ultrastructure of Ad-GFP and Blnc1-overpressing cells. Arrows and squares indicate mitochondria. Scale bars = 2, 1 μm. *p < 0.05, **p < 0.01, ***p < 0.001, Ad-GFP vs. Blnc1-over groups. |
TEM at magnifications of 2500× and 8300× showed that Blnc1-overexpressing cells had a greater number of mitochondria, which were elongated and exhibited an increased number of cristae and increased matrix electron density, compared to Ad-GFP cells (Figure 4J).
Blnc1 knockdown markedly decreased the mtDNA content (Figure S3A and B) and downregulated the expression of genes involved in mitochondrial biogenesis (Figure S3C). Moreover, the expression of genes encoding the mitochondrial ETC complexes was decreased in the Blnc1-KD group (Figure S3D). Also, the Blnc1-knockdown pre-adipocytes exhibited a lower ATP content (Figure S3E). Assay of the OCR (Figure S3F–I) and the expression of ETC complexes (Figure S3D) showed that Blnc1 knockdown restored oxygen consumption. By TEM, structural enlargement of the mitochondrial matrix and deformation of cristae were observed in Blnc1-KD compared with KD-NC cells (Figure S3J). Therefore, Blnc1 is involved in the regulation of mitochondrial biogenesis and function in 3T3-L1 pre-adipocytes.
hnRNPA1 Is the Binding Partner of Blnc1 in 3T3-L1 Pre-Adipocytes
RNA pulldown assay was performed to identify the potential mechanism in 3T3-L1 pre-adipocytes. The results of silver-stained gel and Western blotting revealed that Blnc1 interacted with hnRNPA1 in pre-adipocytes (Figure 5A and B). RIP using antibody against hnRNPA1 was performed, indicating that Blnc1 was enriched combined with hnRNPA1 comparing with IgG (Figure 5C).
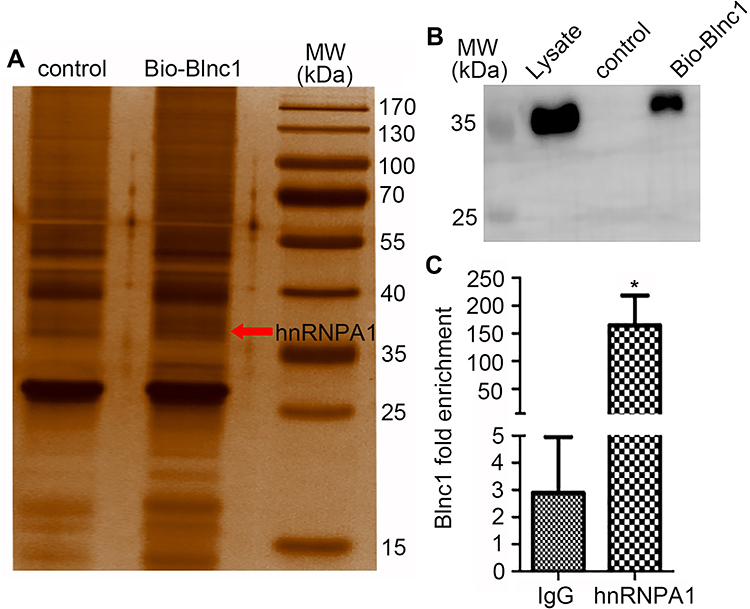 |
Figure 5 Silver-stained gel (A) and western blot (B) analysis of 3T3-L1 pre-adipocyte lysate incubated with control and biotinylated Blnc1 samples, which were from the RNA pull down experiment, red arrow indicates Bio-Blnc1 band and molecular weight of hnRNPA1, western blot analysis using the anti-hnRNPA1 antibody; (C) RIP was measured using antibody hnRNPA1 comparing with IgG; *p < 0.05, IgG vs. hnRNPA1 groups. |
Blnc1 Facilitates Pgc1β Transcription via Decoying hnRNPA1 in 3T3-L1 Pre-Adipocytes
Furthermore, data of qRT-PCR illustrated that Pgc1β mRNA level was dramatically increased in the Blnc1-overexpression of eWAT and 3T3-L1 pre-adipocytes (Figures 3D and 4D). To accurately confirm whether Blnc1 activated the Pgc1β expression, ChIP of hnRNPA1 protein, followed by qRT-PCR analysis, revealed substantial enrichment of the Pgc1β promoter element in pre-adipocytes (Figure 6A). Moreover, this enrichment was decreased in Blnc1-over 3T3-L1 pre-adipocytes (Figure 6B). And the mRNA expression of Pgc1β was downregulated in pre-adipocytes of overexpression hnRNPA1 (Figure 6C and D). Taken together, these findings indicated that Blnc1 activates Pgc1β transcription through decoying hnRNPA1 (Figure 6E1 and E2).
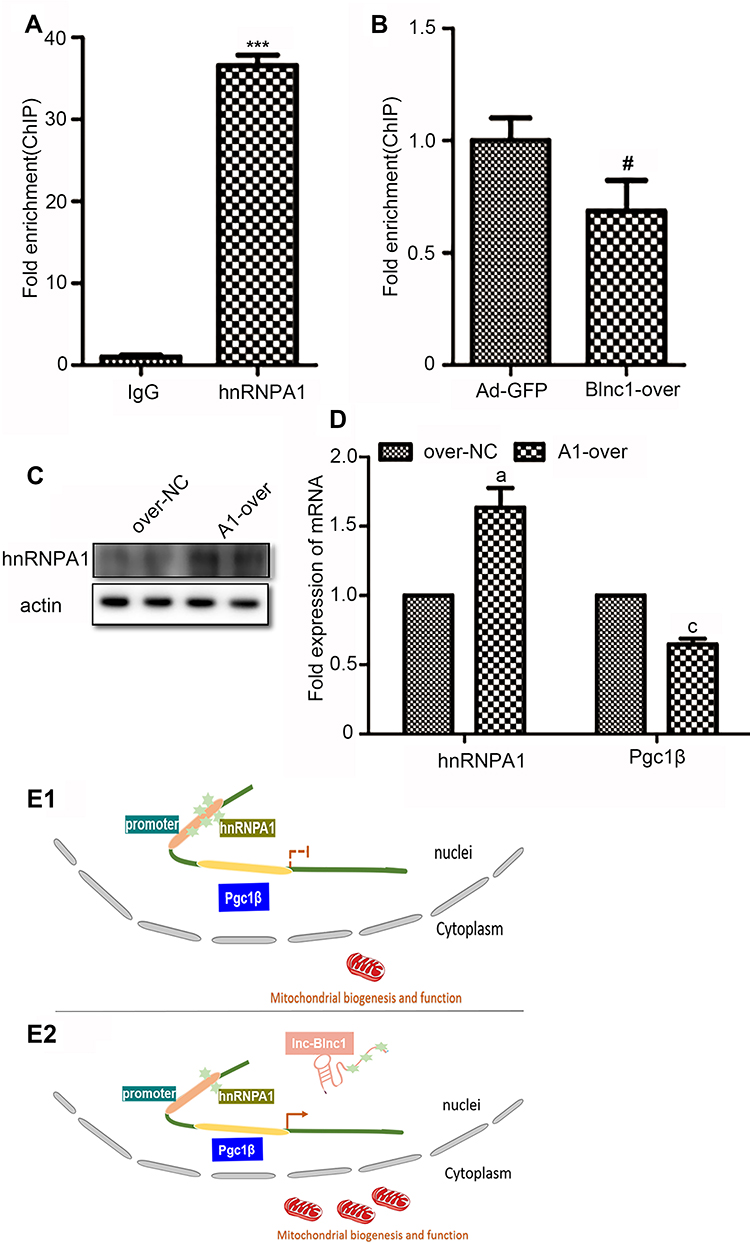 |
Figure 6 (A) ChIP assay was performed to validate the binding with hnRNPA1 at the promoter of Pgc1; (B) ChIP-qPCR analysis of hnRNPA1 in Ad-GFP and Blnc1-over cells; (C)Western blot analysis of pre-adipocytes overexpression hnRNPA1; (D) The mRNA expression of hnRNPA1 and Pgc1β; (E1, E2) Proposed model for the Blnc1 mediated enhancement of Pgc1 transcription. ***p < 0.001, IgG vs. hnRNPA1 groups; #p < 0.05, Ad-GFP vs. Blnc1-over groups; ap < 0.05, cp < 0.01, over-nc vs. A1-over groups. |
Discussion
Collectively, our results indicated that eWAT-specific overexpression of Blnc1 ameliorated obesity-induced insulin resistance, partially attenuated systemic dyslipidemia, and markedly improved hepatic steatosis. These results suggested that Blnc1 activation in eWAT may protect against diet-induced obesity by remodeling mitochondrial biogenesis and function in WAT.
While the body weight of HFD-Ad-GFP and HFD-Ad-Blnc1 mice was similar (Figure S1A), the eWAT mass was significantly lower in HFD-Ad-Blnc1 mice (Figure 1C). Moreover, H&E staining of eWAT and hepatic tissue revealed that cell size and fat accumulation were decreased in HFD-Ad-Blnc1 mice (Figure 3A1 and 2B). However, our findings on the weight and morphology of eWAT were not consistent with a previous report, in which eWAT mass was significantly larger in Tg-fat-Blnc1 mice after HFD feeding for 3 months.7 The following may explain the differences. First, different methods were used to overexpress Blnc1 in the target tissue. Second, in the prior study, the HFD feeding was started after Tg-Blnc1 injection and continued for 3 months; here, we injected Ad-Blnc1 adenovirus into obese mice after 12 weeks of HFD feeding.
In our study, obesity-induced hepatic steatosis was significantly attenuated in the HFD-Ad-Blnc1 mice (Figure 2). On this basis, we hypothesized crosstalk between eWAT and the liver. The eWAT-specific overexpression of Blnc1 increased the plasma adiponectin level (Figure 1E). To assess the effect on the liver, we assayed the expression of components of the hepatic AdipoR2/PPARa signaling pathway.28 The mRNA levels of AdipoR2, APPL1, PPARa, CPT1a, Acadl, Aox, and Ehhadh were significantly upregulated (Figure 2E and F). Thus, amelioration of obesity-induced hepatic damage was likely related to activation of adiponectin-mediated fatty acid oxidation.
Then, IPGTT and ITT results in this study indicated that eWAT-specific activation of Blnc1 improved systemic insulin resistance (Figure 1F and G). Among the serum lipid parameters, only the plasma TC and non-HDL-c concentrations were significantly decreased (Figure S2A and B). The different effects between glucose and lipid metabolism were likely to relate to the way that Ad-Blnc1 adenovirus infected mice by multi-point injection in eWAT. The method of overexpression of adenovirus limited the higher expression of Blnc1.
A variety of functions have been attributed to mitochondria, including cytosolic processes, the urea cycle and regulation of a variety of cell signaling pathways.9 Knockdown of Blnc1 in the 3T3-L1 pre-adipocytes reduced the mtDNA copy number (Figure S3B), which was accompanied by decreased expression of mitochondria-related genes (Figure S3C and D); Blnc1 overexpression exerted the opposite effects. Moreover, the changes in the OCR (Figure S3F–I) suggested that Blnc1 is required for mitochondrial biogenesis and function.
The potential mechanism of lncRNAs are dependent on the subcellular localization. In general, nuclear localized lncRNAs act their regulatory roles through the formation of functional lncRNA-protein complexes.29 Previous study reported that lncRNA-Blnc1 is primarily located in the nucleus,5 and requires hnRNPU for induction of the thermogenic program.30 The hnRNPs, a large family of RNA-binding proteins, are composed of at least 20 abundant.31 They control and regulate the multiple aspects of nucleic acid metabolism.16 Our data of RIP and ChIP assay (Figures 5C and 6) revealed that Blnc1 decoyed hnRNPA1 from the promoter of Pgc1β to activate its expression. However, the specific mechanism underlying this interaction is unclear.
Conclusion
In summary, specific overexpression of Blnc1 in eWAT improved hepatic lipid accumulation, whole body insulin sensitivity and glucose metabolism, likely by enhancing mitochondrial biogenesis and function in eWAT.
Abbreviations
lncRNA, long non-coding RNAs; Blnc1, brown fat lncRNA-1; HFD, High-fat diet; eWAT, epididymal white adipose tissue; prWAT, perirenal white adipose tissue; ingWAT, inguinal subcutaneous adipose tissue; BAT, brown fat tissue; NAFLD, non-alcoholic fatty liver disease; hnRNP, heterogeneous nuclear ribonucleoprotein; ERRα, estrogen-related receptor-α; IPGTT, intraperitoneal injection glucose tolerance test; ITT, insulin tolerance test; IP, intraperitoneal injection; TC, total cholesterol; TG, triglyceride; HDL-c, high-density lipoprotein cholesterol; LDL-c, low-density lipoprotein cholesterol; nonHDL-c, non-high-density lipoprotein cholesterol; H&E, hematoxylin and eosin; PBS, phosphate buffer saline; OCR, oxygen consumption rate; qRT-PCR, quantitative real-time PCR; RIP, RNA immunoprecipitation; ChIP, chromatin immunoprecipitation; CPT-1, carnitine palmitoyltransferase-1; Acadl, acyl-coenzyme A dehydrogenase, long chain; Acadm, acyl-coenzyme A dehydrogenase; Aox, Acyl-CoA oxidase; Ehhadh, enoyl-CoA, hydratase/3-hydroxyacyl CoA dehydrogenase; AdipoR2, adiponectin receptor 2; APPL1, adaptor protein, phosphotyrosine interaction, PH domain and leucine zipper containing 1; PGC1, peroxisome proliferator-activated receptor gamma coactivator 1; PPARα, peroxisome proliferator-activated receptor α; ETC, electron transport chain; NRF1, nuclear respiratory factor 1; Oligo, oligomycin; FCCP, carbonyl cyanide 4-(trifluoromethoxy) phenylhydrazone; R&A, rotenone & antimycin; TEM, transmission electron microscopy.
Ethics and Consent Statement
All Institutional and National Guidelines for the care and use of animals were followed.
Acknowledgments
We are deeply indebted to the Center for Cryo-Electron Microscopy of Zhejiang University for their assistance with TEM. The abstract of this paper was presented at the Conference name 55th Annual Meeting of the European-Association-for-the-study-of-Diabetes (EASD) as a conference talk with interim findings. The poster’s abstract was published in “Poster Abstracts” in the Journal name Diabetologia. 2019. 62: p. S105–S106.
Funding
This work was supported by the National Natural Science Foundation of China (grant number: 81873653) and the Zhejiang Provincial Medical Science and Technology Program (grant number: 2018KY484).
Disclosure
The authors have declared no conflicts of interest in this work.
References
1. Lee SJ, Shin SW. Mechanisms, pathophysiology, and management of obesity. N Engl J Med. 2017;376(15):1491–1492.
2. WHO. Obesity and overweight 2018; [
3. Li P, Chen X, Chang X, Tang T, Qi K. A preliminary study on the differential expression of long noncoding RNAs and messenger RNAs in obese and control mice. J Cell Biochem. 2020;121(2):1126–1143.
4. Knoll M, Lodish HF, Sun L. Long non-coding RNAs as regulators of the endocrine system. Nat Rev Endocrinol. 2015;11(3):151–160. doi:10.1038/nrendo.2014.229
5. Zhao XY, Li S, Wang GX, Yu Q, Lin JD. A long noncoding RNA transcriptional regulatory circuit drives thermogenic adipocyte differentiation. Mol Cell. 2014;55(3):372–382. doi:10.1016/j.molcel.2014.06.004
6. Li S, Mi L, Yu L, et al. Zbtb7b engages the long noncoding RNA Blnc1 to drive brown and beige fat development and thermogenesis. Proc Natl Acad Sci U S A. 2017;114(34):E7111–E7120. doi:10.1073/pnas.1703494114
7. Zhao XY, Li S, DelProposto JL, et al. The long noncoding RNA Blnc1 orchestrates homeostatic adipose tissue remodeling to preserve metabolic health. Mol Metab. 2018;14:60–70. doi:10.1016/j.molmet.2018.06.005
8. Zhao XY, Xiong X, Liu T, et al. Long noncoding RNA licensing of obesity-linked hepatic lipogenesis and NAFLD pathogenesis. Nat Commun. 2018;9(1):2986. doi:10.1038/s41467-018-05383-2
9. De Pauw A, Tejerina S, Raes M, Keijer J, Arnould T. Mitochondrial (dys)function in adipocyte (de)differentiation and systemic metabolic alterations. Am J Pathol. 2009;175(3):927–939. doi:10.2353/ajpath.2009.081155
10. Tormos KV, Anso E, Hamanaka RB, et al. Mitochondrial complex III ROS regulate adipocyte differentiation. Cell Metab. 2011;14(4):537–544. doi:10.1016/j.cmet.2011.08.007
11. Huh JY, Kim Y, Jeong J, et al. Peroxiredoxin 3 is a key molecule regulating adipocyte oxidative stress, mitochondrial biogenesis, and adipokine expression. Antioxid Redox Sign. 2012;16(3):229–243. doi:10.1089/ars.2010.3766
12. Patti ME, Corvera S. The role of mitochondria in the pathogenesis of type 2 diabetes. Endocr Rev. 2010;31(3):364–395. doi:10.1210/er.2009-0027
13. Mouchiroud L, Eichner LJ, Shaw RJ, Auwerx J. Transcriptional coregulators: fine-tuning metabolism. Cell Metab. 2014;20(1):26–40. doi:10.1016/j.cmet.2014.03.027
14. Huss JM, Torra IP, Staels B, Giguere V, Kelly DP. Estrogen-related receptor alpha directs peroxisome proliferator-activated receptor alpha signaling in the transcriptional control of energy metabolism in cardiac and skeletal muscle. Mol Cell Biol. 2004;24(20):9079–9091. doi:10.1128/MCB.24.20.9079-9091.2004
15. Finck BN, Kelly DP. PGC-1 coactivators: inducible regulators of energy metabolism in health and disease. J Clin Invest. 2006;116(3):615–622. doi:10.1172/JCI27794
16. Sun X, Haider Ali MSS, Moran M. The role of interactions of long non-coding RNAs and heterogeneous nuclear ribonucleoproteins in regulating cellular functions. Biochem J. 2017;474(17):2925–2935. doi:10.1042/BCJ20170280
17. Dreyfuss G, Philipson L, Mattaj IW. Ribonucleoprotein particles in cellular processes. J Cell Biol. 1988;106(5):1419–1425. doi:10.1083/jcb.106.5.1419
18. Jean-Philippe J, Paz S, Caputi M. hnRNP A1: the Swiss army knife of gene expression. Int J Mol Sci. 2013;14(9):18999–19024. doi:10.3390/ijms140918999
19. Guil S, Long JC, Caceres JF. hnRNP A1 relocalization to the stress granules reflects a role in the stress response. Mol Cell Biol. 2006;26(15):5744–5758. doi:10.1128/MCB.00224-06
20. Roy R, Durie D, Li H, et al. hnRNPA1 couples nuclear export and translation of specific mRNAs downstream of FGF-2/S6K2 signalling. Nucleic Acids Res. 2014;42(20):12483–12497. doi:10.1093/nar/gku953
21. Xiong Y, Yue F, Jia ZH, et al. A novel brown adipocyte-enriched long non-coding RNA that is required for brown adipocyte differentiation and sufficient to drive thermogenic gene program in white adipocytes. Bba Mol Cell Biol L. 2018;1863(4):409–419. doi:10.1016/j.bbalip.2018.01.008
22. Andrikopoulos S, Blair AR, Deluca N, Fam BC, Proietto J. Evaluating the glucose tolerance test in mice. Am J Physiol Endocrinol Metab. 2008;295(6):E1323–E1332. doi:10.1152/ajpendo.90617.2008
23. Gong S, Peng Y, Jiang P, et al. A deafness-associated tRNAHis mutation alters the mitochondrial function, ROS production and membrane potential. Nucleic Acids Res. 2014;42(12):8039–8048. doi:10.1093/nar/gku466
24. Yau WW, Singh BK, Lesmana R, et al. Thyroid hormone (T3) stimulates brown adipose tissue activation via mitochondrial biogenesis and MTOR-mediated mitophagy. Autophagy. 2019;15(1):131–150. doi:10.1080/15548627.2018.1511263
25. Rinn JL, Kertesz M, Wang JK, et al. Functional demarcation of active and silent chromatin domains in human HOX loci by noncoding RNAs. Cell. 2007;129(7):1311–1323. doi:10.1016/j.cell.2007.05.022
26. Kallen AN, Zhou XB, Xu J, et al. The imprinted H19 lncRNA antagonizes let-7 microRNAs. Mol Cell. 2013;52(1):101–112. doi:10.1016/j.molcel.2013.08.027
27. Pu J, Wang J, Wei H, et al. lncRNA MAGI2-AS3 prevents the development of HCC via recruiting KDM1A and promoting H3K4me2 demethylation of the RACGAP1 promoter. Mol Ther Nucleic Acids. 2019;18:351–362. doi:10.1016/j.omtn.2019.08.020
28. Ahmad A, Ali T, Kim MW, et al. Adiponectin homolog novel osmotin protects obesity/diabetes-induced NAFLD by upregulating AdipoRs/PPARalpha signaling in ob/ob and db/db transgenic mouse models. Metabolism. 2019;90:31–43. doi:10.1016/j.metabol.2018.10.004
29. Chen LL. Linking long noncoding RNA localization and function. Trends Biochem Sci. 2016;41(9):761–772. doi:10.1016/j.tibs.2016.07.003
30. Mi L, Zhao XY, Li S, Yang G, Lin JD. Conserved function of the long noncoding RNA Blnc1 in brown adipocyte differentiation. Mol Metab. 2017;6(1):101–110. doi:10.1016/j.molmet.2016.10.010
31. Dreyfuss G, Matunis MJ, Pinol-Roma S, Burd CG. hnRNP proteins and the biogenesis of mRNA. Annu Rev Biochem. 1993;62(1):289–321. doi:10.1146/annurev.bi.62.070193.001445
 © 2020 The Author(s). This work is published and licensed by Dove Medical Press Limited. The
full terms of this license are available at https://www.dovepress.com/terms
and incorporate the Creative Commons Attribution
- Non Commercial (unported, 3.0) License.
By accessing the work you hereby accept the Terms. Non-commercial uses of the work are permitted
without any further permission from Dove Medical Press Limited, provided the work is properly
attributed. For permission for commercial use of this work, please see paragraphs 4.2 and 5 of our Terms.
© 2020 The Author(s). This work is published and licensed by Dove Medical Press Limited. The
full terms of this license are available at https://www.dovepress.com/terms
and incorporate the Creative Commons Attribution
- Non Commercial (unported, 3.0) License.
By accessing the work you hereby accept the Terms. Non-commercial uses of the work are permitted
without any further permission from Dove Medical Press Limited, provided the work is properly
attributed. For permission for commercial use of this work, please see paragraphs 4.2 and 5 of our Terms.