Back to Journals » Clinical Ophthalmology » Volume 20
The Interpupillary Distance Differs Between Ethnicities and Associates with Horizontal Strabismus Patterns: Evidence from a Systematic Review and Meta-Analysis
Authors Zehra Z ![]() , Hagen MM, Wang L, Von Bartheld CS
, Hagen MM, Wang L, Von Bartheld CS ![]()
Received 18 January 2026
Accepted for publication 7 May 2026
Published 20 May 2026 Volume 2026:20 584478
DOI https://doi.org/10.2147/OPTH.S584478
Checked for plagiarism Yes
Review by Single anonymous peer review
Peer reviewer comments 3
Editor who approved publication: Dr Sotiria Palioura
Zainab Zehra,1– 3 Molly M Hagen,4 Lingchen Wang,4 Christopher S Von Bartheld1,5
1Department of Physiology and Cell Biology, University of Nevada, Reno School of Medicine, Reno, NV, USA; 2Department of Biosciences, COMSATS University, Islamabad, Pakistan; 3College of Optometry, University of Houston, Houston, TX, USA; 4School of Public Health, University of Nevada, Reno, NV, USA; 5Center of Biomedical Research Excellence in Cell Biology, University of Nevada, Reno School of Medicine, Reno, NV, USA
Correspondence: Christopher S Von Bartheld, Department of Physiology and Cell Biology, University of Nevada, Reno School of Medicine, Reno, NV, 89557-0352, USA, Email [email protected]
Purpose: The interpupillary distance is a measure of the width of the orbit and is important for spectacle design and proper head-mounted displays in virtual reality. Extreme interpupillary distances may predispose to horizontal strabismus. The interpupillary distance is thought to differ between ethnicities, but global data on this parameter have not been systematically explored, mapped and compared.
Methodology: We performed a systematic review that compiled 243 studies reporting the interpupillary distance and mapped the data geographically. We then compared the regional distribution of the mean interpupillary distance with the distribution of horizontal strabismus patterns. The strabismus data, obtained from our previous systematic review of the literature, were used to map the relative frequency of esotropia and exotropia according to 301 population-based studies. The mean interpupillary distance and esotropia/exotropia ratio of major ethnicities were then analyzed by meta-regression analyses to determine an association between the two parameters.
Results: Interpupillary distances are larger in Western Africa, South India, East Asia, in Latinos/Hispanics, in Native and African Americans, and they are smaller in Europe, North Africa, the Middle East, Northwestern India, and in Inuit populations. Regression analyses revealed an association between the interpupillary distance and the esotropia/exotropia ratio with R2 values of 0.322 (major ethnicities) and 0.409 (populations at higher resolution).
Conclusion: The mean interpupillary distance varies significantly between ethnicities. Orbital anatomical parameters contribute to diverse horizontal strabismus patterns. Our findings may aid in the design of appropriate spectacles and the optimal size of head-mounted displays, and help to better understand the pathogenesis of horizontal strabismus. A world map illustrates the distribution of inter-pupillary distance and its association with horizontal strabismus patterns. On the left, diagrams depict three types of inter-pupillary distances: narrow, intermediate and wide. The center text states ’Association with’. On the right, two diagrams show horizontal strabismus patterns: esotropia and exotropia. The map is marked with various colored spots indicating different data points across continents, based on a global study of these visual characteristics.Map showing inter-pupillary distance and horizontal strabismus patterns globally.
Keywords: prevalence, esotropia, exotropia, geography, mapping, virtual reality
Introduction
The interpupillary distance (IPD) is the distance between the centers of the right and left pupil and can be used as an approximate measure of the orbital width.1,2 The mean IPD differs between ethnicities, a notion that is based on a relatively small number of studies from select populations.3,4 Despite many studies reporting the mean IPD in cohorts, global data on this parameter have not been systematically explored, mapped and compared. Numerous studies from dental schools examined and reported the IPD because of the importance of this craniofacial parameter for proportionality of maxillary anterior teeth.5–8
The IPD is important for spectacle design9–11 and for suitable head-mounted displays in virtual reality.12–17 A mismatch between the user’s IPD and the IPD on the head-mounted display can cause discomfort.18 Inadequate ranges of such headsets are thought to be responsible for the female propensity to cybersickness.16 In fact, cybersickness seen in virtual reality is thought to be due, largely, to an improper orbital range of the headsets.16,18
Differences in the IPD have been proposed to explain ethnic differences in horizontal strabismus patterns.19,20 Recent studies provided evidence for surprisingly distinct and consistent ethnic differences in the prevalence and the patterns of horizontal strabismus, with some populations having much more esotropia than exotropia, while other populations have more exotropia than esotropia.21,22 Historically, the orbital anatomy, and especially the IPD, was suspected to play a role in strabismus, as first suggested in the 19th century.19,20,23–31 However, this line of research has not been pursued for over 80 years.22 A large number of population-based studies has now been conducted and published, both on the global distribution of the IPD,32 and on the global distribution of esotropia and exotropia.22 Such data make it possible to map these parameters across populations and to determine an association between them at the population level. Does the orbital width explain, in part, why horizontal strabismus patterns vary between different populations?
Our systematic review and meta-analysis compiles information about the IPD as a proxy of the orbital width. We mapped the mean IPD side-by-side with strabismus patterns in different populations based on studies from 61 countries throughout the world and examined whether a larger IPD is associated with a lower esotropia/exotropia ratio, as was previously hypothesized.19,20,30,33,34
Materials and Methods
To compile data on the orbital width, we conducted a systematic review of studies by searching Google Scholar, PubMed, and the Web of Science with the key words “interpupillary distance” and/or “IPD,” last updated on 29 November, 2024 (Figure 1). We adhered to the PRISMA guidelines and completed the PRISMA checklist (Supplementary Material). The references within relevant studies were examined for additional eligible sources. We included only data from adults and from teenagers when they had reached adult values of the IPD or interorbital width (Supplemental Table S1).35–43 Teenagers were judged to have reached adult IPD levels when their mean IPD ceased to increase and was within the range of adults in that same population. Relatively sparse reports of the IPD in younger ages were not considered because the growth trajectories differ not only between sexes but also between ethnicities, thereby introducing confounding variables. When studies examined and reported both near-vision and far-vision IPD, the far-vision IPD data were used. Studies using any traditional method of measuring the IPD were included, since the results of such methods (other than mobile phone applications) tend to differ very little. Studies that explicitly acknowledged biased data collection, by omitting extreme IPD values, were excluded.44
 |
Figure 1 PRISMA Flowchart of the search and screening strategy for studies on the interpupillary distance (IPD). The information about searches for the literature on the IPD is shown in regular black font. The search was last updated on November 29, 2024. The PRISMA checklist is included in the Supplemental Material. The number of studies eligible for analysis of the esotropia/exotropia (ET/XT) is shown in light gray (boxes and text, at lower right), because they were obtained from our previous systematic review and meta-analysis22 (for the 301 references on the ET/XT ratio, see Supplemental Material S1). |
The studies reporting strabismus prevalence were taken from our previous systematic reviews and meta-analyses.22,45 We only included studies that reported numerical values on prevalence of esotropia and exotropia. We excluded studies that were limited to subjects 2 years of age or younger, because strabismus often develops after 2 years of age.46–51 We excluded clinic-based studies, case reports, and we removed duplicate studies reporting on the same cohorts. Since we are interested in the potential association of the IPD with idiopathic childhood horizontal strabismus, the most common form of strabismus, rather than adult-onset strabismus (which is mostly paralytic strabismus), we included all reports of horizontal strabismus prevalence after 2 years of age; the vast majority of strabismus prevalence reports are on children approximately 3 to 16 years of age – only 13 of 288 studies are on adult-only cohorts.22
We created two types of geographical maps, the first one shows the global distribution of the mean IPD, and the second one shows the distribution of horizontal strabismus patterns, based on representative samples of the populations. Maps of the mean IPD were designed by using a graded heat map with color-coding of narrow (<61 mm, blue), intermediate-narrow (61–62 mm, green), intermediate (62–63 mm, yellow), relatively wide (63–64 mm, brown), and very wide distances (>64 mm, red). The heat maps were adjusted in the ranges to optimize visualization of differences and gradients between populations. National data (subjects in cohorts comprised from the entire country) are indicated in the center of the country. Ethnicities other than the predominant one of the country are indicated with special symbols. Likewise, cohorts of people with Down syndrome are coded separately. When studies from regions with multiple ethnicities did not report the ethnicities or the predominant ethnicity of the cohort, we researched the predominant ethnicity within that region and reported that if conclusive; when a predominant ethnicity was unclear, we reported the results in the category of “multiple ethnicities.”
Strabismus maps were created by calculating the esotropia/exotropia ratio (ET/XT ratio) for each study or cohort. We plotted the ET/XT ratio in a graded heat map with a lower than 0.25 ratio in red, 0.25 to 0.75 ratio in brown, 0.75 to 1.25 ratio in yellow, 1.25 to 3.0 ratio in green, and higher than 3.0 in blue. Ratios were adjusted in the ranges for optimal visualization of gradients. The size of the symbols is representative of the size of the cohort, with different symbols (circle, square, triangle, star, pentagon, rhombus) indicating different ethnicities (in countries with multiple ethnicities when ethnicity-specific information was reported). The ET/XT ratios for small cohorts were adjusted to avoid having a “0” in the numerator or in the denominator (Supplemental Table S2).52
We calculated mean IPDs and ET/XT ratios for the different regions and major ethnicities by adding up the mean times the sample size for each sample, and dividing this number by the sum of the sample sizes. We used these data to conduct a bivariate regression analysis that measured the strength of correlation between the IPD and the ET/XT ratio. Since some studies examined only male IPDs, some studies examined only females IPDs, and some studies reported only the mean IPD of males and females combined, we estimated any missing values by using a consistent formula for each ethnicity, as indicated in the Supplemental Table S1. The mean of the male value plus the mean of the female value divided by 2 was used for the overall IPD estimate. The IPD data were plotted against the ET/XT ratio of the same population, region or ethnicity. We pursued two strategies: pairing the IPD and ET/XT values only for major ethnicities, as well as pairing values derived at a higher resolution, from cohorts within 81 regions where data was available for both parameters (Supplemental Table S3). Outliers were identified using Tukey’s Hinges with k=3.0 and were excluded from the regression analysis.
We also used random effects meta-analysis to calculate a pooled mean IPD estimate for each ethnicity that incorporated between-study variation. We used mean and standard deviation data from each cohort with the meta-gen function with the inverse variance method for pooling from the R-meta package, version 4.9–5, in R software (R Foundation for Statistical Computing, Vienna, Austria) to estimate mean pooled IPD with 95% confidence intervals.53 Approximately 77% of the cohorts (n=222/288) in this review included standard deviation data (or data from which it could be calculated), and were eligible to be included in the meta-analyses (Supplemental Table S4). Heterogeneity across studies was assessed using the Maximum-likelihood estimator, Higgins’ I2 and Cochran’s Q method. We used a subgroup test to examine differences in pooled random IPD between participants of different ethnicities and estimate 95% confidence intervals for each group. Ethnic groups with at least three studies were included in the meta-analysis. Significance was defined at p=0.05.
Results
The maps depicted in the Results are organized such that Europe is shown first (Figure 2A for the IPD, Figure 2B for the ET/XT ratio), followed by Africa (Figure 3A for the IPD, Figure 3B for the ET/XT ratio), the Middle East (Figure 3C for the IPD, Figure 3D for the ET/XT ratio), Asia and Oceania (Figure 4A for the IPD, Figure 4B for the ET/XT ratio), and the Americas (Figure 5A for the IPD, Figure 5B for the ET/XT ratio).
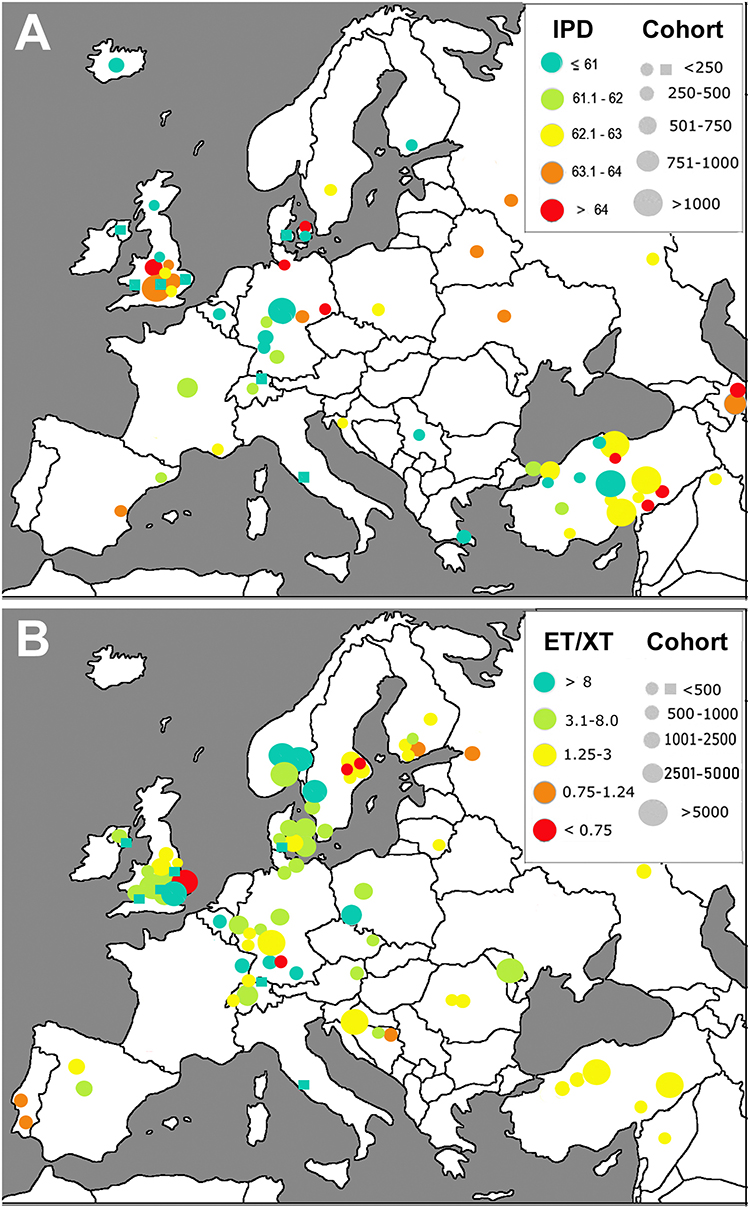 |
Figure 2 Europe. Geographical mapping of the interpupillary distance (IPD) (A) and the esotropia/exotropia ratio (ET/XT ratio) (B) . The size of the circles denotes the size of the cohort examined. The ranges of the IPD and the ET/XT ratio are color-coded in a heat map as indicated. Cohorts of people with Down Syndrome are shown as squares. Data from one cohort of Inuit (Eskimos) in Greenland is shown in Figure 5A. National data (subjects in cohorts comprised from the entire country) are indicated in the center of the country. |
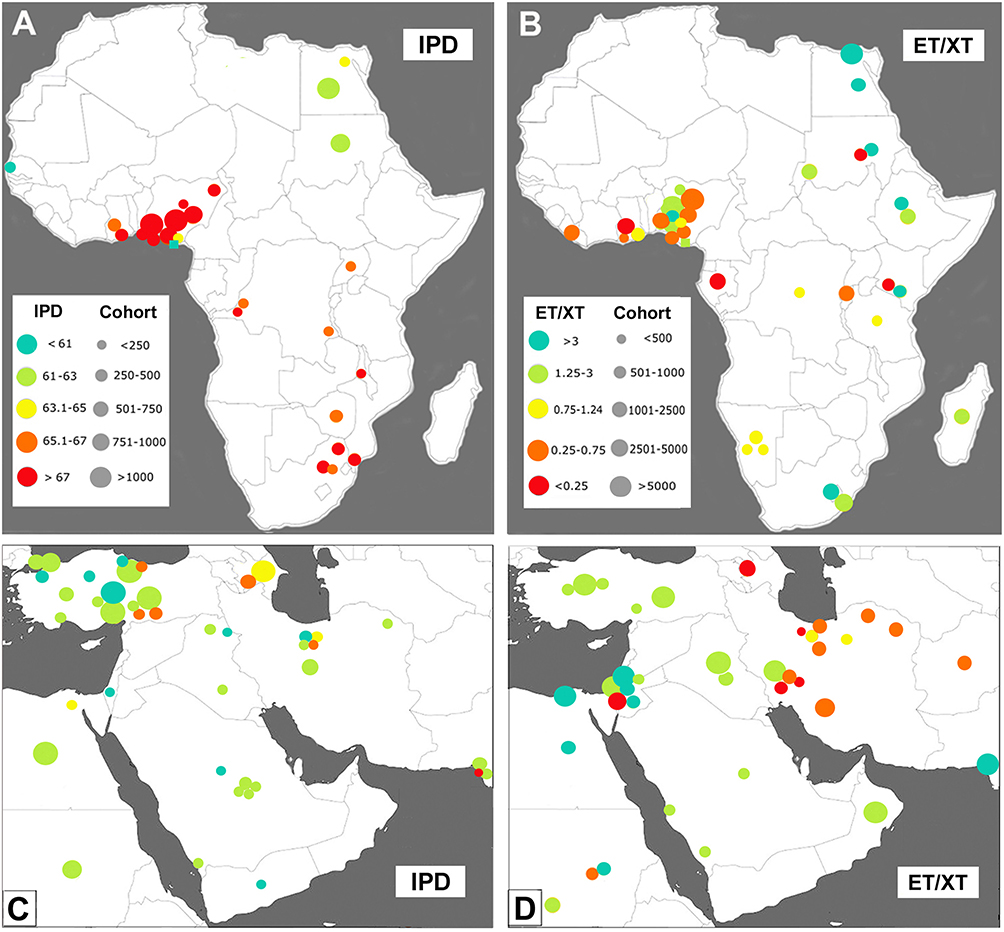 |
Figure 3 Africa and Middle East. Geographical mapping of the interpupillary distance (IPD) (A) and the esotropia/exotropia ratio (ET/XT ratio) (B) in Africa, and mapping of the IPD and ET/XT ratio ((C and D) respectively) in the Middle East. The size of the circles denotes the size of the cohort examined, and the ranges of the IPDs and the ET/XT ratios are color-coded in a heat map as indicated in (A) for the IPD, and (B) for the ET/XT ratio. |
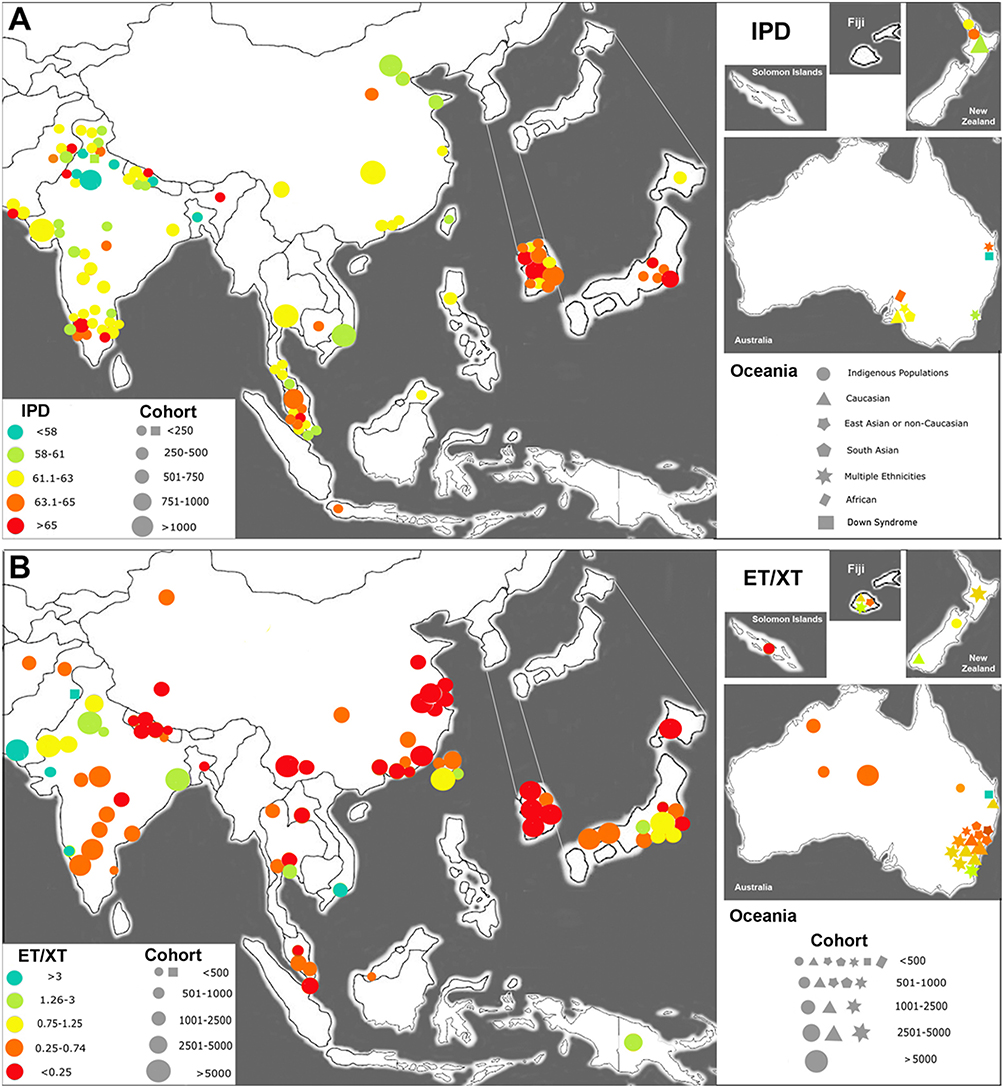 |
Figure 4 Asia and Oceania. Geographical mapping of the interpupillary distance (IPD) (A) and the esotropia/exotropia ratio (ET/XT ratio) (B). The size of the circles denotes the size of the cohort examined, and the ranges of the IPDs and the ET/XT ratios are color-coded in a heat map as indicated. Data from Korea and Japan are shown in the magnified regions to better resolve the location of the cohorts. The multiple ethnicities in Oceania are indicated with different symbols, as indicated. |
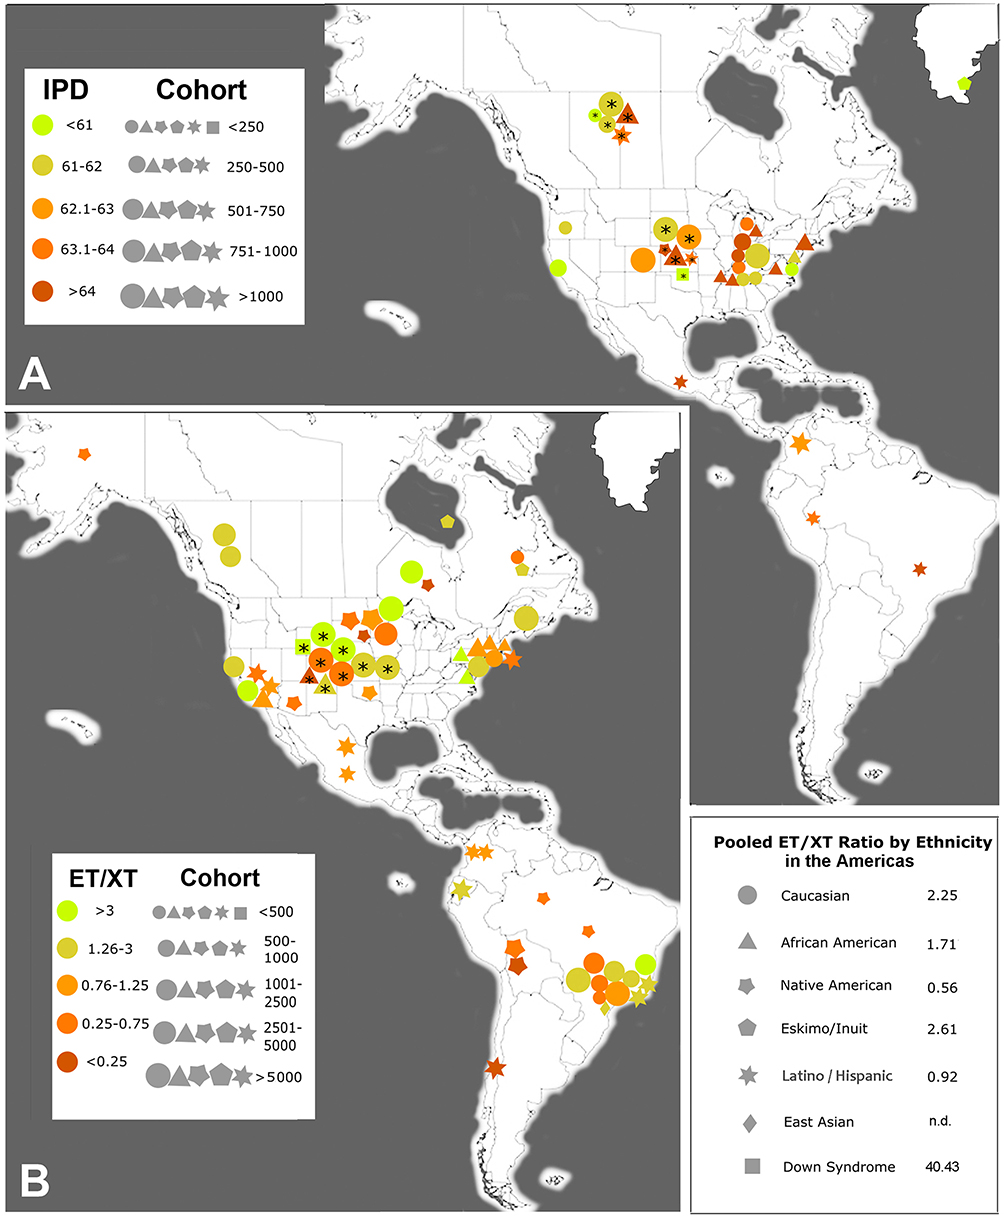 |
Figure 5 Americas. Geographical mapping of the interpupillary distance (IPD) (A) and the esotropia/exotropia ratio (ET/XT ratio) (B) . The size of the symbols denotes the size of the cohort examined. The ranges of the IPDs and ET/XT ratios are color-coded in a heat map as indicated. The multiple ethnicities in North and South America are indicated with different symbols, as indicated in the lower right-hand corner, along with the pooled estimate of the ET/XT ratio for five different ethnicities. Asterisks within symbols indicate that the cohorts were from multiple sites or represent national data; n.d., not determined: a pooled ratio was not determined, because only one study reported the ET/XT ratio for East Asians within the Americas. Greenland is included in this map because of its vicinity to North America. |
Mapping of the Interpupillary Distance (IPD)
Eligible studies were mapped geographically by the size of the cohort. Only data from adults or teenagers 14 years and older were included, except for Down syndrome cohorts where adult IPDs are reached at an earlier age.54–57 We report on the mean IPD from n=243 studies reporting on 128,100 subjects in 288 cohorts.32
- Europe. We found 42 studies reporting on 48 cohorts, with a total number of 15,968 subjects in all cohorts combined.1,9,12–14,17,58–88 The geographical map for Europe is shown in Figure 2A. Most of the mean IPDs in Central Europe range from ~ 60 mm to 63 mm, with larger mean IPDs (62–65 mm) present in Eastern Europe, Eastern Turkey and the South Caucasus.
- Africa. We found 27 studies reporting on 31 cohorts with 13,169 subjects.30,42,69,82,89–111 Two basic patterns are present: North and East Africa have populations with a narrower IPD of 61–64 mm, while West Africa has populations with the widest IPD, of 65 to over 70 mm (Figure 3A).
- Middle East. We found 36 studies reporting on 35 cohorts with 15,041 subjects.10,112–145 Most studies from this region report a narrow (<63 mm) IPD, including Arabs, Jews, some Iranians, and most Turks. In Eastern Turkey and Azerbaijan, the mean IPD is higher with 63 to 67 mm (Figure 3C).
- Asia and Oceania. We found 50 studies reporting on 51 cohorts with 13,980 subjects in South Asia,11,43,57,82,146–191 46 studies with 27,168 subjects in 57 cohorts from East Asia,18,36,38,40,82,184,192–232 and 7 studies with 1925 subjects in 11 cohorts from Oceania, including Australia233–239 (Figure 4A). The studies from the Northwest of the Indian subcontinent mostly showed a narrow IPD of less than 61 mm, while Central India and especially the South of India had larger IPDs of 61 to over 65 mm. The studies from East Asia report IPDs of 61 to 63 mm in China, and larger IPDs in Japan and Korea, mostly 63 to over 65 mm. For Oceania, studies reported on multiple ethnicities, Caucasians or indigenous populations (Maoris and Samoans). Caucasians had an IPD in the same range as those in the Americas (61–62 mm), similar to Maoris, while Samoans had a somewhat wider IPD (63.1 mm).233
- Americas. We found 52 studies reporting on 54 cohorts with 40,773 subjects; 46 studies were from North America (38,884 subjects),4–7,29,35,36,41,82,240–264 and 6 studies from South and Central America (1889 subjects).36,82,265–269 The studies from North and Central America included 28 studies with 26,576 Caucasian subjects, 11 studies with 3902 African Americans, 3 studies from North America on multiethnic cohorts (7503 subjects), 9 studies from North and South America with 2766 Latinos/Hispanics, and one study on 26 Native Americans (Figure 5A). As expected for a continent with multiple ethnicities, the five major ethnicities (Caucasian, Latino/Hispanic, African American, Native American, Inuit/Eskimo) show a large diversity of mean IPDs. Inuit (Eskimos) have a very narrow IPD of 59–60 mm,88 while Native Americans have a wide IPD of over 65 mm.4 Most studies on Caucasians in North America report an IPD similar to Caucasians in Europe. African Americans have a wider IPD, of 64–68 mm, which is similar to Africans from West Africa. In South and Central America, most studies on Latinos/Hispanics report an intermediate to wide IPD of 63–64 mm.
Pooled Estimates of the IPD and Subgroup Meta-Analysis by Ethnicity
The pooled mean estimate of the IPD in different ethnicities ranged from 56.1 mm in Down syndrome populations to 69.9 mm in West Africans (Figure 6A), with Down syndrome = 54.2 to 58.8 mm, Eskimo/Inuit = 59.5 mm, Northwestern South Asia = 60.93 mm, Maoris =61.2 mm, Caucasians (from Europe = 62.3 mm, from Americas, Oceania = 62.5 mm); Middle East = 62.5 mm, East Asians = 62.8 mm, South Asians in South/Central/East = 63.3 mm, Northeast African = 63.9 mm, Latinos/Hispanics = 64.0 mm, Native Americans = 65.1 mm, African Americans = 66.4 mm; West Africans = 69.9 mm. Males had a mean IPD that was 2.0 to 3.3 mm larger than that of females in that same ethnic population, with the exception of people with Down syndrome, where the mean male IPD was 0.9 mm smaller than the mean female IPD (Supplemental Table S1).
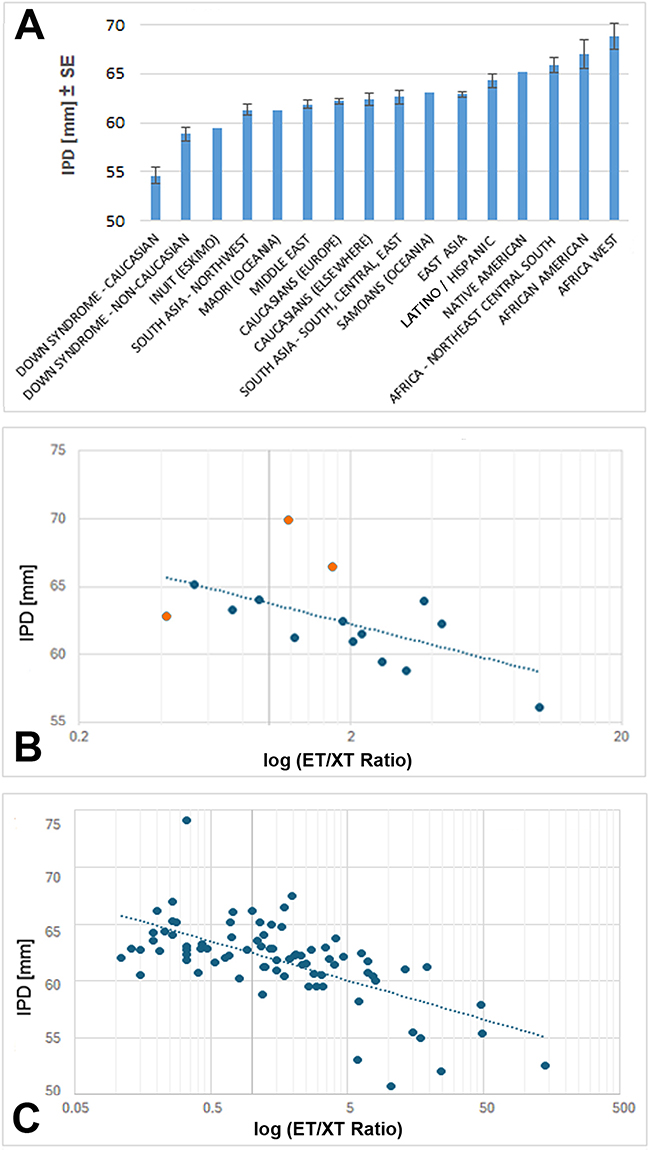 |
Figure 6 Mean IPD by ethnicity (A) and Regression Analysis of IPD versus ET/XT Ratio for major ethnicities (B) and for regional pairs at higher resolution (C). (A) The mean IPD (average of male and female) for major ethnicities and populations. Error bars show the standard error (SE) when n=2 or more cohorts. The mean IPD for Down syndrome is shown separately for Caucasians (C) and for non-Caucasians (NC). (B) Regression analysis of the mean IPD versus the log of the esotropia/exotropia (ET/XT) ratio for the major ethnicities and populations. The R2 value of 0.32 is indicated (p=0.012041). The linear regression equation for the trendline is y = −2.21ln(x) + 63.772. The three orange datapoints are the ones farthest from the trendline; the possible significance of these “outliers” is explained in the Discussion. The data point for Africans in North, East and South Africa also is somewhat remote from the trendline but is more difficult to interpret because it entails multiple ethnicities. (C) Regression analysis of the mean IPD versus the log (ET/XT ratio) at a higher resolution for 81 different regions where information for both parameters was available (Supplemental Table S3). Note that the R2 value increased to 0.41 (p=0.00000169), indicating that 41% of the ET/XT variation may be explained by the IPD. The linear regression equation for the trendline is y = −1.492ln(x) + 62.461. |
To calculate a pooled estimate of the IPD that incorporated between-study variation, the pooled IPD means for the major ethnicities were examined by random effects meta-analysis (77% of cohorts qualified for this analysis, Supplemental Table S4). Nearly all pooled IPD estimates derived from the complete cohorts were within the 95% confidence intervals defined by the meta-analysis. Two ethnicities were borderline (West Africa at 69.8 mm vs 69.9 mm; Middle East at 62.7 vs 62.5 mm), and North/East/South Africa was much lower (63.9 mm) than the low range of the 95% CI, at 66.7 mm, presumably because two studies with nearly half of the total cohort was excluded from the meta-analysis due to lack of SD information. Overall, the meta-analysis supported the mean IPD data reported above and illustrated in Figure 6A, while controlling for differences in study sample sizes and variability and estimating 95% confidence intervals for point estimates.
Mapping of Horizontal Strabismus Patterns – Esotropia/Exotropia (ET/XT) Ratios
We report on the global distribution of ET and XT (n=301 studies reporting on 334 cohorts with 2,159,669 subjects).22
- Europe. We found 83 population-based studies that met our inclusion criteria, reporting on ET and XT of 1,090,036 subjects in 88 cohorts (References S1–S83, Supplemental Table S2, Supplemental Material S1). The highest ET/XT ratio (>3.0) was found in Western and Central Europe, with somewhat lower ET/XT ratios (1.25–3.0; 0.75–1.25) in the northern parts of Sweden, in Finland, Northern parts of Russia, in Portugal, and the Balkans (Figure 2B). We included ratios reported for people with Down syndrome from four regions in Europe (total of 2770 subjects).45
- Africa. We found 32 population-based studies reporting on ET and XT (50,100 subjects in 32 cohorts, References S84–S115, Supplemental Material S1). Africa has two main types of strabismus patterns. Most populations in West Africa have a low ET/XT ratio (<0.75), while most populations in North Africa (Arabs) and in East Africa (Sudan, Kenya) have more ET than XT with ET/XT ratios between 1.0 and 7.0 (Supplemental Table S2 and Figure 3B).
- Middle East. We found 32 population-based studies reporting on ET and XT in 154,934 subjects from 33 cohorts (References S116–S147, Supplemental Material S1). Most populations in the Middle East have a higher ET/XT ratio (1.25–3.0), with the exception of the population in current Iran, Azerbaijan, and possibly Afghanistan. Nearly all studies (11/14) from Iran report a low ET/XT ratio (0.14–0.77) (Figure 4B). The large majority of studies from countries surrounding Iran report an ET/XT ratio between 1.48 and 5.0 (Figure 3D and Supplemental Table S2).
- Asia, including Oceania. We found a total of 96 population-based studies reporting on 115 cohorts with a total of 636,658 subjects. These included 55 studies reporting on ET and XT in East Asia (total number of subjects in 59 cohorts = 392,141), 25 studies from South Asia (total number of subjects = 131,847 in 25 cohorts), and 18 studies from Oceania (total number of subjects in 31 cohorts = 112,670). (References S148–S246, Supplemental Table S2, Supplemental Material S1). The lowest ET/XT ratios (<0.25) were reported in East Asia, including China, Nepal, South Korea and Japan. On the Indian subcontinent, most of the populations in the Northwest showed larger ET/XT ratios (1.14–6.25), while nearly all populations in the Central, Southern and Eastern regions had lower ET/XT ratios (0.11–0.69). Populations in Thailand, Malaysia and Singapore also had a lower ET/XT ratio. In Australia, New Zealand and other parts of Oceania, most indigenous populations had lower ET/XT ratios (0.09–1.00), while Caucasians had similar ratios as in North America (1.09–3.33), and populations of East Asian ancestry had lower ET/XT ratios, similar to those in East Asia (0.22–0.63, Figure 4B).
- Americas. We found 54 population-based studies reporting on ET and XT, with 35 studies from North America (a total of 197,409 subjects in 45 cohorts), and 19 studies from South and Central America with 54,407 subjects in 21 cohorts (References S247–S301, Supplemental Table S2, Supplemental Material S1). As detailed for five major ethnicities, ET/XT ratios depended on ethnicity. Nearly all studies on Native Americans report a low ET/XT ratio (0.07–1.00), based on eleven studies from Alaska to the Amazon (Figure 5B). On the other hand, Inuit (Eskimos) have a high ET/XT ratio of 1.67 to 3.00. Caucasians in the Americas have an ET/XT ratio of 2.25 (n=17 studies in North America, n=8 in South America) that is lower than for Caucasians in Europe (4.35). African Americans (n=8 studies) have an ET/XT ratio of 1.71 (range from 0.22 to 9.5). Latinos/Hispanics in the Americas (n=11 studies) have an ET/XT ratio of 0.92 (range from 0.24–2.00). People with Down syndrome have a high ET/XT ratio (40.43).
Regression Analysis
We compiled the information about the mean IPD (Figure 6A) and mean ET/XT ratio for all major ethnicities as well for distinct geographic regions (“higher resolution”) and performed regression analyses to determine whether there was a correlation between the two parameters (Supplemental Table S3). Because the ET/XT ratios extend over nearly three orders of magnitude, we used a logarithmic scale for the y-axis (Figure 6B and C). For the major ethnicities, the trendline was R2 = 0.322 between the ET/XT ratio and the IPD (p=0.012041), while for the “higher resolution” regional pairing of values, the trendline was R2 = 0.409 (p=0.00000169). This difference likely reflects better matching due to regional pairing, because it takes into account trends and gradients within larger countries. The R2 value of 0.409 suggests that 41% of the variation in the ET/XT ratio can be explained by the IPD.
Discussion
Our analysis provides the first mapping of the interpupillary distance (IPD) on a regional as well as a global scale. A comprehensive IPD mapping of populations throughout the world has not been previously attempted. Based on our analyses of data from over 128,000 subjects, we show that some ethnicities differ substantially in their mean IPDs (Figure 6A), confirming and significantly extending previous conclusions from a study with a much smaller cohort (3976 subjects).4 Our mapping of the mean IPD may assist the design of proper spectacles for diverse populations, and may also aid in optimizing the range of IPD settings on head-mounted displays for virtual reality applications. This may ensure that adequate ranges of IPDs are covered, and prevent cybersickness due to mismatches of a subject’s IPD and the IPD range on the head-mounted display for virtual reality.16,18 The IPD was previously examined in the context of stereoacuity,213,270 intelligence (“borderline” significance),271 and beauty,272,273 and a wider IPD was associated with an extroverted personality.274 In our discussion, we focus on the role of the IPD in spectacle design, head-mounted displays, and the association with horizontal strabismus.
Our maps show that the mean IPD and the strabismus types (ET/XT ratio) vary between populations, in intriguingly distinct and correlated patterns. Differences in the IPD between ethnicities point to genetic (anatomical) differences that evolved from ancestral orbit types.275,276 We explored at the ecological/population level whether one orbital parameter, the orbital width – as measured by the IPD – is associated with the type of horizontal strabismus as quantified by the ET/XT ratio. Our regression analysis shows that there is a moderate association between the ET/XT ratio and the IPD. We conclude that the orbital anatomy and specifically the IPD contributes to the variation of strabismus patterns, as proposed in the older strabismus literature.19,20,23–31,277 In fact, the “growing out of strabismus” for children with esotropia has been explained as being due to the natural growth of the orbit in teenage years.20,25,278–280
Why and how does the width of the orbit affect strabismus? Mechanistic models postulate that when the IPD is large, then the medial rectus muscles have to work harder to converge the eyes and achieve binocular fusion, and any failure will tend to produce more XT than ET.20,23,26,66,277,280 When IPDs are extreme, either on the narrow side, or on the wide side, then the horizontal muscles are more likely to fail to provide normal alignment, resulting in tropia. This is consistent with the effects of extremely wide (pathological) IPDs in syndromic craniosynostosis such as Apert and Crouzon syndromes, which frequently associate with XT,279–283 and the effects of extremely narrow IPDs, as in Down syndrome, which most frequently associate with ET, although additional risk factors may also contribute.45 The ethnicity-specific distribution of ET/XT ratios in cerebral palsy284 are consistent with the proposed effect of the orbital width.
Our regression analysis provides evidence at the ecological/population level that the orbital anatomy plays a role in determining the predominant type of horizontal strabismus. Thus, the higher risk or tendency in certain populations towards either ET or XT is largely genetically determined. The R2 values of 0.320 for major ethnicities and 0.410 for populations at higher resolution show a moderately strong association between the IPD and the ET/XT ratio, indicating that the IPD explains about 41% of the ethnic variation in the ET/XT ratio.
When we examined the paired data points in Figure 6B and C, we found that three ethnicities (West Africans, African Americans, and East Asians) have mean ET/XT ratios that are farthest removed from the global trend line. Values for Africans fall above the trend line, while values for East Asians fall below the trendline. Interestingly, Africans and African Americans have high values of proptosis (protrusion of the eyeball) – another parameter of the orbit besides the IPD which is known to affect horizontal strabismus and varies between ethnicities.3,284 Africans have proptosis of about 17 mm,285,286 while most East Asian cohorts have values at or below 14 mm.287–290 Therefore, the “flat” orbit in East Asians may contribute to the low ET/XT ratio, besides the large IPD, while in Africans, the high proptosis may partially offset the effect of a large IPD, resulting in a higher ET/XT ratio than would be expected based on the IPD alone. Indeed, when the three outliers in Figure 6B are removed, the R2 increases to 0.536, and when the three values are adjusted to lie close to the trendline, the R2 reaches 0.761 (data not shown). We propose that the combination of a flat orbit with a wide IPD will cause more XT, while a steep orbit (large proptosis) with a narrow IPD will cause more ET. Additional parameters of the orbit besides IPD and proptosis may further contribute to ethnic differences in strabismus. These include differences in the orbital angle (nasomalar angle), and differences in the insertion or length of the extraocular muscles.33,34,280,291–296
Regarding gender differences, we confirm that males generally have a slightly larger IPD than females from the same ethnicity, with the mean gender difference ranging from 2.0 to 3.3 mm between ethnicities (Supplemental Table S1). If a wider IPD associates with more XT, and a narrow IPD with more ET, why do females with a slightly narrower mean IPD not have more ET, and males with their slightly larger mean IPD not have more XT?297 It has to be considered that the mean IPD is less relevant than the percentage of subjects in a cohort with extreme IPDs (low or high), since those are most at risk for ET or XT, respectively.30 Therefore, the kurtosis of the IPD data is crucial. Kurtosis is rarely reported in studies of the IPD, but in a few studies, the kurtosis can be estimated from the graphs, tables or scatter plots.4,64,66,96,121,190,236 Indeed, there is some support from such studies that the kurtosis of the IPD differs between males and females, and this may explain why there is no significant difference between males and females in ET and XT prevalence, despite most studies reporting a gender difference in the mean IPD. Another possibility is a gender difference in the strength (thickness) of some or all the extraocular muscles.298,299
The differences in orbital width between populations raises the question of how these differences may have evolved. One plausible and intriguing explanation is that anatomically modern humans encountered and interbred to different extents with archaic hominins such as Neanderthals and Denisovans.300–305 Archaic hominins had much wider orbital widths than anatomically modern humans.305–307 Depending on the extent of introgression of genes that regulate the width of the developing orbit,308,309 populations in East and Central Asia appear to have evolved an orbit that is more disposed to a larger IPD and an eyeball position in the orbit that favors XT over ET. This hypothesis is consistent with the multiple Neanderthal introgression events in East Asia and the geographical distribution of Denisovans.299,301–303,309 The ethnic differences then further expanded and became refined by subsequent migrations, 60k to 10k years ago to Australia, and to the Americas as well as within Africa.310–313 The wider orbit in present-day West Africans may reflect the fact that they harbor significant amounts of gene introgression from an archaic population that likely diverged before the split of anatomically modern humans and the ancestors of Neanderthals and Denisovans.313 Our finding of gradients within India is supported by a recent study showing that populations in the East of India have more Denisovan DNA than populations in the North of India.314
Limitations of our review include that not all cohorts are ethnically “pure” or homogeneous – some noise is inevitable In fact, there has been substantial mixing of populations, especially due to the migrations within Africa, migrations from Europe to North and South America, and within Oceania. Consequences of some of these migrations on the IPD are apparent, for example the Bantu migration from West Africa to Central and South Africa,315 the migration of ancestors of Native Americans from Central Asia,316 the migration from Europe into the Americas, and the migration from Central Asia into Nepal. We acknowledge the lack of data or sparse information for several populations (Native Americans, Inuit/Eskimos, indigenous populations in Oceania). Nevertheless, the narrow IPD in Eskimos is supported by studies examining the interorbital width of skulls,317–319 and likewise the relatively large interorbital width in Native Americans.320 Ideally, we would like to have information about the IPD and the ET/XT ratio from exactly the same cohorts, but such studies are sparse.54,56,85,86,103,239,247 The rarely reported kurtosis may be more relevant as a risk factor for strabismus than the mean IPD.
Conclusion
The interpupillary distance differs between ethnicities and associates with horizontal strabismus patterns (esotropia to exotropia ratio), with an R2 value of 0.41. A narrow orbit is associated with an increased frequency of esotropia, and a wider orbit is associated with an increased frequency of exotropia. The significance of our work is that it provides a better understanding of horizontal strabismus, its development and evolution, and greater appreciation for diverse strabismus patterns; this is important for planning of vision care and risk factor awareness. Our work may also help with appropriate spectacle design and proper head-mounted displays that are becoming increasingly popular in virtual reality.321
Acknowledgments
The authors thank the following individuals who helped to obtain relevant literature and/or assisted with translations of texts: Aderonke Baiyeroju (Univ. of Ibidan, Nigeria), Jenny Costa (University of Nevada, Reno), Chengyuan Feng (Johns Hopkins University, USA), Koji Matsuda (Matsuda Eye Clinic, Osaka, Japan), Sineenart Sengyee (University of Nevada, Reno), Napaporn Tananuvat (Chiang Mai University, Thailand), Carina Vetye-Maler (Munich/Buenos Aires), and Wei Yang (University of Nevada, Reno). Grant support: NIH grants EY031729 (C.S.v.B.) and GM103554 (C.S.v.B.), International Research Support Initiative Program (IRSIP) fellowship by the Higher Education Commission of Pakistan (Z.Z.). Research reported in this publication was supported by the National Eye Institute and the Institute of General Medical Sciences of the National Institutes of Health. The content is solely the responsibility of the authors and does not necessarily represent the official views of the National Institutes of Health.
Disclosure
The authors report no conflicts of interest in this work.
References
1. Günther H. Die Variabilitaet der Interorbitalbreite und des Augenabstandes [The variability of the interorbital width and the distance between the eyes]. Zeitschr Morphol Anthropol. 1933;32:250–23. German.
2. Stephan CN, Davidson PL. The placement of the human eyeball and canthi in craniofacial identification. J Forensic Sci. 2008;53(3):612–619. doi:10.1111/j.1556-4029.2008.00718.x
3. Blake CR, Lai WW, Edward DP. Racial and ethnic differences in ocular anatomy. Int Ophthalmol Clin. 2003;43(4):9–25. doi:10.1097/00004397-200343040-00004
4. Dodgson NA. Variation and extrema of human interpupillary distance. In: Woods AJ, Merrit JO, Benton SA, Bolas MT, editors.
5. Cesario VA, Latta GH. Relationship between the mesiodistal width of the maxillary central incisor and interpupillary distance. J Prosthet Dent. 1984;52(5):641–643. doi:10.1016/0022-3913(84)90133-1
6. Latta GH, Weaver JR, Conkin JE. The relationship between the width of the mouth, interalar width, bizygomatic width, and interpupillary distance in edentulous patients. J Prosthet Dent. 1991;65(2):250–254. doi:10.1016/0022-3913(91)90170-2
7. Parciak EC, Dahiya AT, Al Rumaih HS, Kattadiyil MT, Baba NZ, Goodacre CJ. Comparison of maxillary anterior tooth width and facial dimensions of 3 ethnicities. J Prosthet Dent. 2017;118(4):504–510. doi:10.1016/j.prosdent.2016.10.035
8. Cinelli F, Piva F, Bertini F, Russo DS, Giachetti L. Maxillary anterior teeth dimensions and relative width proportions: a narrative literature review. Dent J. 2023;12(1):3. doi:10.3390/dj12010003
9. Pointer JS. The interpupillary distance in adult Caucasian subjects, with reference to ‘readymade’ reading spectacle centration. Ophthalmic Physiol Opt. 2012;32(4):324–331. doi:10.1111/j.1475-1313.2012.00910.x
10. Ilhan N, Dogan H, Ilhan O, Coskun M, Bulut BT, Ersekerci TK. Compatibility of spectacles with their prescriptions in central Anatolia. Semin Ophthalmol. 2015;30(1):29–35. doi:10.3109/08820538.2013.810287
11. Maseedupalli S, Priyanka PVJ, Konda S, Kolli LN. Head and facial anthropometry of the Indian population for designing a spectacle frame. Indian J Ophthalmol. 2023;71(3):989–993. doi:10.4103/ijo.IJO_954_22
12. Mon-Williams M, Wann JP, Rushton S. Binocular vision in a virtual world: visual deficits following the wearing of a head-mounted display. Ophthalmic Physiol Opt. 1993;13(4):387–391. doi:10.1111/j.1475-1313.1993.tb00496.x
13. Zilch D, Bruder G, Steinicke F. Comparison of 2D and 3D GUI widgets for stereoscopic multitouch setups. J Virt Real Broadcas. 2014;11(7):urn:nbn:de:0009–6–39934. doi:10.20385/1860-2037/11.2014.7
14. Mestre DR, Louison C, Ferlay F. The contribution of a virtual self and vibrotactile feedback to walking through virtual apertures. In: Kurosu M, editor. Human-Computer Interaction. Interaction Platforms and Techniques. HCI 2016. Lecture Notes in Computer Science, Vol. 9732. Cham: Springer; 2016. doi:10.1007/978-3-319-39516-6_21
15. Kemeny A, Chardonnet JR, Colombet F. Getting Rid of Cybersickness in Virtual Reality, Augmented Reality, and Simulators. Cham: Springer; 2020. doi:10.1007/978-3-030-59342-1_3
16. Stanney K, Fidopiastis C, Foster L. Virtual reality is sexist: but it does not have to be. Front Robotics AI. 2020;7:4. doi:10.3389/frobt.2020.00004
17. Schuetz I, Fiehler K. Eye tracking in virtual reality: vive pro eye spatial accuracy, precision, and calibration reliability. J Eye Mov Res. 2022;15(3). doi:10.16910/jemr.15.3.3
18. Kim JS, An BH, Jeong WB, Lee SW. Estimation of interpupillary distance based on eye movements in virtual reality devices. IEEE Access. 2021;9:155576–155583. doi:10.1109/ACCESS.2021.3128991
19. Holm S. Le strabisme concomitant chez les palénégrides au Gabon, Afrique Equatoriale Française. Contribution å la question de race et de strabisme [Concomitant strabismus among Palenegrids in Gabon, French Equatorial Africa. A contribution to the quesion of race and strabismus]. Acta Ophthalmol. 1939;17:367–387. French. doi:10.1111/j.1755-3768.1939.tb07376.x
20. Waardenburg PJ. Squint and heredity. Doc Ophthalmol. 1954;7–8:422–494. doi:10.1007/BF00238145
21. Hashemi H, Pakzad R, Heydarian S, et al. Global and regional prevalence of strabismus: a comprehensive systematic review and meta-analysis. Strabismus. 2019;27(2):54–65. doi:10.1080/09273972.2019.1604773
22. von Bartheld CS, Hagen MM, Jiang J, Yang W, Agarwal AB. The global prevalence of horizontal strabismus: a systematic review and meta-analysis with a focus on ethnic variation. Surv Ophthalmol. 2026 May 7:S0039-6257(26)00065-2. Epub ahead of print. doi:10.1016/j.survophthal.2026.05.002.
23. Mannhardt J. Muskuläre Asthenopie und Myopie [Muscular asthenopia and myopia]. Arch Ophthalmol. 1871;17(2):69–97. German.
24. Duane A. A new classification of the motor anomalies of the eye based upon physiological principles, together with their symptoms, diagnosis and treatment. Annals Ophthalmol Otol. 1896;5:969–1008.
25. Weiss L. Upon the relation between the internal and external recti as affected by increasing divergence of the orbits. Arch Ophthalmol. 1896;25:341–348.
26. Brown CH. Chapter 14, Anomalies of the ocular muscles. In: The Optician’s Manual. Vol. II. A Treatise on the Science and Practice of Optics. Philadelphia: The Keystone; 1902:289–392.
27. Lagleyze P. Du Strabisme: Recherches Etiologiques - Pathogenie Mecanisme du Traitement. Paris: Jules Rousset; 1913:409.
28. Cass EE. Divergent Strabismus. Br J Ophthalmol. 1937;21(10):538–559. doi:10.1136/bjo.21.10.538
29. Ditmars DL. Relationship between refractive error, phoria, and interpupillary distance in 500 patients. J Am Optom Assoc. 1966;37(4):361–363.
30. Kikudi Z, Maertens K, Kayembe L. [Strabismus and heterophoria: the situation in Zaire]. J Fr Ophtalmol. 1988;11(11):765–768. French.
31. Baiyeroju-Agbeja AM, Owoeye JFA. Strabismus in children in Ibadan. Niger J Ophthalmol. 1998;6(1):31–33.
32. Zehra A, Hagen MM, Wang L, von Bartheld CS. The interpupillary distance differs between ethnicities and associates with horizontal strabismus patterns: evidence from a systematic review and meta-analysis. medRxiv [Preprint]. 2025 [posted December 30, 2025]. doi:10.64898/2025.12.30.25343217.
33. Yu CB, Fan DS, Wong VW, Wong CY, Lam DS. Changing patterns of strabismus: a decade of experience in Hong Kong. Br J Ophthalmol. 2002;86(8):854–856. doi:10.1136/bjo.86.8.854
34. Jiao Y, Zhu Y, Zhou Z, et al. Strabismus surgery distribution during 10-year period in a tertiary hospital. Chin Med J. 2014;127(16):2911–2914. doi:10.3760/cma.j.issn.0366-6999.20141095
35. Jackson E. The position of the eyeball in the orbit. Trans Sect Ophthalmol Am Med Assoc. 1921;27:58–76.
36. Pryor HB. Objective measurement of interpupillary distance. Pediatrics. 1969;44(6):973–977. doi:10.1542/peds.44.6.973
37. Fledelius HC, Stubgaard M. Changes in eye position during growth and adult life as based on exophthalmometry, interpupillary distance, and orbital distance measurements. Acta Ophthalmol. 1986;64(5):481–486. doi:10.1111/j.1755-3768.1986.tb06958.x
38. Park DM, Song JW, Han KW, Kang JS. Anthropometry of Korean eyelids. J Korean Soc Plast Reconstr Surg. 1990;17:822–841.
39. Farkas LG, Posnick JC, Hreczko TM, Pron GE. Growth patterns in the orbital region: a morphometric study. Cleft Palate Craniofac J. 1992;29(4):315–318. doi:10.1597/1545-1569_1992_029_0315_gpitor_2.3.co_2
40. Wang Y, Zhao Y, Ai Y. [Survey on the growth of interpupillary distance of Chinese children aged 5 to 17 years]. Zhonghua Yan Ke Za Zhi. 2001;37(1):63–65. Chinese.
41. MacLachlan C, Howland HC. Normal values and standard deviations for pupil diameter and interpupillary distance in subjects aged 1 month to 19 years. Ophthalmic Physiol Opt. 2002;22(3):175–182. doi:10.1046/j.1475-1313.2002.00023.x
42. Osunwoke EA, Didia BC, Olotu EJ, Yerikema AH. A study on the normal values of inner canthal, outer canthal, interpupillary distance and head circumference of 3–21 years Ijaws. Am J Sci Ind Res. 2012;3(6):441–445.
43. Shah AK, Sambav S, Jethani J, Gupta A. An assessment of the interpupillary distance, the inner and outer intercanthal distances in the normal Indian population from early neonatal period up to over 70 years of age: a study of 3500 subjects. Int J Clin Pract. 2014;6:17–25.
44. Jain AR, Nallaswamy D, Ariga P. Determination of correlation of width of maxillary anterior teeth with extraoral factor (Interpupillary Width) in Indian Population. J Clin Diagn Res. 2019;13(7):ZC10–ZC17.
45. von Bartheld CS, Chand A, Wang L. Prevalence and etiology of strabismus in down syndrome: a systematic review and meta-analysis with a focus on ethnic differences in the esotropia/exotropia ratio. Ophthalmic Epidemiol. 2025;32(6):633–651. doi:10.1080/09286586.2025.2500018
46. Collins SD. Strabismus and defective color sense among school children. Pub Health Rep. 1925;40:1515–1523. doi:10.2307/4577602
47. Frandsen AD. Occurrence of squint: a clinical-statistical study on the prevalence of squint and associated signs in different groups and ages of the Danish population. Acta Ophthalmol Suppl. 1960;62:9–157.
48. Adelstein AM, Scully J. Epidemiological aspects of squint. Br Med J. 1967;3(5561):334–338. doi:10.1136/bmj.3.5561.334
49. Roberts J, Rowland M. Refractive status and motility defects of persons 4–74 years, United States 1971–1972. Vital and health statistics: series 11, DHEW publication no. (PHS) 78–1654. Hyattsville, MD: National Center for Health Statistics; 1978.
50. Matsuo T, Matsuo C, Matsuoka H, Kio K. Detection of strabismus and amblyopia at 1.5- and 3-year-old children by preschool vision-screening program in Japan. Acta Med Okayama. 2007;61:9–16. doi:10.18926/AMO/32910
51. Torp-Pedersen T, Boyd HA, Skotte L, et al. Strabismus incidence in a Danish population-based cohort of children. JAMA Ophthalmol. 2017;135(10):1047–1053. doi:10.1001/jamaophthalmol.2017.3158
52. Sweeting MJ, Sutton AJ, Lambert PC. What to add to nothing? Use and avoidance of continuity corrections in meta-analysis of sparse data. Stat Med. 2004;23(9):1351–1375. doi:10.1002/sim.1761
53. Balduzzi S, Rücker G, Schwarzer G. How to perform a meta-analysis with R: a practical tutorial. Evid Based Ment Health. 2019;22(4):153–160. doi:10.1136/ebmental-2019-300117
54. Vontobel W. Uber Linsen und Hornhautuntersuchungen an mongoloiden Idioten [Investigations on the lens and cornea of Mongoloid idiots]. Arch Ophthalmol. 1933;130:325–338. German.
55. Missiroli A, Vanni V. Sui segni oculari della sindrome di Down (mongolismo) [Ocular signs in Down’s syndrome (mongolism)]. Boll Ocul. 1970;49(2):123–139. Italian.
56. Woodhouse JM, Hodge SJ, Earlam RA. Facial characteristics in children with Down’s syndrome and spectacle fitting. Ophthalmic Physiol Opt. 1994;14(1):25–31. doi:10.1111/j.1475-1313.1994.tb00552.x
57. Bhalla AK, Kaur H, Kaur R, Panigrahi I, Walia BNS. Growth pattern and use of inter-pupillary distance in the detection of ocular hypertelorism and hypotelorism in Indian down syndrome children. J Pediatr Genet. 2021;12(2):123–128. doi:10.1055/s-0041-1736612
58. Becker O. 1861 – data presented in: Beselin O. Untersuchungen über Refraktion und Grundlinie der Augen und über die dynamischen Verhaltnisse der lateral wirkenden Augenmuskeln an Maedchen von 5–18 Jahren [Studies on refraction and baseline of the eyes, and on the dynamic conditions of the laterally acting eye muscles in girls aged 5 to 18 years]. Arch Augenheilk. 1885;14:132–161. German.
59. Pflüger E. Über die Pupillendistanz [About the pupillary distance]. Klin Monatsbl Augenheilk. 1875;13:451–458. German.
60. Holmgren F. Ueber den Augenabstand der Farbenblinden [On the interpupillary distance of the colorblind]. Arch Ophthalmol. 1879;25(1):135–160. German.
61. Beselin O. Untersuchungen über Refraction und Grundlinie der Augen und über die dynamischen Verhaltnisse der lateral wirkenden Augenmuskeln an Maedchen von 1–18 Jahren [Studies on refraction and baseline of the eyes, and on the dynamic conditions of the laterally acting eye muscles in girls aged 5 to 18 years]. Arch Augenheilk. 1885;14:132–161. German.
62. Seggel R. Ueber das Verhaeltnis von Schaedel- und Gehirnentwicklungs zum Laengenwachstum des Koerpers [On the relationship of skull and brain development to the longitudinal growth of the body]. Arch Anthropol. 1904;29:1–25. German.
63. Speidel K. Die Augen der Theologiestudierenden in Tübingen. Untersuchungen aus der Tübinger Universitätsaugenklinik [The eyes of theology students in Tuebingen: Studies from theTuebingen University Eye Clinic]. Int Arch Schulhygiene. 1905;1:28–52. German.
64. Helmbold R. Vergleichende Untersuchungen über den Pupillenabstand zu einigen Massen des übrigen Körpers. l. [Comparative studies on the pupillary distance in relation to some measures of the rest of the body. I.]. Zeitschr Ophthalm Optik. 1914;2:1–6. German.
65. Koegel H. Pupillenabstand und andere Korpermasse. IV. [Pupillary distance and other body measurements. IV.]. Zeitschr Ophthalm Optik. 1914–1916;2–4:129–142. German.
66. Koegel H. Pupillenabstand und Refraktion. Berlin, Heidelberg: Springer; 1915.
67. Bertelsen TI. On 720 measurements with Lueddes exophthalmometer. Acta Ophthalmol. 1954;32(5):589–595.
68. Kerwood LA, Lang-Brown H, Penrose LS. The interpupillary distance in mentally defective patients. Hum Biol. 1954;26(4):313–323.
69. Babalola J, Szajnzicht E. Ocular characteristics in West Africans and Europeans: a comparison of two groups. Br J Physiol Opt. 1960;17:27–37.
70. Kisling E. Cranial Morphology in Down’s Syndrome. A Comparative Roentgencephalometric Study in Adult Males [Thesis]. Copenhagen: Munksgaard; 1966.
71. Garrett JW, Kennedy KW. A Collation of Anthropometry. Vols. I, A–H. Springfield, Virginia: National Technical Information Service; 1971.
72. Brückner R, Batschelet E, Hugenschmidt F. The Basel longitudinal study on aging (1955–1978). Ophthalmo-gerontological research results. Doc Ophthalmol. 1986;64(3):235–310. doi:10.1007/BF00161733
73. Jonasson F, Thordarson K. Refraction and Interpupillary Distance Measurements of Adult Icelanders with special reference to presbyopes possible use of supermarket standard spectacles. Acta Ophthalmol. 1987;65(S182):44–47. doi:10.1111/j.1755-3768.1987.tb02588.x
74. Howarth PA. Oculomotor changes within virtual environments. Appl Ergon. 1999;30(1):59–67. doi:10.1016/s0003-6870(98)00043-x
75. Pointer JS. The far interpupillary distance. A gender-specific variation with advancing age. Ophthalmic Physiol Opt. 1999;19(4):317–326. doi:10.1046/j.1475-1313.1999.00441.x
76. Filipović T. Changes in the interpupillary distance (IPD) with ages and its effect on the near convergence/distance (NC/D) ratio. Coll Antropol. 2003;27(2):723–727.
77. Wilkinson CM, Motwani M, Chiang E. The relationship between the soft tissues and the skeletal detail of the mouth. J Forensic Sci. 2003;48(4):728–732. doi:10.1520/JFS2002412
78. Mommaerts MY, Moerenhout BA. Reliability of clinical measurements used in the determination of facial indices. J Craniomaxillofac Surg. 2008;36(5):279–284. doi:10.1016/j.jcms.2007.11.005
79. García-Lázaro S, Ferrer-Blasco T, Radhakrishnan H, Albarrán-Diego C, Montés-Micó R. Artificial pupil versus contralateral balanced contact lens fit for presbyopia correction. Arq Bras Oftalmol. 2014;77:76–80.
80. Lupón-Bas N, Torrents Gómez A, Cardona G, da Silva JA, Aznar-Casanova JA. New evidence of visual space anisotropy with auto-stereograms. Psychol Neurosci. 2014;7(3):261–267. doi:10.3922/j.psns.2014.033
81. Hakala J, Kätsyri J, Takala T, Häkkinen J. Perception of stereoscopic direct gaze: the effects of interaxial distance and emotional facial expressions. J Vis. 2016;16(9):5. doi:10.1167/16.9.5
82. Flament F, Francois G, Seyrek I, Saint-Leger D. Age-related changes to characteristics of the human eyes in women from six different ethnicities. Skin Res Technol. 2020;26(4):520–528. doi:10.1111/srt.12824
83. Knezi N, Isaretovic V, Adjic I, Babic N, Maric D, Stojsic Dzunja L. Morphometric analysis of the palpebral fissure and canthal distance in Serbian young adults. Int J Morphol. 2020;38(5):1381–1385. doi:10.4067/S0717-95022020000501381
84. Tsiogka A, Petrou P, Droutsas K, et al. Hertel exophthalmometry values in a Greek adult outpatient clinic-based population: association with demographic factors and systemic disease. Cureus. 2023;15(2):e35027. doi:10.7759/cureus.35027
85. Brushfield T. Mongolism. Brit J Child Dis. 1924;21:241–258.
86. Lowe RF. The eyes in mongolism. Br J Ophthalmol. 1949;33(3):131–174. doi:10.1136/bjo.33.3.131
87. Doyle L, Saunders KJ, Little JA. Trying to see, failing to focus: near visual impairment in Down syndrome. Sci Rep. 2016;6:20444. doi:10.1038/srep20444
88. Skeller E. Anthropological and ophthalmological studies on the Angmagssalik Eskimos. Meddr Groenland. 1954;107(4):1–231.
89. Kaimbo DK, Kayembe D. [Orbital measurements in Zairian children. Inner canthal, outer orbital, inter-pupillary distances and proptosis]. J Fr Ophtalmol. 1994;17(8–9):496–500. French.
90. Umar MB, Singh SP, Shugaba AI. Orbital measurements among the ethnic groups of Plateau State, Nigeria. Highland Med Res J. 2005;3(2):45–50.
91. Ilechie AA, Asiaku J. Ophthalmic anthropometry for Ghanaian adults. J Health Vis Sci. 2010;12(1):1–10.
92. Oladipo GS, Okoh PD, Hart JS. Anthropometric study of ocular dimensions in adult Ijaws of Nigeria. Res J Med Med Sci. 2010;5(2):121–124.
93. Osunwoke EA, Elekwa A, Bob-Manuel IF, Ojeka SO. A study on the normal values of inner canthal, outer canthal, canthal index, interpupillary distance and head circumference of 23–42 years Igbos. Global J Med Sci. 2010;9:1–2.
94. Esomonu UG, Taura MG, Anas IY, Modibbo MH. Anthropomethric studies of the interpupillary distance among the Igbos of South Eastern Nigeria. Bayero J Pure Appl Sci. 2012;5(1):123–126.
95. Kumah DB, Akuffo KO, Abaka-Cann JE, Ankamah E. Interpupillary distance measurements among students in the Kumasi Metropolis. Optom Open Access. 2016;1:103. doi:10.4172/2476-2075.1000103
96. Omodele J, Anthony B, Ugochi AO, Olushola O, Mojisola L. Interpupillary distance and its limits in South Western Nigeria. Br J Med Med Res. 2016;11(4):1–7. doi:10.9734/BJMMR/2016/19152
97. Usman Y, Shugaba A. A study of the near and far interpupillary distances among the Bura ethnic group of North-Eastern Nigeria. Ann Bioanthropol. 2016;4(1):60–63. doi:10.4103/2315-7992.190465
98. Adekunle AA, Olowo AY, Adetona M, et al. Variations in facial anthropometric measurements among major ethnic groups in Nigeria: a 3-dimentional stereophotogrammetry analysis. FACE. 2021;2(3):236–243. doi:10.1177/27325016211029013
99. Adekunle AA, Olowo AY, James O, et al. Facial Anthropometry Measurements Using Three-Dimensional Stereophotogrammetry Analysis Among Nigerians. J Craniofac Surg. 2022;33(4):1178–1181. doi:10.1097/SCS.0000000000008036
100. Soumboundou S, Ndiaye ML, Marcellin Nouaman N, Farhat O, Abdou Lecor P. Three-dimensional anthropometric study of the facial morphology of black African Senegalese: 3D photogrammetric approach. J Oral Biol Craniofac Res. 2023;13(5):522–526. doi:10.1016/j.jobcr.2023.05.015
101. Adio AO, Wajuihian SO. Ophthalmic manifestations of children with Down syndrome in Port Harcourt, Nigeria. Clin Ophthalmol. 2012;6:1859–1864. doi:10.2147/OPTH.S36685
102. Ried HA. Zur Anthropologie des abflusslosen Rumpfschollenlandes im nord-ostlichen Deutsch-Ostafrika [On the anthropology of the faulted plateau in German East Africa]. Abh Hamb Kolonialist. 1915;31:1–295. German.
103. El-Mokadem EAE-H. Measurement of I.P.D. in Different Age Groups of Egyptians [Ophthalmology MS Thesis]. Mansoura University; 1987.
104. Rasengane TA, Carlson AS. Corneal curvature and interpupillary distance measurements in a South African rural black population. Optom Vis Sci. 2001;78(12):85. doi:10.1097/00006324-200112001-00118
105. McAlister WH, Wingert TA, Farris JC. Prevalence of ametropia in Ugandan soldiers. Mil Med. 2002;167(10):801–802. doi:10.1093/milmed/167.10.801
106. Ruiz-Alcocer J, Madrid-Costa D, Perez-Vives C, Domin-Guez A, Gonzalez-Meijome JM. Interpupillary distance and head circumference in a Mozambican population. Atti Della Fandazione Giogio Ranchi. 2011;6:707–714.
107. Siraj H, Saleem M. Ophthalmology national normative database series (3): normal ranges of interorbital anthropometric values in healthy Sudanese adults. Al-Basar Int J Ophthalmol. 2017;4(1):23–30. doi:10.4103/1858-6538.205802
108. Halladay AC, Thandiwe M, Ayerakwah P, Dennis S, Joshua M, George K. Ophthalmic anthropometry of an urban Malawian population. Cogent Med. 2019;6:1. doi:10.1080/2331205X.2019.1614287
109. Elrazky MK, Abdallah TM, Roshdy MM, Farweez YAT. Survey of interpupillary distance in Egyptian People. QJM Int J Med. 2020;113(Supplement1):
110. Mhaleni VC, Maponya MB, Ramakatsa LND, Mahlakwana L, Mathebula SD. Interpupillary distance measurements for the African population of Polokwane in Limpopo province, South Africa. Afr Vision Eye Health. 2021;80(1):a582.
111. Samuel K, Selassie T, Michael K, Evans A. Ophthalmic anthropometry among rural dwellers in Mashonaland Central Province, Zimbabwe. Rwanda J Med Health Sci. 2021;4(1):99–111. doi:10.4314/rjmhs.v4i1.8
112. Osuobeni EP, Faden FK. Interpupillary distance of females of Arab origin. Optom Vis Sci. 1993;70(3):244–247. doi:10.1097/00006324-199303000-00012
113. Osuobeni EP, al-Gharni SS. Ocular and facial anthropometry of young adult males of Arab origin. Optom Vis Sci. 1994;71(1):33–37. doi:10.1097/00006324-199401000-00007
114. al-el-Sheikh HM, al-Athel MS. The relationship of interalar width, interpupillary width and maxillary anterior teeth width in Saudi population. Odontostomatol Trop. 1998;21(84):7–10.
115. Evereklioğlu C, Doğanay S, Er H, Gunduz A. Distant and near interpupillary distance in 3448 male and female subjects. Turgut Özal Tip Merkezi Dergisi. 1999;6:84–91.
116. Evereklioglu C, Doganay S, Er H, et al. Craniofacial anthropometry in a Turkish population. Cleft Palate Craniofac J. 2002;39(2):208–218. doi:10.1597/1545-1569_2002_039_0208_caiatp_2.0.co_2
117. Bozkir MG, Karakaş P, Oĝuz O. Measurements of soft tissue orbits in Turkish young adults. Surg Radiol Anat. 2003;25(1):54–57. doi:10.1007/s00276-002-0092-8
118. Kassab NH. The selection of maxillary anterior teeth width in relation to facial measurements at different types of face form. Al–Rafidain Dent J. 2004;5(1):15–23. doi:10.33899/rden.2004.45506
119. Bayani L, Tari AS, Doust KH, Kasaei A. The bony interorbital distance and orbital measurements in the Iranian Population: a CT Study. Iranian J Radiol. 2006;3:173–177.
120. Oztürk F, Yavas G, Inan UU. Normal periocular anthropometric measurements in the Turkish population. Ophthalmic Epidemiol. 2006;13(2):145–149. doi:10.1080/09286580500507220
121. Beden U, Ozarslan Y, Oztürk HE, Sönmez B, Erkan D, Oge I. Exophthalmometry values of Turkish adult population and the effect of age, sex, refractive status, and Hertel base values on Hertel readings. Eur J Ophthalmol. 2008;18(2):165–171. doi:10.1177/112067210801800201
122. Ozsoy U, Demirel BM, Yildirim FB, Tosun O, Sarikcioglu L. Method selection in craniofacial measurements: advantages and disadvantages of 3D digitization method. J Craniomaxillofac Surg. 2009;37(5):285–290. doi:10.1016/j.jcms.2008.12.005
123. Aksu M, Kaya D, Kocadereli I. Reliability of reference distances used in photogrammetry. Angle Orthod. 2010;80(4):482–489. doi:10.2319/070309-372.1
124. MahdavIzadi Z, AzangouKhiavi H, Dadpour Y. Relationship between the mesiodistal width of maxillary central incisor and interpupillary distance. J Mash Dent Sch. 2010;34(1):1–6.
125. Fesharaki H, Rezaei L, Farrahi F, Banihashem T, Jahanbkhshi A. Normal interpupillary distance values in an Iranian population. J Ophthalmic Vis Res. 2012;7(3):231–234.
126. Alanazi SA, Alanazi MA, Osuagwu UL. Influence of age on measured anatomical and physiological interpupillary distance (far and near), and near heterophoria, in Arab males. Clin Ophthalmol. 2013;7:711–724. doi:10.2147/OPTH.S43626
127. Aslankurt M, Aslan L, Aksoy A, Ozdemir M, Dane S. Laterality does not affect the depth perception, but interpupillary distance. J Ophthalmol. 2013;2013:485059. doi:10.1155/2013/485059
128. Güdek MA, Uzun A. Anthropometric measurements of the orbital contour and canthal distance in young Turkish. J Anat S India. 2015;64(Suppl):1–6. doi:10.1016/j.jasi.2014.09.007
129. Yildirim Y, Sahbaz I, Kar T, et al. Evaluation of interpupillary distance in the Turkish population. Clin Ophthalmol. 2015;9:1413–1416. doi:10.2147/OPTH.S85584
130. Al-Kaisy N, Garib BT. Selecting maxillary anterior tooth width by measuring certain facial dimensions in the Kurdish population. J Prosthet Dent. 2016;115(3):329–334. doi:10.1016/j.prosdent.2015.08.012
131. Direk FK, Deniz M, Uslu AI, Doğru S. Anthropometric analysis of orbital region and age-related changes in adult women. J Craniofac Surg. 2016;27(6):1579–1582. doi:10.1097/SCS.0000000000002814
132. Moravej R, Sahihalnasab SS. Evaluating the pupillary distance in an Iranian population and its relation with age, sex and refractive errors. J Ophthalm Optom Sci. 2017;1(5):17–22. doi:10.22037/joos.v1i5.28010
133. Ozdemir T, Can FE, Isiklar S, Ercan I, Cankur NS. Periorbital soft tissue anthropometric analysis of young adults. J Craniofac Surg. 2017;28(4):e311–e318. doi:10.1097/SCS.0000000000003558
134. Majeed MI, Haralur SB, Khan MF, Al Ahmari MA, Al Shahrani NF, Shaik S. An anthropometric study of cranio-facial measurements and their correlation with vertical dimension of occlusion among Saudi Arabian Subpopulations. Open Access Maced J Med Sci. 2018;6(4):680–686. doi:10.3889/oamjms.2018.082
135. Rajabi MT, Borjian MA, Hosseini SS, Rajabi MB, Hosseinzadeh F, Mohammadi SS. Orbital radiologic parameters of non-syndromic exorbitism patients in comparison with normal population. J Curr Ophthalmol. 2019;31(4):432–437. doi:10.1016/j.joco.2019.08.001
136. Sahbaz I. Assessment of interpupillary distance in the Azerbaijan society. J Craniofac Surg. 2020;31(5):1199–1201. doi:10.1097/SCS.0000000000006336
137. Sahbaz I. A comparison of interpupillary distances between Turkish and Azerbaijani populations. Research Square; 2020 [Preprint]. doi:10.21203/rs.3.rs-20461/v1.
138. Bahşi I, Orhan M, Kervancioğlu P, Karatepe Ş, Sayn S. Craniofacial anthropometry of healthy Turkish young adults: outer canthal, inner canthal, palpebral fissure, and interpupillary distances. J Craniofac Surg. 2021;32(5):1906–1909. doi:10.1097/SCS.0000000000007240
139. Gantz L, Shneor E, Doron R. Agreement and inter-session repeatability of manual and automatic interpupillary distance measurements. J Optom. 2021;14(4):299–314. doi:10.1016/j.optom.2020.08.010
140. Moradi A, Haghparast A, Aghajani F, et al. Comparison of three methods of measuring the inter-pupillary distance. J Ophthalm Optom Sci. 2022;6(3):7–14.
141. Ozdemir F, Golpinar M, Nahir M, Sahin B. Anthropometric periocular soft tissue analysis from preadolescence to young adulthood: photogrammetric measurements. J Craniofac Surg. 2022;33(7):2045–2048. doi:10.1097/SCS.0000000000008504
142. Alshamri HA, Al Moaleem MM, Al-Huthaifi BH, et al. Correlation between maxillary anterior teeth and common facial measurements. Clin Cosmet Investig Dent. 2023;15:289–300. doi:10.2147/CCIDE.S438302
143. Hatipoğlu FP, Arıcıoğlu B, Hatipoğlu Ö, Köse TE, Günaçar DN. Prediction of root canal lengths and pulp volume of the maxillary permanent first molar based on stature, crown diameters, and facial morphometry. Anat Sci Int. 2023;98(3):454–462. doi:10.1007/s12565-023-00727-5
144. Abbas HF, Hashim ZS, Abd-Alhassan TH, Isaa HM. The relationship between interpupillary distance and maxillary central incisors width in young persons in Al-Furat Al-Awsat. Hilla, Iraq: Ministry of Higher Education and Scientific Researchers University of Babylon, College of Dentistry, Bachelor’s Degree in Dentistry; 2024. Available from: https://cdnx.uobabylon.edu.iq/undergrad_projs/A31qoeEpdEm6HeciUjfQhw.pdf.
145. Eltahir MA, Alnasser I, Aljaber S. Interpupillary and intercanthal distance values among females in AL-Qassim Region, KSA: a Cross-sectional study. Saudi J Oral Sci. 2024;11(1):11–15. doi:10.4103/sjoralsci.sjoralsci_73_23
146. Singh JR, Banerjee S. Normal values for interpupillary, inner canthal and outer canthal distances in an Indian population. Hum Hered. 1983;33(5):326–328. doi:10.1159/000153399
147. Gupta VP, Sodhi PK, Pandey RM. Normal values for inner intercanthal, interpupillary, and outer intercanthal distances in the Indian population. Int J Clin Pract. 2003;57(1):25–29. doi:10.1111/j.1742-1241.2003.tb11392.x
148. Bali J, Chaudhary KP, Thakur R. High altitude and the eye: a case controlled study in clinical ocular anthropometry of changes in the eye. High Alt Med Biol. 2005;6(4):327–338. doi:10.1089/ham.2005.6.327
149. Patil SB, Kale SM, Math M, Khare N, Sumeet J. Anthropometry of the eyelid and palpebral fissure in an Indian population. Aesthet Surg J. 2011;31(3):290–294. doi:10.1177/1090820X11398475
150. Hussain W, Qamar K, Naeem S. The role of interpupillary distance in the selection of anterior teeth. Pak Oral Dent J. 2012;32(1):165–169.
151. Kini AY, Angadi GS. Biometric ratio in estimating widths of maxillary anterior teeth derived after correlating anthropometric measurements with dental measurements. Gerodontology. 2013;30(2):105–111. doi:10.1111/j.1741-2358.2012.00648.x
152. Sharma S, Nagpal A, Verma PR. Correlation between facial measurements and the mesiodistal width of the maxillary anterior teeth. Indian J Dental Sci. 2012;4(3):20–24.
153. Purkait R. Growth pattern of the eye from birth to maturity: an Indian study. Aesthetic Plast Surg. 2013;37(1):128–134. doi:10.1007/s00266-012-0010-3
154. Ladda R, Kasat VO, Bhandari AJ. A new technique to determine vertical dimension of occlusion from anthropometric measurement of interpupillary distance. J Clin Exp Dent. 2014;6(4):e395–399. doi:10.4317/jced.51671
155. Nazir S, Zargar NM, Khurshaid SZ, Shah AF, Mir S, Rashid R. The selection of maxillary anterior teeth width in Kashmiri population. J Orofac Res. 2015;5(2):40–42. doi:10.5005/jp-journals-10026-1175
156. Alkhairy S, Siddigui F, Hassan M. Orbitofacial anthropometry in a Pakistani population. Pak J Ophthalmol. 2016;32(1):41–47.
157. Gupta R, Luthra RP, Sharma A. A comparative evaluation of the inter-relationship between inner-canthal distance, inter-alar width and inter-pupillary distance with respect to intercanine width amongst the population of Himachal Pradesh. J Adv Med Dent Scie Res. 2016;4(6):186–192.
158. Arshad A, Qasim MS, Mujahid M. Effect of spectacle centration on stereo acuity: a hospital-based study at Madinah Teaching Hospital, Faisalabad, Pakistan. Ophthalmol Pak. 2019;9(3):27–31.
159. Ayoub W, Rashid R. Novel technique to determine vertical dimension of occlusion from interpupillary distance in Kashmiri population. Int J Eng Sci Comp. 2017;7:14955–14957.
160. Bangar B, Nakade PL, Jankar A, Kamble S. Correlation between intercanthal, interpupillary, interalar, and intercommissural distance with the mesiodistal width of the maxillary anteriors: an in vivo study. Int J Prosthodont Rest Dent. 2017;7(4):109–113.
161. Batool Z, Mahmood W, Khan UW. Influence of age and gender on interpupilary distance and comparison of Pd ruler and auto refractrometer values of interpupilary distance. Int J Adv Res Ideas Innov Technol. 2017;3:177–179.
162. Shah DS, Vaishnav K, Panchal D, Duseja S, Shah MU. An anthropological study to evaluate correlation between occlusal vertical dimension and other facial measurements. J Res Adv Dent. 2017;6(1s):159–165.
163. Saifullah M, Sadiqulla, Mutahir S, Inam K, Amin F. Assessment of inter-pupillary distance amongst age group of 15–75 years visiting eye OPD at Hayatabad Medical Complex, Peshawar. Ophthalmol Update. 2018;16(3):817–820.
164. Hayat N, Alkhairy S, Cheema A, Ehsan M, Khan MA. Normal interpupillary, inner canthal distance and outer canthal distance in a normal population of Pakistan. Pak J Med Sci. 2019;35(1):50–54. doi:10.12669/pjms.35.1.288
165. Rattan S, Devinder A, Shreya A, et al. Facial width and inter-pupillary distance-a useful tool for superimposition technique. Medico Legal Update. 2019;19(2):34–37. doi:10.5958/0974-1283.2019.00139.7
166. Gupta P, Gupta S, Garg H. Analysis of periocular anthropometric characteristics amongst north Indian adults. J Adv Med Dent Scie Res. 2020;8(10):115–118.
167. Dhinsa JB, Mittal S, Sukhija U, Ranjan R, Jamwal M, Monica M. Evaluation of relation between extraoral facial measurement and mesiodistal width of the anterior teeth. Int J Cur Res Rev. 2021;13(14):21–27. doi:10.31782/IJCRR.2021.131430
168. Sarathi D, Gheena S, Sandhya S. Comparison of interpupillary distance between different ethnicities - a cross-sectional observational study. Nat Volatiles Essent Oils. 2021;8(5):8589–8596.
169. Bhalla AK, Kaur H, Kaur R. Detection of ocular hypertelorism among Indian children. Indian J Med Res. 2022;155(3&4):364–372. doi:10.4103/ijmr.IJMR_758_20
170. Ahmed N, Halim MS, Ab-Ghani Z, et al. The analysis of facio-dental proportions to determine the width of maxillary anterior teeth: a clinical study. J Clin Med. 2022;11(24):7340. doi:10.3390/jcm11247340
171. Malik TG, Moin M, Afzal MA, Akhtar FK, Alam R. Orbital and periorbital anthropometric variations and effect of age and gender on these variables. Ophthalmol J. 2022;7:61–64. doi:10.5603/OJ.2022.0009
172. Poonia PS, Patel IB, Patel SP, Doshi P, Shah R, Santosh K. Identification of reliable extraoral anatomical landmarks in relation to maxillary canines in dentulous subjects: an in vivo study. J Pharm Negat Results. 2022;13(S5):3029–3039. AND: Poonia PS, Patel IB, Patel SP, Doshi P, Shah R, Santosh K. Identification of reliable extraoral anatomical landmarks in relation to maxillary canines in dentulous subjects: an in vivo study. J Coast Life Med. 2023;11:1095–1106. [Duplicate Publication].
173. Kamboj E, Garg S, Kalra N. Facial measurements and their correlation with vertical dimension of occlusion in dentate subjects: an anthropometric analysis. J Clin Diagn Res. 2023;17(11):ZC06–09.
174. Anitha KV, Balasaranya AM, Mohammed Asiya MA. Anatomical guidelines for the selection of width of maxillary anterior and a single central incisor – a clinical study. SRM Univ J Dent Sci. 2011;2:181–185.
175. Packiriswamy V, Kumar P, Rao KG. Photogrammetric analysis of palpebral fissure dimensions and its position in Malaysian South Indian ethnic adults by gender. N Am J Med Sci. 2012;4(10):458–462. doi:10.4103/1947-2714.101984
176. Vasanthakumar P, Kumar P, Rao M. Anthropometric analysis of palpebral fissure dimensions and its position in South Indian ethnic adults. Oman Med J. 2013;28(1):26–32. doi:10.5001/omj.2013.06
177. Mostafa A, Banu LA, Sultana A. Periocular anthropometric study among adult Bangladeshi Buddhist Chakma females. J Med Allied Sci. 2014;4(1):28–34.
178. Shivhare P, Shankarnarayan L, Basavaraju SM, Gupta A, Vasan V, Jambunath U. Intercanine width as a tool in two dimensional reconstruction of face: an aid in forensic dentistry. J Forensic Dent Sci. 2015;7(1):1–7. doi:10.4103/0975-1475.150290
179. Narain A. Determining The Mesio Distal Width of Maxillary Central Incisor Among Davangere Population by Correlating The Inner Canthal Distance and Interpupillary Distance to Geometric Proportion and Biometric Width Respectively An- In Vivo Study [Dissertation]. Karnataka, Bangalore: Rajiv Gandhi University of Health Sciences; 2016.
180. Banu R, Dandekeri S, Shenoy KK, Shetty S, Bhat V, Ragher M. An in vivo study to compare and evaluate the correlation of the facial measurements with the combined mesiodistal width of the maxillary anterior teeth between males and females. J Pharm Bioallied Sci. 2017;9(Suppl 1):S127–S131. doi:10.4103/jpbs.JPBS_123_17
181. Barman J, Serin S. Comparison of interpupillary distance and combined mesiodistal width of maxillary central incisor teeth in two ethnic groups of Northeast India: an in vivo study. Indian J Dent Res. 2018;29(2):155–160. doi:10.4103/ijdr.IJDR_782_16
182. Sasidharan S. Relation Between Combined Width of Maxillary Anterior Teeth and Interpupillary Width, Intercommissural Width among Dentate Dakshina Kannada Population - An In-Vivo Study [Dissertation]. Bengaluru, Karnataka, India: Rajiv Gandhi University of Health Sciences; 2019.
183. Sivaranjani S, Mohan VK, Nimoshini G, Divya B, Vasanthi V, Ramadoss R. Morphogenic correlation between facial form and intercanine width - an aid in forensic dentistry. SRM J Res Dental Sci. 2021;12(1):22–26. doi:10.4103/srmjrds.srmjrds_105_20
184. Yu P, Nathan P, Meng CS. Periocular anthropometry of normal Chinese and Indian Populations in Singapore. JOJ Ophthal. 2019;07(5):555722. doi:10.19080/JOJO.2019.07.555722
185. Nehaapriya R, Bhaskaran B, Ikram SS, Divya N, Panimalar V, Veeramani A. A study to compare the accuracy of interpupillary distance measured using interpupillary distance ruler with that of neidek autorefractometer. Int J Res Pharm Sci. 2020;11(SPL4):2336–2339. doi:10.26452/ijrps.v11iSPL4.4465
186. Rupashri SV, Goundar R. Correlation of maxillary canine position with commissure of lip and interpupillary varying distance. Int J Res Trends Innov. 2020;5(2):116–121.
187. Deepasakthi J, Gheena S. Comparison of Inter pupillary distance and Mesiodistal width of central incisors among genders-an observational study. Nat Volatiles Essent Oils. 2021;12:7229–7237.
188. Shetty SK, Malli P, D’Souza J, Shenoy K, Chunduri ST, Fernandes K. Inner canthal distance, inter pupillary width, and golden proportion, as predictors of width of the maxillary central incisors--an in vivo study. J Evol Med Dent Sci. 2021;10(22):1650–1656. doi:10.14260/jemds/2021/343
189. Girimallanavar SV, Nayak VI, Chetty S, Vasundhara C. Correlation between interpupillary distance, inner-outer canthal distance and inter limbal distance: a cross-sectional study. J Clin Diagn Res. 2022;16(3):NC01–NC04.
190. Singh AD, Vannadil H, Bhatta S. Normative value of accommodative convergence to accommodation in Indian population measured by heterophoria method. J Mar Med Soc. 2023;26(1):58–61. doi:10.4103/jmms.jmms_177_22
191. Bandhu SD, Pawar SA, Garg S, Yukta RM, Rahman MHU. The distribution of near point of convergence, near point of accommodation and their association with interpupillary distance in young adults - A cross sectional study. IP Int J Ocul Oncol Oculoplasty. 2023;9(3):122–125. doi:10.18231/j.ijooo.2023.027
192. Fung BW. [The standard value of the morphology of the eyes of the Chinese]. Chin J Opthalmol. 1964;11:101–105. Chinese.
193. White RM. Anthropometric Survey of the Royal Thai Armed Forces. Washington, DC: Advanced Research Projects Agency; 1964:68.
194. White RM. Anthropometric Survey of the Armed Forces of the Republic of Vietnam. Washington, DC: Advanced Research Projects Agency; 1964:68.
195. Nakagawa T, Shiga M, Okawa T, Takeda M. Growth of palpebral fissure, inner-medial canthal distance, pupillary distance, and levator function in normal Japanese. Jpn J Clin Ophthalmol. 1974;28:689–692.
196. Park YK, La TK. Interpupillary distance and inter-inner canthal distance of Koreans. J Korean Ophth Soc. 1975;16(4):371–374.
197. Sun CL. A statistical study on the configuration of the palpebral fissures and pupillary distance among healthy male youths. Chin J Ophthalmol. 1979;15:201–203. Chinese.
198. Wang JL, Chang CX, Liu CX, Lu HM. [A statistical analysis of the interpupillary distance in 2,044 subjects (author’s transl)]. Zhonghua Yan Ke Za Zhi. 1981;17(4):245. Chinese.
199. Kim CJ, Ham KS, Kim Y, Cho YJ. A facial anthropometric study on the Korean youths. J Korean Soc Plast Reconstr Surg. 1988;15(5):427–436.
200. Quant JR, Woo GC. Normal values of eye position in the Chinese population of Hong Kong. Optom Vis Sci. 1992;69(2):152–158. doi:10.1097/00006324-199202000-00009
201. Quant JR, Woo GC. Eye position and head size in the Chinese population: a comparison of the Chinese from Hong Kong with the Chinese from Guangdong Province. Optom Vis Sci. 1992;69(10):793–796. doi:10.1097/00006324-199210000-00008
202. Cho JH, Han KH, Kang JS. Normal anthropometric values and standardized templates of Korean face and head. Korean Soc Aesthetic Plast Surg. 1993;20(5):995–1005.
203. Hwang K, Ough MH, Baik SH. Morphometrical study of interocular distances in Korean adults. J Korean Soc Plast Reconstr Surg. 1996;23(01):9–19. Korean.
204. Tang CY, Tang N, Stewart MC. Ophthalmic anthropometry for Hong Kong Chinese adults. Optom Vis Sci. 1998;75(4):293–301. doi:10.1097/00006324-199804000-00028
205. Song CH, Ahn KY, Han DC, Park DH. The age-related anthropometric analysis of eyelids and orbits in Koreans. J Korean Soc Plast Reconstr Surg. 1999;26(6):1131–1137.
206. Ngeow WC, Akan A, George JM. The intercanthal and interpupillary distances in KadazanDusun in Malaysia. Malaysian J Oral Maxillofac Surg. 2006;4(1):8–11. doi:10.4103/MJOMS_200641_8
207. Al Junid ST, Ngeow WC. The intercanthal and interpupillary distances of three major ethnics in Malaysia. Malaysian J Oral Maxillofacial Surg. 2007;5(1):3–5. doi:10.4103/MJOMS_200751_3
208. Du L, Zhuang Z, Guan H, et al. Head-and-face anthropometric survey of Chinese workers. Ann Occup Hyg. 2008;52(8):773–782. doi:10.1093/annhyg/men056
209. Lee HJ, Park SJ. Comparison of Korean and Japanese head and face anthropometric characteristics. Hum Biol. 2008;80(3):313–330. doi:10.3378/1534-6617-80.3.313
210. Park DH, Choi WS, Yoon SH, Song CH. Anthropometry of Asian eyelids by age. Plast Reconstr Surg. 2008;121(4):1405–1413. doi:10.1097/01.prs.0000304608.33432.67
211. Isa ZM, Tawfiq OF, Noor NM, Shamsudheen MI, Rijal OM. Regression methods to investigate the relationship between facial measurements and widths of the maxillary anterior teeth. J Prosthet Dent. 2010;103(3):182–188. doi:10.1016/S0022-3913(10)60028-5
212. Preechawai P. Anthropometry of eyelid and orbit in four southern Thailand ethnic groups. J Med Assoc Thai. 2011;94(2):193–199.
213. Eom Y, Song JS, Ahn SE, et al. Effects of interpupillary distance on stereoacuity: the Frisby Davis distance stereotest versus a 3-dimensional distance stereotest. Jpn J Ophthalmol. 2013;57(5):486–492. doi:10.1007/s10384-013-0253-9
214. Takahashi Y, Kakizaki H. Horizontal eye position in thyroid eye disease: a retrospective comparison with normal individuals and changes after orbital decompression surgery. PLoS One. 2014;9(12):e114220. doi:10.1371/journal.pone.0114220
215. Mishra MK, Singh RK, Suwal P, Parajuli PK, Shrestha P, Baral D. A comparative study to find out the relationship between the inner inter-canthal distance, interpupillary distance, inter-commissural width, inter-alar width, and the width of maxillary anterior teeth in Aryans and Mongoloids. Clin Cosmet Investig Dent. 2016;8:29–34. doi:10.2147/CCIDE.S87837
216. Lin YC, Chen CP. Characterization of small-to-medium head-and-face dimensions for developing respirator fit test panels and evaluating fit of filtering facepiece respirators with different faceseal design. PLoS One. 2017;12(11):e0188638. doi:10.1371/journal.pone.0188638
217. Lu TY, Kadir K, Ngeow WC, Othman SA. The prevalence of double eyelid and the 3D measurement of orbital soft tissue in Malays and Chinese. Sci Rep. 2017;7(1):14819. doi:10.1038/s41598-017-14829-4
218. Hwang H, Kang D. User-friendly inter-pupillary distance calibration method using a single camera for autostereoscopic 3D displays. In:
219. Kim YC, Kwon JG, Kim SC, et al. Comparison of periorbital anthropometry between beauty pageant contestants and ordinary young women with Korean ethnicity: a three-dimensional photogrammetric analysis. Aesthetic Plast Surg. 2018;42(2):479–490. doi:10.1007/s00266-017-1040-7
220. Rokaya D, Suttagul K, Sapkota B, Maharjan SK. Gender based comparison of the relationships of maxillary anterior teeth and facial measurements. J Int Dent Med Res. 2018;11(2):465–469.
221. Mishra S, Mathema SRB. Determining the position of tip of maxillary canines in relation to commissure of mouth and midpupillary line and its correlation with square, ovoid and tapering arch form. J Nepal Prosthodont Soc. 2019;2(1):11–16. doi:10.3126/jnprossoc.v2i1.26807
222. Sano I, Takahashi H, Inoda S, et al. Shortening of interpupillary distance after instillation of topical prostaglandin analog eye drops. Am J Ophthalmol. 2019;206:11–16. doi:10.1016/j.ajo.2019.03.013
223. Jung HB, Han DG, Shim JS, Lee YJ, Kim SE. Comparison of eye measurements between young Korean women with inborn double eyelids and those with single eyelids. Arch Aesthetic Plast Surg. 2020;26(1):7–11. doi:10.14730/aaps.2019.01984
224. Aziz NIA, Che Mohd N, Baharuddin IH, et al. The relationship of facial measurements with the mesiodistal width of the maxillary anterior teeth. J Dentistry Indonesia. 2021;28(3):158–162.
225. Husna HN, Fitriani N. Evaluation of Pupillary Distance (PD) measurement using smartphone-based pupilometer. J Phys Conf Ser. 2022;2243(1):012001. doi:10.1088/1742-6596/2243/1/012001
226. Lim YC, Abdul Shakor AS, Mohamad N, et al. Head and face anthropometric study for respirators in the multi-ethnic Asian population of Malaysia. Front Public Health. 2022;10:972249. doi:10.3389/fpubh.2022.972249
227. Tuladhar SL, Manandhar P, Thapa N, Pradhan D, Parajuli U. Evaluation of the relationship between the interpupillary distance and mesiodistal width of maxillary anterior teeth in Nepalese population. J Gandaki Med Coll Nepal. 2023;16(2):80–83. doi:10.3126/jgmcn.v16i2.59393
228. Xu Y, Deng J, Zhang B, et al. Higher-order aberrations and their association with axial elongation in highly myopic children and adolescents. Br J Ophthalmol. 2023;107(6):862–868. doi:10.1136/bjophthalmol-2021-319769
229. Hor P, Chu BS. Differences and reliability evaluation of interpupillary distance according to various measurement methods. Korean J Vis Sci. 2023;25(4):421–426. doi:10.17337/JMBI.2023.25.4.421
230. Alberto AF, Soriano R. Periocular measurements among Filipino adult employees of Dr. Paulino J Garcia Memorial Research and Medical Center. Philippine J Otolaryngol Head Neck Surg. 2024;39(1):36–40. doi:10.32412/pjohns.v39i1.2113
231. Laher S, Masihuzzaman M, Sah SK, Sarkhel S, Pattnaik A, Kumari A. A study in normative data of interpupillary distance between Aryans & Mongolians race in Dang Valley. Educ Admin Theory Pract. 2024;30(6):2568–2575. doi:10.53555/kuey.v30i6.5653
232. Wang J, Li FL, Yang HX, Li LM. Correlation between different points on the face and the width of maxillary anterior teeth. Heliyon. 2024;10(6):e27642. doi:10.1016/j.heliyon.2024.e27642
233. Bridgman JB. Intercanthal and interpupillary distance in New Zealand Maori and Samoan populations. University of Otago, School of Dentistry; 1999. Thesis. Available from: http://adt.otago.ac.nz./public/adt-NZDU20070524.122205.
234. Swan LK, Stephan CN. Estimating eyeball protrusion from body height, interpupillary distance, and inter-orbital distance in adults. J Forensic Sci. 2005;50(4):774–776. doi:10.1520/JFS2004534
235. Ellakwa A, McNamara K, Sandhu J, et al. Quantifying the selection of maxillary anterior teeth using intraoral and extraoral anatomical landmarks. J Contemp Dent Pract. 2011;12(6):414–421. doi:10.5005/jp-journals-10024-1069
236. Kolose S. New Zealand Defense Force Anthropometry Survey: Variations in Kinanthropometry and Implications for the New Zealand Defense Force [PhD Thesis]. Auckland University of Technology; 2021.
237. Rana K, Beecher MB, Caltabiano C, Zhao Y, Verjans J, Selva D. Normal periocular anthropometric measurements in an Australian population. Int Ophthalmol. 2023;4:1–7.
238. McAnally K, Grove P, Wallis G. Vergence eye movements in virtual reality. Displays. 2024;83:102683. doi:10.1016/j.displa.2024.102683
239. Fanning GS. Vision in children with Down’s syndrome. Aust J Optom. 1971;54(3):74–82. doi:10.1111/j.1444-0938.1971.tb00128.x
240. Davenport CB, Steggerda M. Race Crossing in Jamaica. Washington: Carnegie Institute Publication; 1929.
241. Lucas WP, Pryor HB. Range and standard deviations of certain physical measurements in healthy children. J Pediatr. 1935;6(4):533–545. doi:10.1016/S0022-3476(35)80040-1
242. Hertzberg THE, Daniels GS, Churchill E. Anthropometry of Flying Personnel - 1950. Wright Air Development Center Technical Report No 52–321. Ohio: Wright-Patterson Air Force Base; 1953.
243. White RM, Churchill E. The body size of soldiers. US Army Anthropometry - 1966. US Army Natick Laboratories; Technical Report 72-51-CE. 1971.
244. Backman H. Interpupillary distance measurements. Am J Optom Arch Am Acad Optom. 1972;49(3):264–266. doi:10.1097/00006324-197203000-00009
245. Hofstetter HW. Normal values of interpupillary distance. J Am Optometric Assoc. 1972;43:1151–1155.
246. White RM, Churchill E. United States Marine Corps Anthropometry - 1966. United States Army Natick Research and Development Center; Technical Report Matick/TR 78/021. 1977.
247. Jaeger EA. Ocular findings in Down’s syndrome. Trans Am Ophthalmol Soc. 1980;78:808–845.
248. Bogren HG, Franti CE, Wilmarth SS. Normal variations of the position of the eye in the orbit. Ophthalmology. 1986;93(8):1072–1077. doi:10.1016/s0161-6420(86)33618-2
249. Young JW. Head and face anthropometry of adult U.S. citizens. Oklahoma City, OK: Civil Aeromedical Institute, Federal Aviation Administration; 1993.
250. Farkas LG, Hreczko TA, Katic MJ. Craniofacial norms in North American Caucasians from birth to young adulthood. In: Farkas LG, editor. Anthropometry of the Head and Face.
251. Nanda RS, Ghosh J. Facial soft tissue harmony and growth in orthodontic treatment. Semin Orthod. 1995;1(2):67–81. doi:10.1016/s1073-8746(95)80094-8
252. Hall WR, Bergstrom AW. An Evaluation of the Relationship between Interpupillary Distance and Near Phoria [Thesis]. College of Optometry; 1996:1174.
253. Cole HP, Couvillion JT, Fink AJ, Haik BG, Kastl PR. Exophthalmometry: a comparative study of the Naugle and Hertel instruments. Ophthalmic Plast Reconstr Surg. 1997;13(3):189–194. doi:10.1097/00002341-199709000-00005
254. Barretto RL, Mathog RH. Orbital measurement in black and white populations. Laryngoscope. 1999;109:1051–1054. doi:10.1097/00005537-199907000-00007
255. Pivnick EK, Rivas ML, Tolley EA, Smith SD, Presbury GJ. Interpupillary distance in a normal black population. Clin Genet. 1999;55(3):182–191. doi:10.1034/j.1399-0004.1999.550306.x
256. Bradtmiller B, Friess M. A head-and-face anthropometric survey of US respirator users. Yellow Springs, OH: Anthrotech; 2004. Available from: https://www.nap.edu/resource/11815/Anthrotech_report.pdf.
257. Mangan B, Angel H. Human Factors Plan: 2012 Canadian Forces Anthropometric Survey (CFAS). DRDC – Toronto Research Centre; 2011. Available from: https://publications.gc.ca/collections/collection_2019/rddc-drdc/D68-3-055-2018-eng.pdf.
258. Gordon CC, Blackwell CL, Bradtmiller B, et al. 2012 anthropometric survey of US army pilot personnel: methods and summary statistics. Army Natick Soldier Research Development and Engineering Center MA, Tech. Rep. NATICK/TR-16/013. 2016.
259. Lyle WM, Woodruff ME, Zuccaro VS. A review of the literature on Down’s syndrome and an optometrical survey of 44 patients with the syndrome. Am J Optom Arch Am Acad Optom. 1972;49(9):715–727. doi:10.1097/00006324-197209000-00003
260. Krinsky-McHale SJ, Silverman W, Gordon J, Devenny DA, Oley N, Abramov I. Vision deficits in adults with Down syndrome. J Appl Res Intellect Disabil. 2014;27(3):247–263. doi:10.1111/jar.12062
261. Herskovits MJ. Growth of interpupillary distance in American Negroes. Am J Phys Anthropol. 1926;9(4):467–470. doi:10.1002/ajpa.1330090421
262. Murphy WK, Laskin DM. Intercanthal and interpupillary distance in the black population. Oral Surg Oral Med Oral Pathol. 1990;69(6):676–680. doi:10.1016/0030-4220(90)90346-t
263. Gordon CC, Blackwell CL, Bradtmiller B, et al. 2012 anthropometric survey of US army personnel: methods and summary statistics. Army Natick Soldier Research Development and Engineering Center MA, Tech. Rep. 2014.
264. Murray NP, Hunfalvay M, Bolte T. The reliability, validity, and normative data of interpupillary distance and pupil diameter using eye-tracking technology. Transl Vis Sci Technol. 2017;6(4):2. doi:10.1167/tvst.6.4.2
265. Kawagoe W, Vasques DG, Maia N, Campos M, Chamon W. Comparação entre métodos de medida da distância interpupilar [Comparison of methods for measuring the interpupillary distance]. Arq Bras Oftalmol. 1998;61(2):172–175. Portuguese. doi:10.5935/0004-2749.19980075
266. Gomes VL, Gonçalves LC, Do Prado CJ, Junior IL, De Lima Lucas B. Correlation between facial measurements and the mesiodistal width of the maxillary anterior teeth. J Esthet Restor Dent. 2006;18(4):196–205. doi:10.1111/j.1708-8240.2006.00019_1.x
267. Roehe DV, Arruda Júnior JR. Comparative study between two measurement methods of interpupillary distance. Rev Bras Oftalmol. 2008;67:63–68. doi:10.1590/S0034-72802008000200003
268. Arenas E, Muñoz D, Matheus E, Morales D. Nasopupillary asymmetry. Sci World J. 2014;2014:347826. doi:10.1155/2014/347826
269. da Cunha CM, Correia RJB. Interpupillary distance and convergence in the presbyopic population. Rev Bras Oftalmol. 2015;74(5):303–305. doi:10.5935/0034-7280.20150062
270. Saraf P, Viswanath S, Mehta S, Mathur S, Bhayana AA. Artificial reduction of inter-pupillary distance with indirect ophthalmoscope and effect on stereo-acuity. Indian J Ophthalmol. 2025;73(Suppl 1):S180–S181. doi:10.4103/IJO.IJO_1340_24
271. Lee AJ, Hibbs C, Wright MJ, Martin NG, Keller MC, Zietsch BP. Assessing the accuracy of perceptions of intelligence based on heritable facial features. Intelligence. 2017;64:1–8. doi:10.1016/j.intell.2017.06.002
272. Cho DH, Ham KS, Cho YJ. An anthropometric analysis on the beautiful and ugly faces of the young Koreans. Arch Plast Surg. 1989;16:926.
273. Rhee SC, Woo K, Kwon B. Biometric study of eyelid shape and dimensions of different races with references to beauty. Aesth Plast Surg. 2012;36:1236–1245. doi:10.1007/s00266-012-9937-7
274. Olivola CY, Funk F, Todorov A. Social attributions from faces bias human choices. Trends Cognit Sci. 2014;18(11):566–570. doi:10.1016/j.tics.2014.09.007
275. Coon CS, Garn SM, Birdsell JB. Races: A Study of the Problems of Race Formation in Man. Springfield, IL: Charles C Thomas; 1950:153.
276. Masters MP. Modern Variation and Evolutionary Change in the Hominin Eye Orbit [Dissertation]. The Ohio State University; 2008.
277. Brown CH. Chapters 1–10. Chapter 9: method of Examination. In: The Optician’s Manual. Vol. I. A Treatise on the Science and Practice of Optics. Philadelphia: The Keystone; 1902:183–294.
278. Panas F. Paralysies oculaires motrices d’origine traumatique [Traumatic oculomotor paralyses]. Arch D’opht. 1899;19:625–641. French.
279. Nordenson JW. Die Stellung der Seitenwaende der Augenhoehle beim Menschen in verschiedenen Lebensaltern [The position of the lateral walls of the orbit in humans at different ages]. Acta Chirurg Scand. 1920;52:45–54. German.
280. Pallin P. The biorbital angle and the position of the orbital walls at different ages: their significance to the appearance and disappearance of squint. Acta Ophthalmol. 1937;15(4):389–405. doi:10.1111/j.1755-3768.1937.tb07354.x
281. Kreiborg S, Cohen MM. Ocular manifestations of Apert and Crouzon syndromes: qualitative and quantitative findings. J Craniofac Surg. 2010;21(5):1354–1357. doi:10.1097/SCS.0b013e3181ef2b53
282. Rosenberg JB, Tepper OM, Medow NB. Strabismus in craniosynostosis. J Pediatr Ophthalmol Strabismus. 2013;50(3):140–148. doi:10.3928/01913913-20121113-02
283. Lee TC, Walker E, Ting MA, et al. The influence of orbital architecture on strabismus in craniosynostosis. J AAPOS. 2024;28(1):103812. doi:10.1016/j.jaapos.2023.10.006
284. Herron MS, Wang L, von Bartheld CS. Prevalence and types of strabismus in cerebral palsy: a global and historical perspective based on a systematic review and meta-analysis. Ophthalmic Epidemiol. 2025;32(2):125–142. doi:10.1080/09286586.2024.2331537
285. de Juan E, Hurley DP, Sapira JD. Racial differences in normal values of proptosis. Arch Intern Med. 1980;140(9):1230–1231. doi:10.1001/archinte.140.9.1230
286. Uchendu CR, Fasina O, Bekibele CO. Exophthalmometric values and periocular anthropometry among 10 to 18 year old Nigerians. Afr J Med Med Sci. 2017;46:377–383.
287. Luo WB, Deng YP. Measurement of Chinese people’s eyeball prominence and interorbital distance. Chinese J Ophthalmol. 1959;9(4):200–202. Chinese.
288. Zhao DL. Measurement of Chinese male adults’ eyeball prominence and interorbital distance (abstract). In:
289. Chen Q. An investigation into the prominence of the eyeball and orbital distance in the Li and Mao nationalities on Hainan Island. Chin J Ophthalmol. 1985;21:172–174. Chinese.
290. Cheung JJC, Chang DL, Chan JC, et al. Exophthalmometry values in the Hong Kong Chinese adult population from a population-based study. Medicine. 2019;98(47):e17993. doi:10.1097/MD.0000000000017993
291. Whitnall SE. The Anatomy of the Human Orbit and Accessory Organs of Vision. Oxford University Press; 1921.
292. Zaki AAH, Keeney AH. The bony orbital walls in horizontal strabismus. Arch Ophthalmol-Chic. 1957;57(3):418–424. doi:10.1001/archopht.1957.00930050430014
293. Lai YH, Wu WC, Wang HZ, Hsu HT. Extraocular muscle insertion positions and outcomes of strabismus surgery: correlation analysis and anatomical comparison of Western and Chinese populations. Br J Ophthalmol. 2012;96(5):679–682. doi:10.1136/bjophthalmol-2011-300632
294. Jeong HC, Ahn HB. [Comparison of orbital anatomy in Korean and Caucasian patients using computed tomography]. J Korean Ophthalmol Soc. 2015;56(9):1311–1315. Korean. doi:10.3341/jkos.2015.56.9.1311
295. Autifi MAH, Elsharkawy AM, Elkamshoshy AA, Kandeel MK. Anatomical variations of insertion and structure of transverse rectus muscles in Egyptian strabismic patients. Nat Sci. 2018;16(7):59–64.
296. Tsukui M, Yagasaki T, Yokoyama Y. Abnormal biorbital angle in children with infantile exotropia. Jpn J Ophthalmol. 2022;66(1):81–86. doi:10.1007/s10384-021-00881-1
297. Laughton SC, Hagen MM, Yang W, von Bartheld CS. Gender differences in horizontal strabismus: systematic review and meta-analysis shows no difference in prevalence, but gender bias towards females in the clinic. J Glob Health. 2023;13:04085. doi:10.7189/jogh.13.04085
298. Ozgen A, Aydingöz U. Normative measurements of orbital structures using MRI. J Comput Assist Tomogr. 2000;24(3):493–496. doi:10.1097/00004728-200005000-00025
299. Ozdikici M, Bulut E, Agca S. Assessment of the orbital structures using computed tomography in healthy adults. Niger J Clin Pract. 2021;24(4):561–568. doi:10.4103/njcp.njcp_77_20
300. Vattathil S, Akey JM. Small amounts of archaic admixture provide big insights into human history. Cell. 2015;163(2):281–284. doi:10.1016/j.cell.2015.09.042
301. Gittelman RM, Schraiber JG, Vernot B, Mikacenic C, Wurfel MM, Akey JM. Archaic hominin admixture facilitated adaptation to Out-of-Africa Environments. Curr Biol. 2016;26(24):3375–3382. doi:10.1016/j.cub.2016.10.041
302. Vernot B, Akey JM. Complex history of admixture between modern humans and Neandertals. Am J Hum Genet. 2015;96(3):448–453. doi:10.1016/j.ajhg.2015.01.006
303. Browning SR, Browning BL, Zhou Y, Tucci S, Akey JM. Analysis of human sequence data reveals two pulses of Archaic Denisovan Admixture. Cell. 2018;173(1):53–61.e9. doi:10.1016/j.cell.2018.02.031
304. Ongaro L, Huerta-Sanchez E. A history of multiple Denisovan introgression events in modern humans. Nat Genet. 2024;56(12):2612–2622. doi:10.1038/s41588-024-01960-y
305. Mishol N, Herzlinger G, Rak Y, Smilanksy U, Carmel L, Gokhman D. Candidate Denisovan fossils identified through gene regulatory phenotyping. Proc Natl Acad Sci U S A. 2025;122(35):e2513968122. doi:10.1073/pnas.2513968122
306. Pearce E, Stringer C, Dunbar RI. New insights into differences in brain organization between Neanderthals and anatomically modern humans. Proc Biol Sci. 2013;280(1758):20130168. doi:10.1098/rspb.2013.0168
307. Scott J. The Variation of Measurements: Considering the Morphology of Late Pleistocene Hominins [Thesis]. Central Michigan University; 2016.
308. Opperman LA. Cranial sutures as intramembranous bone growth sites. Dev Dyn. 2000;219(4):472–485. doi:10.1002/1097-0177(2000)9999:9999<::AID-DVDY1073>3.0.CO;2-F
309. Bialek P, Kern B, Yang X, et al. A twist code determines the onset of osteoblast differentiation. Dev Cell. 2004;6(3):423–435. doi:10.1016/s1534-5807(04)00058-9
310. Gandini F, Almeida M, Foody MGB, et al. Genomic evidence supports the “long chronology” for the peopling of Sahul. Sci Adv. 2025;11(48):eady9493. doi:10.1126/sciadv.ady9493
311. Reich D, Patterson N, Campbell D, et al. Reconstructing Native American population history. Nature. 2012;488(7411):370–374. doi:10.1038/nature11258
312. Tishkoff SA, Reed FA, Friedlaender FR, et al. The genetic structure and history of Africans and African Americans. Science. 2009;324(5930):1035–1044. doi:10.1126/science.1172257
313. Durvasula A, Sankararaman S. Recovering signals of ghost archaic introgression in African populations. Sci Adv. 2020;6(7):eaax5097. doi:10.1126/sciadv.aax5097
314. Kerdoncuff E, Skov L, Patterson N, et al. 50,000 years of evolutionary history of India: impact on health and disease variation. Cell. 2025;188(13):3389–3404.e6. doi:10.1016/j.cell.2025.04.027
315. Li S, Schlebusch C, Jakobsson M. Genetic variation reveals large-scale population expansion and migration during the expansion of Bantu-speaking peoples. Proc Biol Sci. 2014;281(1793):20141448. doi:10.1098/rspb.2014.1448
316. González-José R, Bortolini MC, Santos FR, Bonatto SL. The peopling of America: craniofacial shape variation on a continental scale and its interpretation from an interdisciplinary view. Am J Phys Anthropol. 2008;137(2):175–187. doi:10.1002/ajpa.20854
317. Cameron J. The interorbital width. A new cranial dimension. Its significance in modern and fossil man and in lower mammals. Am J Phys Anthrop. 1931;15(3):509–519. doi:10.1002/ajpa.1330150308
318. Howells WW. Cranial Variation in Man. Cambridge, MA: Peabody Museum of Archeology and Ethnology, Harvard University; 1973.
319. Lahr MM. Patterns of modern human diversification: implications for Amerindian origins. Am J Phys Anthropol. 1995;38:163–198. doi:10.1002/ajpa.1330380609
320. Neves WA, Hubbe M, Correal G. Human skeletal remains from Sabana de Bogotá, Colombia: a case of Paleoamerican morphology late survival in South America? Am J Phys Anthropol. 2007;133(4):1080–1098. doi:10.1002/ajpa.20637
321. Biswas N, Mukherjee A, Bhattacharya S. “Are you feeling sick?” A systematic literature review of cybersickness in virtual reality. ACM Comput Surv. 2024;56(11):1–38. doi:10.1145/3670008
 © 2026 The Author(s). This work is published and licensed by Dove Medical Press Limited. The
full terms of this license are available at https://www.dovepress.com/terms
and incorporate the Creative Commons Attribution
- Non Commercial (unported, 4.0) License.
By accessing the work you hereby accept the Terms. Non-commercial uses of the work are permitted
without any further permission from Dove Medical Press Limited, provided the work is properly
attributed. For permission for commercial use of this work, please see paragraphs 4.2 and 5 of our Terms.
© 2026 The Author(s). This work is published and licensed by Dove Medical Press Limited. The
full terms of this license are available at https://www.dovepress.com/terms
and incorporate the Creative Commons Attribution
- Non Commercial (unported, 4.0) License.
By accessing the work you hereby accept the Terms. Non-commercial uses of the work are permitted
without any further permission from Dove Medical Press Limited, provided the work is properly
attributed. For permission for commercial use of this work, please see paragraphs 4.2 and 5 of our Terms.
Recommended articles
A Meta-Analysis of Association Between Strabismus in Children/Adolescents and Risk of Mental Health Disorders
Krungkraipetch L, Krungkraipetch N, Threetong T
Clinical Ophthalmology 2025, 19:2333-2342
Published Date: 16 July 2025