Back to Journals » Hepatic Medicine: Evidence and Research » Volume 15
The Integrated Bioinformatic Assay of Genetic Expression Features and Analyses of Traditional Chinese Medicine Specific Constitution Reveal Metabolic Characteristics and Targets in Steatosis of Nonalcoholic Fatty Liver Disease
Authors Qiao C, Gu C, Wen S ![]() , He Y, Yang S, Feng X, Zeng Y
, He Y, Yang S, Feng X, Zeng Y
Received 21 July 2023
Accepted for publication 30 September 2023
Published 6 October 2023 Volume 2023:15 Pages 165—183
DOI https://doi.org/10.2147/HMER.S428161
Checked for plagiarism Yes
Review by Single anonymous peer review
Peer reviewer comments 2
Editor who approved publication: Dr Gerry Lake-Bakaar
Chunping Qiao,1,* Chengying Gu,2,* Song Wen,3,* Yanju He,3 Sheng Yang,4 Xinge Feng,5 Yipeng Zeng5
1Department of Gastroenterology, Shanghai Pudong Hospital, Fudan University, Shanghai, People’s Republic of China; 2Department of Examination, Shanghai Pudong Hospital, Fudan University, Shanghai, People’s Republic of China; 3Department of Endocrinology, Shanghai Pudong Hospital, Fudan University, Shanghai, People’s Republic of China; 4Laogang Community Health Center, Shanghai, People’s Republic of China; 5Department of Internal Medicine of Traditional Chinese Medicine, Pudong Hospital, Fudan University, Shanghai, People’s Republic of China
*These authors contributed equally to this work
Correspondence: Yipeng Zeng, Department of Internal medicine of Traditional Chinese Medicine Pudong Hospital, Fudan University, Shanghai, 201399, People’s Republic of China, Tel +86 18918928802, Email [email protected]
Purpose: In this study, our primary aim is to analyze the genetic expression feature and analyze specific Traditional Chinese medicine (TCM) constitution distribution in non-alcoholic fatty liver disease (NAFLD) and reveal the metabolic characteristic of NAFLD.
Materials and Methods: For revealing genetic features, we obtained the gene expression data from the Gene Expression Omnibus (GEO) database of the National Center for Biotechnology Information (NCBI). The genetic data on NAFLD were analyzed by identifying differentially expressed genes (DEGs), associated pathways, co-expressed genetic networks, and gene set enrichment function. Concurrently, we assessed specific constitution distributions among local NAFLD patients through established TCM constitution models and determined the independent variable, including specific constitution to the NAFLD via the regression analyses.
Results: The analyses on GEO datasets showed that simple steatosis in NAFLD is strongly associated with HOMA-insulin resistance (HOMA-IR). Analyses of GEO datasets revealed significantly altered genetic expression profiles between NAFLD and normal populations. For TCM constitution analyses, we demonstrated a decline in yin-yang harmony (YYH) and yang-asthenia (YAAC) constitution, whereas there was an increase in qi-stagnation (QSC) and phlegm-dampness (PDC) in NAFLD. The binary logistic regression analysis indicated that besides other metabolic parameters, YYH, qi asthenia (QAC), YYAC, and yin-asthenia (YAC) were the independent variables of NAFLD, while YAC was the independent variables of T2D. The multilinear regression analyses suggested that NAFLD, DM, BMI, waist, TC, TG, hypertension, ALT, AST, and YAC were the significant determinators of the FPG.
Conclusion: This study presents a relatively comprehensive metabolic profile in steatosis of NAFLD, revealed by significant genetic expression feature alterations and different TCM constitution distribution in NAFLD. Through this method, the study intends to associate the genetic feature with the phenotype of TCM constitution. The results could be applied to assist integrative medicine research in exploring the appropriate personalized approaches for NAFLD.
Keywords: NAFLD, T2D, bioinformatics, TCM constitution
Introduction
The incidence of T2D in China has soared sharply in recent years, with the country recording the highest number of cases worldwide.1 In obesity-related metabolic diseases, non-alcoholic fatty liver disease (NAFLD) has recently been considered an independent risk factor that induces the early onset of T2D.2 According to a review study on compiled data of the NAFLD epidemiology, the overall prevalence of NAFLD worldwide was estimated to be 32.4% (95% CI 29.9–34.9). Its prevalence has increased substantially over time, from 25.5% (20.1–31.0) in or before 2005 to 37.8% (32.4–43.3) in 2016 or later (p = 0.013). The overall prevalence of NAFLD was significantly higher in males than in females (39.7% [36.6–42.8] vs 25.6% [22.3–28.8]; p < 0·0001). The overall incidence of NAFLD was estimated to be 46.9 cases per 1000 person-years (36.4–57.5), 70.8 cases per 1000 person-years (48.7–92.8) in males and 29.6 cases per 1000 person-years (20.2–38.9) in female.3 The prevalence increased in China from 23.8% to 29% from 1999 to 2018, according to a recent study,4 where NAFLD-related advanced liver disease and its mortality, along with its overall disease burden, are expected to increase substantially. The percentage of total deaths from all causes attributable to NAFLD increased from 0.10% (0.8–0.14%) to 0.17% (0.13–0.23%).5 Because of the dramatic increase in the global incidence of metabolic risk factors and the aging population, it is expected that the burden of advanced disease due to NAFLD will more than double in t he period of 2016–2030.5 Therefore, finding the effective treatment targets behind the delicate interconnection net between NAFLD and metabolic diseases and its pathophysiology mechanism is emerging crucial.
In addition, Chinese medicine practitioners have used NAFLD as a critical target in dialectical treatment and comprehensive conditioning. The application of integrated medicine to prevent and treat metabolic diseases has attracted different research approaches in recent years. Several clinical studies, for example, by Wang Qi et al, have proposed the concept of nine primary constitutional classifications for Chinese medicine and their diagnostic basis.6–9 Furthermore, the research team explored the correlations of specific TCM constitutions with the genotypes of metabolic diseases and the susceptibility to diseases using the translational medicine platform which was intended to reveal the molecular biological characteristics of specific TCM constitutions.10–13 Some TCM clinical evidence has recently been used to summarize the characteristics and biological mechanisms of metabolic diseases such as T2D.14,15 Besides, some researchers have explored the characteristics of metabolic syndromes assessed by TCM in small samples of patients, with NAFLD using metabolomics methods in modern medical science.16 The relationship between different physical characteristics and metabolic changes during the progression of NAFLD and the occurrence of T2D is yet to be identified.17
The concepts used in early treatment through diet, exercise, and Chinese herbal medicine are emerging critical.18 Since NAFLD is rather to be considered as a systemic disorder, which could result in or exacerbate other metabolic disorders, such as DM by increase in the insulin resistance; thus, a multidiscipline approach, for instance, integrative medicine, seems to be essential for the concept of individualized treatment. Based on the emerging advances in discovering novel molecular targets, as well as an urge to seek out therapeutic targets regarding TCM in treating NAFLD, a comprehensive analysis on genetic and its association with specific TCM constitution appeals to be critical. Therefore, this study included the data of the genomic section in early NAFLD from the GEO database, which revealed the significantly altered genetic expression features in NAFLD, and analyzed data via the TCM constitution theory on the incidence, constitution characteristics, and risk factors associated with NAFLD. We delineated a relative whole map on metabolic characteristics of NAFLD, where molecular modern medicine and systemic traditional medicine therapy converged and connected each other, and provided potential targets for the treatment of NAFLD.
Materials and Methods
Ethics Statements
All of the genomic and associated datasets used in this study were obtained from public databases of GEO in NCBI. The local TCM constitution study, including surveys, sampling, and examinations, has obtained ethics approvals from the Ethics Committee of Shanghai Pudong Hospital (NO. WZ-010). The consent was received from study participants before the whole Study. The guidelines outlined and procedures followed the Declaration of Helsinki.
Data Extraction from Genomic Datasets and Identification of Differential Expressed Genes (DEGs)
We first obtained the gene expression datasets of NAFLD through the Gene Expression Omnibus (GEO) database in NCBI (http://www.ncbi.nlm.nih.gov/).19 We intentionally searched and found the latest 5-year data originated from microarray and sequencing studies, where we used the medical subject headings (MESH) terms: “Nonalcoholic Fatty liver disease” or “NAFLD.” Among the related datasets found, we selected GSE89632, which is a genome-wide analytic dataset from the biopsy species of patients with NAFLD and healthy donors;20 GSE107231, another dataset contains the information of lncRNA change in the livers of NAFLD patients compared with that of healthy control;21 GSE114923, dataset primarily on the serum miRNA obtained by profiling with high throughput sequencing assay.22 We subsequently analyzed the GSE89632, GSE107231 data with GEO2R, which is one part of the function of GEO database for initial gene expression analysis, and gained significantly expressed genes including both up-regulated and down-regulated genes, which were defined as differentially expressed genes (DEGs). DEGs in GSE89632 was originated from normal human liver biopsy and simple steatosis cases but excluded non-alcoholic steatohepatitis (NASH), whereas the GSE114923 from patients’ serum were analyzed via an online analytic toolkit, named as BioJupies (https://amp.pharm.mssm.edu/biojupies/).23 The |log2 fold change (FC)| > 2, which indicates the amplitude of gene expression, and with P-value <0.05 were defined as the cut-off criteria to judge for DEGs. The conversion of the name of DEGs from the corresponding ID of array or sequence probes was completed via the online biological DataBase network (bioDBnet, https://biodbnet-abcc.ncifcrf.gov/db/db2db.php). Then, the volcano plots were drawn for presenting up-regulated (red dots) or down-regulated genes (green dots), Heatmaps of DEGs were drawn using series matrix data from GEO dataset, and DEGs were listed at the right side of the heatmap, visualized by software of Prism (GraphPad, version 8.0).
DEGs Applicated for Pathway Analyses via Gene Ontology (GO) and Kyoto Encyclopedia of Genes and Genomes (KEGG)
The Database for Annotation, Visualization, and Integrated Discovery (DAVID, http://david.abcc.ncifcrf.gov/)24 is the most common functional annotation tool, which was used for GO functional enrichment analysis and KEGG pathway analysis. The items of GO analysis on DEGs including biological process, cellular component, and molecular function. In addition, KEGG pathway analysis presents already compiled data of genes, concurrently with the possible roles in related acknowledged pathways demonstrated in other studies. We uploaded the DEG list in DAVID and Web-based gene set analysis toolkit (WebGestalt, http://www.webgestalt.org/)25 to investigate the potential functions of genes. P-value <0.05 and false discovery rate (FDR) <0.05 were regarded as the cut-off criteria for identification of meaningful pathway.
Weighted Gene Co-Expression Network Analysis (WGCNA) and Gene Set Enrichment Analysis (GSEA)
The series matrix files of GEO data on GSE89632, GSE107231 and group information deposited in EXCEL files were downloaded. Then, data were rearranged to be the format suited for WGCNA analyses, which was performed online, via integrated differential expression and pathway analysis 9.1 (iDEP 9.1, http://bioinformatics.sdstate.edu/idep/),26 whereas hallmark gene analyses through validated GSEA software.27,28 The WGCNA calculates and divides the genes into significant different modules related to the phenotype of NAFLD, and reveals molecular network of regulation, while GSEA analyses use enrichment methods and identify function of gene set in NAFLD.
Diagnostic Standards, Constitutional Assessment Criteria, and Exclusion Criteria for NAFLD by TCM Constitution Analyses
The criteria for NAFLD follow the 2018 Guidelines of prevention and treatment for NAFLD in China.29 The diagnosis includes imaging or histological evidence of diffuse hepatic steatosis and excludes alcohol abuse (the equivalent alcohol consumption of men <30 g/d, and that of women <20 g/d) and other causes of liver steatosis such as chronic viral hepatitis. The physique types of individuals with NAFLD were determined by applying the “nine types of Chinese Basic Physique Classification Scales” and “TCM Physique Classification Judging Standards”.2,3 Individuals with obvious hepatitis and biliary diseases, alcoholic fatty liver, type 1 diabetes, particular type diabetes, cirrhosis, severe cardiovascular and cerebrovascular diseases or diseases, such as hydronephrosis and renal insufficiency, were excluded from the study. We intended to explore the relationship between T2D and NAFLD, as well as the role of T2D in TCM constitution. The diagnosis of T2D is based on the World Health Organization’s (WHO) 2005 diagnostic criteria.
The Process of Inclusion the NAFLD Patients as Participants
Eleven thousand six hundred eighty villagers aged over 60 years from 8 villages of Laogang Town, Pudong, Shanghai, were assessed from March to December 2016. After removing incomplete data due to unqualified examinations, a total number of 7063 samples were subjected to randomized sampling for the group-controlled study. Notably, we recorded 2619 patients with NAFLD and 2619 without NAFLD disease (NAFLD and control group), respectively.
Sampling and Obtaining the Demographic, Laboratory Data of the Study Groups
The parameters were measured by designated persons for all patients, including height, waist circumference, weight, body mass index (BMI), waist-to-hip ratio, and blood pressure. For the laboratory examination, all the candidates had to fast for 8–12 hours after dinner. After that, we measured fasting plasma glucose levels, blood lipids, including total cholesterol (TC) and triglycerides (TG). In addition, the indices for liver and kidney functions were measured in the morning. For diagnostic examination of fatty liver, all patients who underwent a B-ultrasound with probes used were 3.5Hz type.
Statistical Analysis
Measured data were expressed as mean ± standard deviation. Analysis of variance was performed with ANOVA. The differences between fatty liver and non-fatty liver patients were compared using the Chi-square test based on constitution distribution, gender, and presence of hypertension and diabetes. Furthermore, binary logistic and multiple linear regression analysis were performed on the factors associated with NAFLD and T2DM and fasting plasma glucose (FPG). P values <0.05 were defined as significant. All statistical analyses were conducted via SPSS (version 24.0) software with GraphPad Prism 9.0.
Results
The Analysis on the Relationship Between Clinical Characteristics of NAFLD vs Regular Liver Donors and the Liver Steatosis Area
We concurrently analyzed the relationships between the liver steatosis area and the clinical metabolic characteristics of patients with NAFLD versus ordinary people in the GSE89632 study. The results show that the area of steatosis and HOMA-IR were increased significantly in patients with SS (P < 0.05), whereas blood lipids have no distinctions between the two groups (P > 0.05) (Figure 1). The analysis also showed that the content of aracchidonic acid (ARA), an unsaturated fatty acid (UFA) of the liver, significantly decreased in patients with simple steatosis (SS) compared with regular donors (P < 0.0001). In addition, the HOMA-IR and fasting insulin, which are critical markers of insulin resistance in T2D, are strongly associated with liver steatosis area and body mass index (BMI) (P < 0.05), whereas the association of blood lipids and age is weak and not significant (P > 0.05) (Table 1 and Figure 2).
 |
Table 1 The Correlational Analysis Shows Implications of Age, BMI, Blood Lipids, and Area of Liver Steatosis on Fasting Insulin or HOMA-IR |
 |
Figure 1 The comparison of clinical characteristics of patients with simple steatosis (SS) versus normal health control (HC) in GSE89632; the result of blood lipid assessments showed no significance between SS and HC. Abbreviations: TG, total triglyceride; TC, total cholesterol; LDL, low-density lipoprotein; HDL, high-density lipoprotein; UFAs, unsaturated fatty acids; ARA, arachidonic acid; EPA, eicosapentaenoic acid; DHA, docosahexaenoic acid; HOMA-IR, Homeostasis model assessment-insulin resistant; ns, not significant. Notes: *The group of SS was compared with the HC group, p < 0.05, **p < 0.01; The data in figure steatosis use unpaired t-test; The data in figure HOMA-IR use Mann–Whitney test; The data in figure Lipid and Liver UFAs use two-way ANOVA, Sidak multiple-comparison test. |
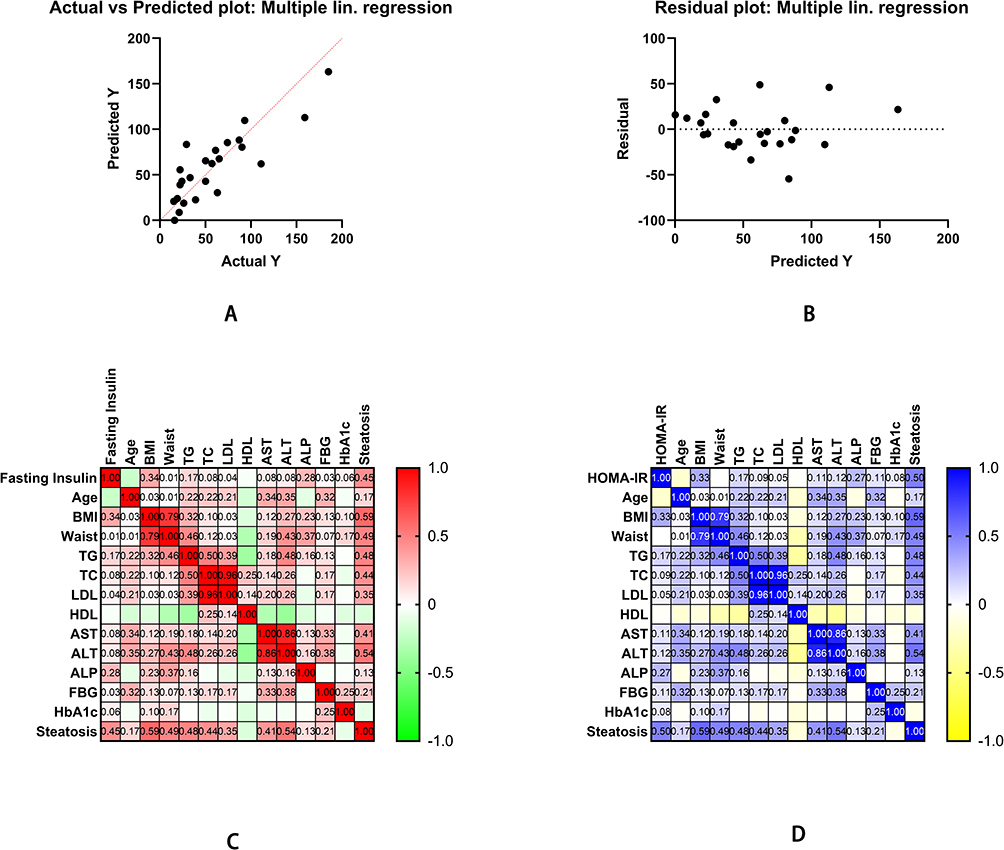 |
Figure 2 The Pearson correlation of clinical characteristics of NAFLD and regular liver donors. (A) Moreover, (B) shows multiple linear regression as fasting insulin is a dependent variable. (C) Furthermore, (D) shows Pearson correlation analysis of fasting insulin and HOMA-IR with multiple clinical characteristics. Abbreviations: BMI, body mass index; TG, total triglyceride; TC, total cholesterol; LDL, low-density lipoprotein; HDL, high-density lipoprotein; HOMA-IR, homeostasis model assessment-insulin resistant. |
The Bioinformatic Analyses of the Global Genetic Feature on Data of GSE89632
The smaller the results analyzed the P-value in the GEO databases, the higher the gene ranks and the credibility of gene differential expression. All the 492 significant genes, DEGs (3 upregulated and 32 downregulated) were determined through the integrated analysis. The heatmap of the significant top 50 genes was shown (Figure 3A). The significant genes aberrantly expressed in NAFLD including 3 upregulated genes [GCK (P = 3.66E-07), CYP7A1 (P = 2.45E-07), SKIDA1 (P = 2.02E-09)] and the 32 down-regulated genes, including the most significant 3 down-regulated genes [MIR21 (P = 8.66E-13), PHLDA1 (P = 1.30E-12), MYC (P=5.26E-12)]. The significant expression of up-or down-regulated genes was shown in the volcano plot (Figure 3B).
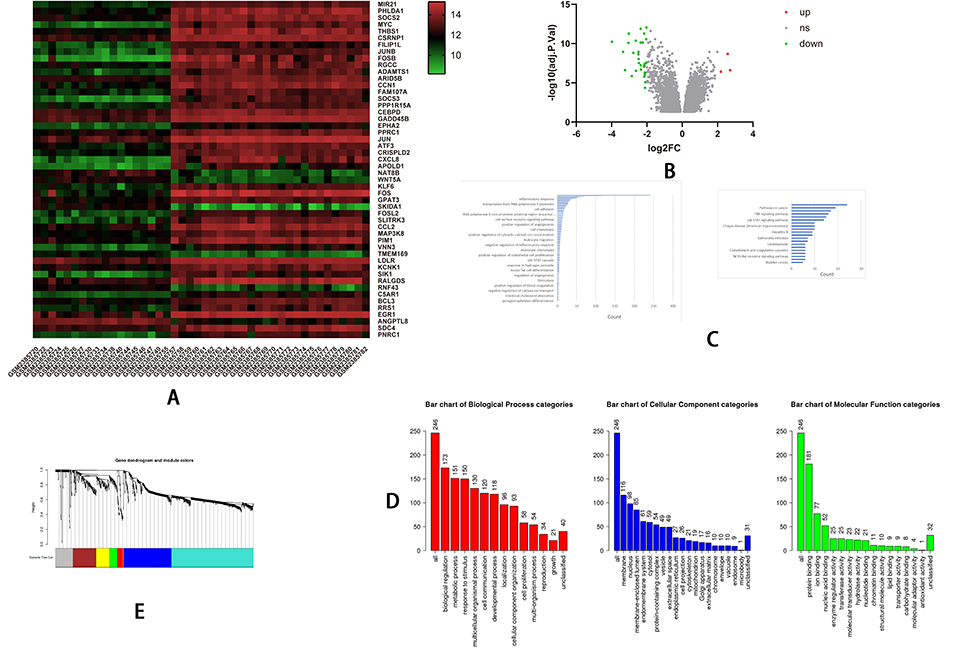 |
Figure 3 Continued. |
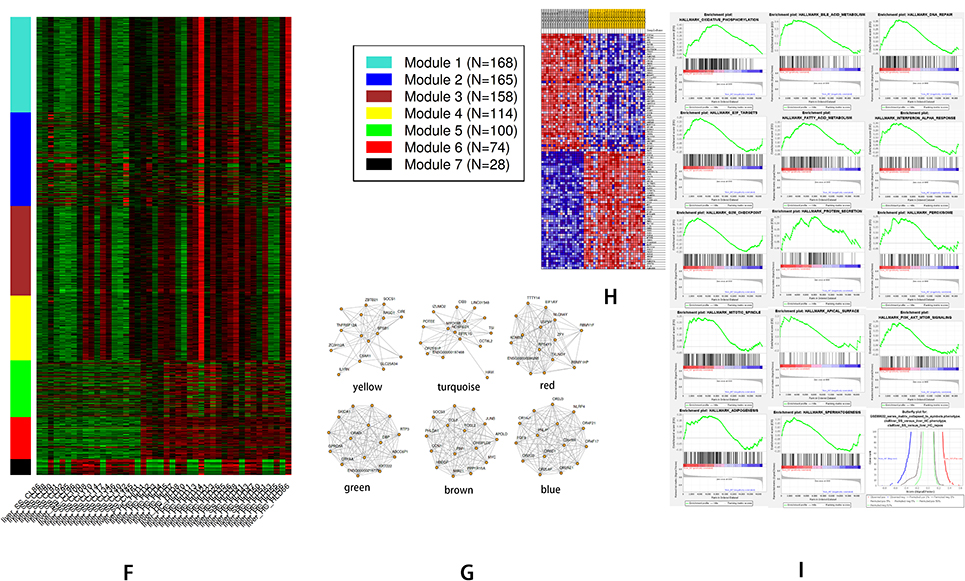 |
Figure 3 The bioinformatics analyses of global genetic features of NAFLD using data of GSE89632. (A) The heatmap shows the expressions of the top 50 significant genes in liver samples of SS versus HC; The deep red color represents the extent of high expressions of DEGs, whereas the green color represents the lower expressions of DEGs. The sample number from GSM238570 to GSM2385755 on the left bottom of heatmap and GSM 2385773, GSM 2385777 indicate SS group, whereas the sample numbers on the right bottom from GSM2385757 to GSM2385782 except GSM 2385773, GSM 2385777 indicate HC group. The right side lists the official gene symbols of the top 50 significant genes. (B) The volcano plot of expressions of DEGs; the define and cut-off of up- (red) or down- (green) regulated genes are the absolute values of log2Fold change which exceed 2, and the label of Y-axis is the -log10 adjusted P-value. (C) The overview of GO analysis of the DEGs, the order was defined by collected counts of DEGs in multiple Gene ontology (biological process, molecular function, and cellular component). P < 0.05. (C) The overview of KEGG pathway analysis of the DEGs, the order was defined by collected counts of DEGs in multiple KEGG pathways. P < 0.05. (D) The overview of respective GO component analysis of the DEGs, the order was defined by collected counts of DEGs in multiple Gene ontology (biological process, molecular function, and cellular component). P < 0.05. (E) WGCNA analyses show the dendrogram of genes divided into 7 modules with different colors. The height shows the heterogeneities of different co-expressed genes groups. (F) WGCNA analyses show the heatmap on the expression of 7 different modules, the different modules in different colors indicate corresponding co-expressed gene groups, the gene amounts have been indicated on the correct upper box. The bottom displays a liver sample. SS: simple Steatosis, HC: normal health control. (G) WGCNA analyses show the network connections in each meaningful module. A different color indicated each module. (H) GSEA analyzed the heatmap of top 50 genes; The upper label showed numbers of liver samples, and the correct label indicates the official gene symbols of the top 50 significantly expressed genes. Red color indicates up-regulated, and blue indicates down-regulated. The samples ID with SS indicate SS group, whereas sample ID with HC indicates HC group. (I) An overview of up-regulated genes by GSEA analysis. In each figure, the up-regulated genes sets were displayed with a positive enrichment score. The last figure of the butterfly plot showed a signal-to-noise score in this GSEA analysis. |
Then, we determined to find out the biological process, cellular component, molecular function (GO analysis), and pathway involved (KEGG analysis) that related to the DEGs, we uploaded the DEGs of the GSE89632 dataset to perform the GO analysis and KEGG analysis. The outcomes revealed that protein binding (GO:0005515; P-value = 1.10E-04) has the most significant counts enriched for molecular function, and plasma membrane (GO:0005886; P-value = 0.009426), extracellular space (GO:0005615; P-value = 1.99E-10) for cellular component (Figure 3C and D). In terms of the biological process, the results showed positive regulation of transcription from RNA polymerase II promoter in (GO:0045944; P-value = 9.82E-08) has the most significant counts (Figure 3C). Furthermore, KEGG pathway enrichment analysis showed that cytokine–cytokine receptor interaction (hsa04060; P-value = 2.05E-07) and Pathways in cancer (hsa05200; P-value = 0.024471) have the most significant counts enriched (Figure 3C).
The WGCNA analyses show that there are seven modules; each module with different colors represents 1 group of co-expressed or functionally related genes (Figure 3E–G). Thus, the results showed that 7 modules (Figure 3E and F) associated with the phenotype of SS, and the network of related genes were represented in Figure 3G. The GSEA analysis included 29,377 genes; after conversion into gene symbols, there are 19,008 genes. The top 50 significant genes by GSEA analysis in the heatmap were shown. (Figure 3H) The results of hallmark gene analysis of GSEA showed 14/50 genes were upregulated in SS, including genes associated with oxidative phosphorylation, bile acid metabolism, DNA repair, E2F targets, fatty acid metabolism, interferon-alpha (IFN-α) response, G2M checkpoint, protein secretion, peroxisome, mitotic spindle, apical surface, PI3K-AKT- mTOR signaling, adipogenesis, and spermatogenesis. (Figure 3I). 14/50 gene sets are upregulated in SS, 3 gene sets are significant at FDR <25%, 4 gene sets are significantly enriched at nominal value <1%, 4 gene sets are significantly enriched at nominal p-value <5%. Markers for SS: 9843 (51.8%) with correlation area 46.4%, whereas markers for phenotype HC: 9165 (48.2%) with correlation area 53.6%.
The Bioinformatic Analyses of DEGs in lncRNA Data (GSE107231)
All the 186 significant DEGs (45 up-regulated and 141 down-regulated) were determined through the integrated analysis. The heatmap of the top 50 significant genes including up- and down-regulated genes was shown (Figure 4A). As the volcano plot showed, significant lncRNA aberrantly expressed in NAFLD including 45 upregulated genes including the 3 most significant lncRNA [OGN (P = 6.44E-05), THSD4 (P = 0.000782), ATP2A3 (P = 0.000945)], and the 141 down-regulated lncRNA, including the most significant 3 down-regulated genes [DA624691 (P = 1.85E-06), lncRNA p28817 (P = 2.21E-06), OR51B6 (P = 1.55E-05)]. The significant expression of up-or down-regulated genes was shown in the volcano plot (Figure 4B).
 |
Figure 4 Continued. |
 |
Figure 4 The bioinformatics analyses of the features of LncRNA in NAFLD using data of GSE107231. (A) The heatmap shows the expressions of top 50 significant genes including DEGs in liver samples of NAFLD versus normal; The deep red color represents the extent of high expressions of DEGs, whereas the green color represents the lower expressions of DEGs. The sample numbers from GSM2863101 to GSM2863105 on the left bottom of the heatmap indicate the normal control group, whereas the sample numbers on the right bottom from GSM2863106 to GSM2863110 indicate the NAFLD group; The right side lists the official gene symbols of significant genes. (B) The volcano plot of expressions of DEGs; the define and cut-off of up- (red) or down- (green) regulated genes are the absolute values of log2Fold change which exceed 1, and the label of the Y-axis is the -log10 adjusted P-value. (C) The overview of GO analysis of the DEGs, the order was defined by collected counts of DEGs in multiple Gene ontology (biological process, molecular function, and cellular component). P < 0.05. (D) The overview of KEGG pathway analysis of the DEGs, the order was defined by collected counts of DEGs in multiple KEGG pathways. P < 0.05. (E) The dendrogram of genes are divided into 7 modules with different colors. The height shows the heterogeneities of different co-expressed genes groups. (F) The heatmap on the expression of 10 different modules, the different modules in different colors indicate corresponding co-expressed gene groups, the gene amounts have been indicated on the upper right box. The sample numbers from GSM2863101 to GSM2863105 on the left bottom of the heatmap indicate a normal group, whereas sample numbers on the right bottom from GSM2863106 to GSM2863110 indicate the NAFLD group. (G) The network connections in each meaningful module. A different color indicated each module. (H) GSEA analyzed the heatmap of top 50 genes; The upper label showed numbers of liver samples, and the right label indicates the official gene symbols of the top 50 significantly expressed genes. Red color indicates up-regulated, and blue indicates down-regulated. The sample numbers from GSM2863101 to GSM2863105 marketed by yellow indicate a normal control group, whereas sample numbers from GSM2863106 to GSM2863110 indicate the NAFLD group. (I) An overview of up-regulated genes by GSEA analysis. In each figure, the up-regulated genes sets were displayed with a positive enrichment score. The last figure of the butterfly plot showed a signal-to-noise score in this GSEA analysis. |
We uploaded the 186 DEGs of GSE107231 dataset to perform the GO analysis and KEGG analysis. The outcomes revealed that signal transduction (GO:0007165; P-value = 0.013818) has the most significant counts enriched for molecular function and plasma membrane (GO:0005886; P-value = 0.001433) for cellular component (Figure 4C). In terms of the biological process, the results showed cell proliferation (GO:0008283; P-value = 0.041499) has the most significant counts (Figure 4C). Furthermore, KEGG pathway enrichment analysis showed that cytokine–cytokine receptor interaction (hsa04060; P-value = 0.018647), RIG-I-like receptor signaling pathway (hsa04622; P-value = 0.07346), and Retinol metabolism (hsa00830; P-value = 0.062801) has the most significant counts enriched (Figure 4D).
The WGCNA showed that there are 10 modules; each module with different colors represents 1 group of co-expressed or functionally related genes (Figure 4E). The heatmap and network connections in each module were shown (Figure 4F and G). The GSEA analyses included 75,217 genes; after conversion into gene symbols, there are 22,595 genes. The top 50 significant genes in the heatmap were shown. (Figure 4H) The results of hallmark gene analysis of GSEA showed 25/50 genes were upregulated in SS, including genes associated with epithelial–mesenchymal transition, KRAS signaling up, cholesterol homeostasis, notch signaling, TNF-α signaling via NF-κB, allograft rejection, UV response up, IL2-STAT5 signaling, hedgehog signaling, interferon-alpha (IFN-α) response, IFN-γ response, complement, hypoxia, apical junction, coagulation, inflammatory response, p53 pathway, myogenesis, G2M checkpoint, IL6 JAK STAT3 signaling (Figure 4I). 25/50 gene sets are upregulated in SS, 0 gene sets are significant at FDR < 25%, 0 gene sets are significantly enriched at nominal p-value <1%, 0 gene sets are significantly enriched at nominal p-value <5%. Markers for NAFLD: 7966 (35.3%) with correlation area 32.7%, whereas markers for Control: 14,629 (64.7%) with correlation area 67.3%.
The Bioinformatic Analyses of DEGs in miRNA Data (GSE114923)
We performed the DEGs of 456 miRNAs expression on analysis. The analyses were conducted in BioJupies. The DEGs include hsa-mir-193b-5p, hsa-mir-483-5p, hsa-mir-193a-5p, hsa-mir-320b-2-3p, hsa-mir-30a-5p, hsa-mir-122-5p, hsa-mir-3591-3p, hsa-mir-320c-2-5p, hsa-mir-99a-5p, hsa-mir-100-5p, hsa-mir-320c-1-3p, hsa-mir-378c-5p, hsa-mir-320b-1-5p, hsa-mir-378a-3p, hsa-mir-192-5p, hsa-mir-1228-5p. (adjusted P < 0.05, log2FC ≥ 1). The heatmap of the top 50 up and down-regulated genes was shown (Figure 5A). The volcano plot showed significant miRNA aberrantly expressed in NAFLD was shown (Figure 5B).
 |
Figure 5 The bioinformatics analyses of the features of MiRNA in NAFLD using data of GSE114923. (A) The heatmap shows the expressions of top 455 DEGs (partially displayed) in serum samples of NAFLD versus normal; The deep red color represents the extent of high expressions of DEGs, whereas the green color represents the lower expressions of DEGs. The sample numbers from GSM3154851 to GSM3154854 on the left bottom of the heatmap indicate the NAFLD group, whereas the sample numbers on the right bottom from GSM3154855 to GSM3154850 indicate normal control group; The right side lists the official gene symbols of top 455 DEGs (partially displayed). (B) The MA plot (left) and a volcano plot (right) of expressions of DEGs; the define and cut-off of up- (red) or down- (blue) regulated genes are the absolute values of log2Fold change which exceed 2. |
Investigation on the Prevalence of NAFLD with Comorbidities of the Local Area
The prevalence of NAFLD among 11,680 people aged over 60 years in the 8 investigated villages was 33.8%. Notably, 13.25%, 41.48%, and 5.27% of the analyzed population had T2D, hypertension, and cerebral infarction, respectively.
Comparing the General Characteristics and Biochemical Test Data of Individuals with NAFLD versus Control Group
We observed no significant difference in systolic blood pressure between individuals with NAFLD and the control group in this experiment. However, significant differences were noted in diastolic blood pressure, BMI, waist circumference, waist-to-hip ratio, TG, TC, fasting plasma glucose, ALT, and AST between the two groups (p < 0.01), (Table 2) (Figure 6).
 |
Table 2 Analysis of General Characteristics and Biochemical Test Data of NAFLD and Control Group |
 |
Figure 6 Comparisons of general characteristics and biochemical test data between NAFLD and control group on Age (A), BMI (B), waist (C), WHR (D), SBP, DBP (E), FPG (F), blood lipids (G), and aminotransferase (H); The results showed that besides Age, SBP, there were significant disparities in BMI, waist, WHR, DBP, FPG, blood lipids, and aminotransferase between the NAFLD and normal participants. Abbreviations: ns, no significance; NAFLD, non-alcoholic fatty liver disease group; BMI, Body Mass Index; WHR, Waist-to-hip ratio; FPG, fasting plasma glucose; SBP, Systolic blood pressure; DBP, Diastolic blood pressure; TG, triglyceride; TC, total cholesterol; ALT, glutamic pyruvic transaminase; AST, glutamic oxaloacetic transaminase. Notes: *NAFLD group compared with the control group, P < 0.05; **NAFLD group compared with the control group, P < 0.01. |
Chi-Square Test Analysis of Constitutional Characteristics of Individuals with NAFLD versus the Control Group
Of note, yin-yang harmony and yang asthenia declined (p < 0.01, p < 0.001), while qi- stagnation and phlegm-dampness increased (p < 0.05, p < 0.001). There was no significant difference between the NAFLD and control groups regarding qi asthenia, damp-heat, blood stasis, yin asthenia, and allergic constitution (Table 3) (Figure 7).
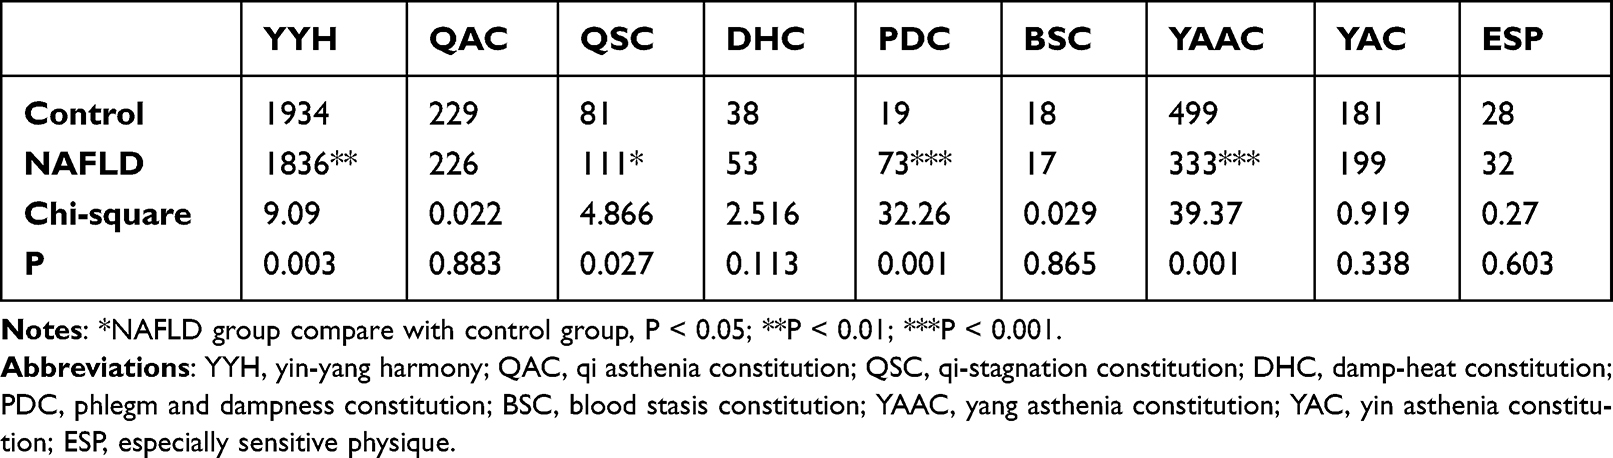 |
Table 3 Chi-Square Analysis of Constitutional Characteristics of NAFLD and Control Group |
 |
Figure 7 The comparisons of TCM constitution distributions between NAFLD and control groups. Abbreviations: YYH, yin-yang harmony; QAC, qi asthenia constitution; QSC, qi-stagnation constitution; DHC, damp-heat constitution; PDC, phlegm and dampness constitution; BSC, blood stasis constitution; YAAC, yang asthenia constitution; YAC, yin asthenia constitution; ESP, especially sensitive physique. Notes: *NAFLD group compare with control group, P < 0.05; **P < 0.01; ***P < 0.001. |
Binary Logistic Regression Analysis of Factors on the NAFLD Disease
The logistic multiple-regression analysis was performed using the number of NAFLD cases as the dependent variable. The regression model proved to be meaningful (p < 0.001). Gender, BMI, waist, diabetes, hypertension, fasting plasma glucose, ALT, AST, TG, yin-yang harmony, yin asthenia, yang asthenia, Qi asthenia were identified as the significant factors with NAFLD (Table 4).
 |
Table 4 Binary Logistic Regression Analyzes the Implications of Metabolic Characteristics and TCM Constitutions on NAFLD |
Additionally, we performed a multivariate linear regression analysis using FPG as the dependent variable to study the significant factors related to hyperglycemia in NAFLD; high levels of FPG were related to NALFD, diabetes, BMI, waist, blood lipids, both systolic and diastolic blood pressure, aminotransferases, and yin asthenia (Table 5).
 |
Table 5 Multiple Linear Regression Analysis Shows Significant Factors with Fasting Plasma Glucose (FPG) (P < 0.05) |
Finally, binary logistic regression analysis was performed using diabetes as the dependent variable to assess the effect of NAFLD on diabetes. The results showed that age, waist, NAFLD, hypertension, FPG, and yin asthenia were significant factors of diabetes (Table 6).
 |
Table 6 Binary Logistic Regression Analysis on the Implications of Metabolic Characteristics and TCM Constitutions on DM |
Discussion
Medical practitioners or investigators have acknowledged the liver as a critical metabolic hub to the body.30 Among all causes leading to liver injury, non-alcoholic fatty liver disease (NAFLD) may be more prevalent and is a multifactorial cause of complex metabolic disorder related with the ectopic lipid accumulation. This disease in early is often without symptoms but a milestone in glucose intolerance and insulin resistance.31 The sign of the liver in TCM is the “general” organ. It maintains the regular activity of multiple organs and circulation by “upbearing”, and promotes nutrient digestive and transformation smoothly by “effusion”.32 Liver function could be dominated by the status of the qi dynamic. Besides, NAFLD is an asthenia syndrome in TCM. According to the TCM five primary elements theory, the liver signifies wood, and the earth-spleen could be easily invaded by the depression of liver. The role of spleen governs the movement and transformation of grain and water; if the stagnation of liver invades the spleen-earth, the transportation of the spleen and formation of dampness will be dysfunctional. Additionally, our study results showed that the proportion of liver qi-stagnation (QSC) increased in NAFLD, which inter-restricts the spleen-earth, thus accumulating phlegm-wetness. Early qi-stagnation, long-term injury to the spleen qi-stagnation, and dampness result in phlegm-dampness (PDC), the typical manifestation of which including increased secretion of facial oil, dark yellow facial complexion, face and eyelid edema, copious and sticky sweat, choking sensation over the chest, copious phlegm, tuck, and soft lower abdomen, drowsiness, heavy limbs, thick and greasy tongue, and slippery pulse.33
Epidemiologic studies show that the phlegm-dampness constitution is highly related to diabetes, hypertension, and metabolic syndromes.34 The existing studies in China, including by Zhang Chun Ming et al assessed the correlation of glycolipid metabolic disorders with TCM syndromes. They found that as the NAFLD progresses, dampness and heat, phlegm, and blood stasis increase, accompanied by an abnormal increase in ALT, blood lipids, the insulin resistance index, and a significant increase in glucose metabolism disorders.35,36 Similarly, our large-scale clinical controlled study revealed that patients with NAFLD showed characteristics of phlegm-dampness and qi-stagnation accompanied by an increase in fasting blood glucose, blood lipids (TG, TC), and liver transaminase. Multiple kinds of research indicated that NAFLD progression increases the serum ALT levels before the onset of T2D, and ALT/AST can independently predict the occurrence of T2D.37,38 Thus, it is of critical to explore the potential pathophysiological mechanism that underlies the TCM constitution in NAFLD through the integrative medicine assay especially specific genetic expression profile.
We first found that the area of steatosis is strongly positively associated with the fasting insulin and HOMA-insulin resistance in GSE89632. This result backups that liver is an essential hub to glucose tolerance and suggests that despite in the early phases of NAFLD, there is an alteration in glucose intolerance, leading to insulin resistance or hyperinsulinemia due to 5% or more of steatosis.39 Due to the background of metabolic syndrome, we can see that BMI and blood lipids are also positively related to HOMA-IR and fasting insulin. They may be directly related to hyperinsulinemia or act as an indirect mediator.
In recent years, novel studies are integrating the technique prevalent in western medicine to TCM theory, especially constitution.40 Qi Wang et al10 used genetic arrays to analyze the related gene expressions and single nucleotide polymorphisms (SNPs) of the phlegm-dampness constitution and identified the genes involved in enzyme activity, sterol transporter activity, participate in the biological process of lipid metabolism, cholesterol metabolic process, etc. Lingru Li et al11 used gene chips to analyze isolated total RNA from the PBMCs of phlegm-dampness and normal control. They found the hallmark genes related to the insulin signaling pathway, PPAR signaling pathway, hypertrophic cardiomyopathy, and others. Moreover, metabolomics technology was also widely applied to TCM in NAFLD and associated various constitutions.16 The present study investigated the relationship between our residents who affected NAFLD and normal individuals by using TCM constitution methods. The results may provide potential practical tools to assess the diverse constitutions of NAFLD.
Therefore, we then used bioinformatic assay to analyze the wide genomic alterations in NAFLD. The function of the particular gene was referenced from the genecard database (https://www.genecards.org/). The DEG analysis in GSE89632 by GEO2R revealed that 3 genes were substantially upregulated in SS compared with HC, GCK, the protein product of which is glucokinase, responsible for glucose phosphorylation, which is a critical enzyme for glucose utilization,41 maybe a marker for hyperinsulinemia. CYP7A1, a gene for monooxygenases cytochrome P450, which is a rate-limiting enzyme for cholesterol catabolic and bile acid synthesis pathway,42 is also upregulated, which involves in the target of microbiota,43 metformin,44 and incretin action,45 and also represents the compensatory activity of the liver in early NAFLD. SKIDA1, also known as SKI/DACH domain containing 1, is also associated with BMI and waist–hip ratio.46,47 However, there were relatively increased downregulated genes, such as MIR21, a microRNA, has multiple functions related to carcinoma,48 glioma, and is associated with heat production by uncoupling proteins and anti-ROS,49 suggesting NAFLD may be related to the reduced energy expenditure. PHLDA1, also known as pleckstrin homology-like domain family member 1, has functions related to antiapoptotic effects of insulin-like growth factor-1 (IGF-1) and PI3K-AKT pathway,50 which suggests it has a role in hepatic cellular growth and insulin action. MYC is a well-known proto-on-co-gene, related to the metabolism of proteins and progression of cancer, which was found to be down-regulated, suggesting abnormal protein metabolism, and an early sign-in hepatocarcinoma.51 GSE107231, which analyzes the lncRNA changes, showed that especially OGN, THSD4, and ATP2A3 significantly upregulated. OGN is associated with ectopic bone formation, and its high expression was positive with insulin secretion and action, and elevated heart left ventricular mass.52,53 THSD4 is associated with the peters-plus syndrome, TGF-β signaling, and bone density.54 ATP2A3 is associated with muscle excitability, heat production, cancer, etc.55 In GSE114923, hsa-mir-193b-5p, hsa-mir-483-5p, hsa-mir-193a-5p, etc.56 have been found as DEGs. We conceptualized that these genes may play roles in NAFLD.
By GO and KEGG analysis, we found protein bindings, plasma membrane, extracellular space, and mRNA transcription connected to the most functional genes counts in GO, and cytokine–cytokine receptor interactions and Pathways in cancer were indicated by KEGG in GSE89632, thus, suggesting NAFLD has distinct gene expression, functional alterations, and may share the common pathological pathway with liver cancer. In GSE107231, we found that signal transduction, plasma membrane, cell proliferation in GO analysis, cytokine–cytokine receptor interaction, RIG-I-like receptor signaling pathway, suggesting distinct gene expression, functional alterations, and may share the pathway with antivirus response.
The WGCNA distinguishes multiple co-expressed gene groups and provides gene network connections, which may assist in founding more associated functional genes related to NAFLD and glucose metabolism. We found multiple gene alterations in SS related to glucose metabolism and insulin resistance through the bioinformatics assay, which could be utilized as potential biomarkers for prevention of T2D with NAFLD. Moreover, the GSEA analysis showed that gene sets related to energy and lipid metabolism were upregulated, which is generally consistent with formal analysis, and provided comprehensive gene functional annotations related to early NAFLD.
Finally, through regression analyses, we found that the incidence of T2D is closely associated with NAFLD. We reported that the QSC and PDC of the NAFLD group were significantly increased. The analysis of the relationship between NAFLD and T2D also indicated that, with an increase in ALT, the fasting blood glucose increases, and yin asthenia occurs. The progression of NAFLD and yin- asthenia are closely associated with the onset of T2D. Of note, the early onset of NAFLD originates from liver QSC. Therefore, it is imperative to condition the liver QSC, PDC as systemic targets to postpone the progression of NAFLD and the possibility of insulin resistance and DM, which could be attributed to the injury to the spleen function by QSC and PDC. As aforementioned contents indicated, multiple genes may be involved in the process of lipid metabolism, and cholesterol metabolic process, as well the hallmark genes had been found to be related to the insulin signaling pathway, PPAR signaling pathway in PDC. Fortunately, TCM medicine could be proficient at condition in QSC, which cause the target of modern medicine to rectify the overweight, hyperinsulinemia and insulin resistance, dyslipidemia, and the key molecular target may be GSK, CYP7A1, SKIDA1, PHLDA1, OGN, THSD4, and ATP2A3, as well as a few of miRNAs in our bioinformatic analytic results previously referred. It is also to be expected that whether conditioning QSC or PDC by TCM could ameliorate the imbalanced genetic expression regulating network previously analyzed via WGCNA and GSEA assay, since the TCM herbs may act to influence multiple essential targets in NAFLD.
Conclusion
In order to lessen the onset of multiple complications or metabolic consequences of NAFLD and DM, it is of critical to intervention the pathophysiology of NAFLD in its early infancy. Such earlier intervention may lie in the adjustment of the effects of different genetic expression features, ie GSK, CYP7A1, SKIDA1, PHLDA1, OGN, THSD4, and ATP2A3, etc, as well as a few of miRNAs in glucolipid metabolism, with regulating hallmark genes involved in enriched gene sets and networks. Additionally, through the methodology of integrative medicine, we could link these candidates in the specific TCM constitutions including QSC and PDC to be regarded in our personalized treatment options. The result of current study provides both molecular and general systemic overview of the role of NAFLD in the pathophysiology of T2D. It proves the rationale of integrative methods as a helpful model to predict NAFLD progression to T2D and the personalized therapy, as well as prompts more researches to reveal the molecular features behind the different TCM constitution categories of NAFLD.
Data Sharing Statement
The data and material are conserved by Dr. Chengying Gu and can be accessed via contact the Email of Dr. Chengying Gu.
Ethical Approval and Consent to Participate
The TCM constitution study, including surveys, sampling, and examinations, have obtained ethics approvals from the Ethics Committee of Shanghai Pudong Hospital (NO.WZ-010). The informed consent was received from study participants before the whole study. The guidelines outlined and procedures were under the Declaration of Helsinki.
Consent for Publication
Written informed consent for publication was obtained from all participants.
Acknowledgments
The authors would like to thank the director, Wu Mei Hua of Laogang Community Health Service Center, for his immense contribution to the epidemiological investigation.
Author Contributions
All authors made a significant contribution to the work reported, whether that is in the conception, study design, execution, acquisition of data, analysis and interpretation, or in all these areas; took part in drafting, revising or critically reviewing the article; gave final approval of the version to be published; have agreed on the journal to which the article has been submitted; and agree to be accountable for all aspects of the work.
Funding
This study was supported by grants from the Key Specialist Project of Integrative Medicine for Metabolic Diseases in Pudong New Area (PWZzK2017-03), Pudong New Area Clinical Characteristic Discipline Project (Grant No. PWYts2021-11).
Disclosure
The authors declare that they have no competing interest in this work.
References
1. Federation I.D. IDF Diabetes Atlas.
2. Liu N, Wang G, Liu C, et al. Non-Alcoholic Fatty Liver Disease and Complications in Type 1 and Type 2 Diabetes: A Mendelian Randomization Study. Diabetes Obes Metab; 2022.
3. Riazi K, Azhari H, Charette JH, et al. The prevalence and incidence of NAFLD worldwide: a systematic review and meta-analysis. Lancet Gastroenterol Hepatol. 2022;7(9):851–861. doi:10.1016/S2468-1253(22)00165-0
4. Zhou J, Zhou F, Wang W, et al. Epidemiological features of NAFLD from 1999 to 2018 in China. Hepatology. 2020;71(5):1851–1864. doi:10.1002/hep.31150
5. Devarbhavi H, Asrani SK, Arab JP, et al. Global burden of liver disease: 2023 update. J Hepatol. 2023;79(2):516–537. doi:10.1016/j.jhep.2023.03.017
6. Song SJ. Reconstruction of Chinese medicine diagnosis and treatment system under the background of modern medicine. J Tradit Chin Med. 2018;59(1):6–9.
7. Wang Q. Primary compiling of constitution in Chinese medicine questionnaire. Chin J Clin Rehabilit. 2006;10(3):12–14.
8. Lu ZY, et al. Preliminary assessment on performance of constitution in Chinese medicine questionnaire. Chin J Clin Rehabilit. 2006;10(3):15–17.
9. Zhu YB, Wang Q, Origasa H. Evaluation on reliability and validity of the Constitution in Chinese Medicine Questionnaire (CCMQ). Zhongguo Xing Wei Yi Xue Ke Xue. 2007;16:651–654.
10. Qi W, Dong J, Wu H, Wang DP, Yao SL, Ren XJ. Study on the Molecular Characteristic in Phlegm-Dampness Constitution. Engineering Sciences; 2008.
11. Li L, Feng J, Yao H, et al. Gene expression signatures for phlegm-dampness constitution of Chinese medicine. Life Sci. 2017;60(1):105–107. doi:10.1007/s11427-016-0212-9
12. Wang Q. 阳虚体质者内分泌及免疫功能变化 [Changes of endocrine and immune function in subjects of yang deficiency constitution]. Zhong xi yi jie he xue bao. 2008;6(12):1226–1232. Chinese. doi:10.3736/jcim20081204
13. Wang Q, Yao S. Molecular basis for cold-intolerant yang-deficient constitution of traditional Chinese medicine. Am J Chin Med. 2008;36(5):827–834. doi:10.1142/S0192415X08006272
14. Zhao Y. Study on TCM syndromes of 3398 patients with metabolic syndrome. Liaoning J Tradit Chin Med. 2016;2016:1.
15. Zhou LB. Basic biology research on different types of syndrome of obese type 2 diabetes. China J Trad Chin Med Pharm. 2009;24(8):1023–1027.
16. Meng L, Wu T, Ji G, Zheng P-Y. Applications of metabolomics technology in traditional Chinese medicine treatment of non-alcoholic fatty liver disease. World Chin J Digestol. 2015;23(7):1045. doi:10.11569/wcjd.v23.i7.1045
17. Cai X, Wang M, Liu S, et al. Establishment and validation of a nomogram that predicts the risk of type 2 diabetes in obese patients with non-alcoholic fatty liver disease: a longitudinal observational study. Am J Transl Res. 2022;14(7):4505–4514.
18. Yang M. Professor Wei Zixiao’s treatment thoughts for pre-diabetes by TCM syndrome differentiation with the idea of preventive treatment of disease. World Chin Med. 2017;012(004):846–849.
19. Barrett T, Wilhite SE, Ledoux P, et al. NCBI GEO: archive for functional genomics data sets--update. Nucleic Acids Res. 2013;41:D991–D995. doi:10.1093/nar/gks1193
20. Arendt BM, Comelli EM, Ma DWL, et al. Altered hepatic gene expression in nonalcoholic fatty liver disease is associated with lower hepatic n-3 and n-6 polyunsaturated fatty acids. Hepatology. 2015;61(5):1565–1578. doi:10.1002/hep.27695
21. Guo J, Fang W, Sun L, et al. Ultraconserved element uc.372 drives hepatic lipid accumulation by suppressing miR-195/miR4668 maturation. Nat Commun. 2018;9(1):612. doi:10.1038/s41467-018-03072-8
22. López-Riera M, Conde I, Quintas G, et al. Non-invasive prediction of NAFLD severity: a comprehensive, independent validation of previously postulated serum microRNA biomarkers. Sci Rep. 2018;8(1):10606. doi:10.1038/s41598-018-28854-4
23. Torre D, Lachmann A, Ma’ayan A. BioJupies: automated generation of interactive notebooks for RNA-seq data analysis in the cloud. Cell Syst. 2018;7(5):556–561.e3. doi:10.1016/j.cels.2018.10.007
24. Huang DW, Sherman BT, Tan Q, et al. DAVID Bioinformatics resources: expanded annotation database and novel algorithms to better extract biology from large gene lists. Nucleic Acids Res. 2007;35(Web Server issue):W169–W175. doi:10.1093/nar/gkm415
25. Liao Y, Wang J, Jaehnig EJ, et al. WebGestalt 2019: gene set analysis toolkit with revamped UIs and APIs. Nucleic Acids Res. 2019;47(W1):W199–W205. doi:10.1093/nar/gkz401
26. Ge SX, Son EW, Yao R. iDEP: an integrated web application for differential expression and pathway analysis of RNA-Seq data. BMC Bioinform. 2018;19(1):534. doi:10.1186/s12859-018-2486-6
27. Mootha VK, Lindgren CM, Eriksson K-F, et al. PGC-1alpha-responsive genes involved in oxidative phosphorylation are coordinately downregulated in human diabetes. Nat Genet. 2003;34(3):267–273. doi:10.1038/ng1180
28. Subramanian A, Tamayo P, Mootha VK, et al. Gene set enrichment analysis: a knowledge-based approach for interpreting genome-wide expression profiles. Proc Natl Acad Sci USA. 2005;102(43):15545–15550. doi:10.1073/pnas.0506580102
29. National Workshop on Fatty Liver and Alcoholic Liver Disease, et al. Guidelines of prevention and treatment for nonalcoholic fatty liver disease: a 2018 update. J Prac Hepatol. 2018;21(02):30–39.
30. Wen S, Wang C, Gong M, et al. An overview of energy and metabolic regulation. Sci China Life Sci. 2019;62(6):771–790. doi:10.1007/s11427-018-9371-4
31. Gong M, et al. Converging relationships of obesity and hyperuricemia with special reference to metabolic disorders and plausible therapeutic implications. Target Ther. 2020;13:943–962.
32. Dai X, Feng J, Chen Y, et al. Traditional Chinese Medicine in nonalcoholic fatty liver disease: molecular insights and therapeutic perspectives. Chin Med. 2021;16(1):68. doi:10.1186/s13020-021-00469-4
33. Qi W. Classification and diagnosis basis of nine basic constitutions in Chinese medicine. J Beijing Univ Trad Chin Med. 2005;2005:1.
34. Xiaoqiu WU. Investigation of traditional Chinese medical constitution of type 2 diabetes mellitus patients and its relationship with insulin resistance and insulin secretion. J Guangzhou Univ Trad Chin Med. 2013.
35. Q. LZ, et al. Analysis about the relationship between the procedure of type 2 diabetes and the liver in traditional Chinese medicine. Int J Trad Chin Med. 2011;33(6):524–526.
36. Chu JK, Huo XH, Jin-Cheng MA. TCM symptoms distribution characteristics of nonalcoholic fatty liver disease and its related logistic factors analysis. China J Trad Chin Med Pharm. 2021;2021:1.
37. Bonnet F, Ducluzeau P-H, Gastaldelli A, et al. Liver enzymes are associated with hepatic insulin resistance, insulin secretion, and glucagon concentration in healthy men and women. Diabetes. 2011;60(6):1660–1667. doi:10.2337/db10-1806
38. Ahn HR, Shin MH, Nam HS, et al. The Association Between Liver Enzymes and Risk of Type 2 Diabetes: The Namwon Study. Diabetology & Metabolic Syndrome; 2014.
39. Cobbina E, Akhlaghi F. Non-alcoholic fatty liver disease (NAFLD) - pathogenesis, classification, and effect on drug metabolizing enzymes and transporters. Drug Metab Rev. 2017;49(2):197–211. doi:10.1080/03602532.2017.1293683
40. Wang J, Wang Q, Li L, et al. Phlegm-dampness constitution: genomics, susceptibility, adjustment and treatment with traditional Chinese medicine. Am J Chin Med. 2013;41(2):253–262. doi:10.1142/S0192415X13500183
41. Sternisha SM, Miller BG. Molecular and cellular regulation of human glucokinase. Arch Biochem Biophys. 2019;663:199–213. doi:10.1016/j.abb.2019.01.011
42. Chambers KF, Day PE, Aboufarrag HT, et al. Polyphenol effects on cholesterol metabolism via bile acid biosynthesis, CYP7A1: a review. Nutrients. 2019;11(11):2588. doi:10.3390/nu11112588
43. Wahlström A, Sayin S, Marschall H-U, et al. Intestinal crosstalk between bile acids and microbiota and its impact on host metabolism. Cell Metab. 2016;24(1):41–50. doi:10.1016/j.cmet.2016.05.005
44. McCreight LJ, Bailey CJ, Pearson ER. Metformin and the gastrointestinal tract. Diabetologia. 2016;59(3):426–435. doi:10.1007/s00125-015-3844-9
45. Pathak P, Xie C, Nichols RG, et al. Intestine farnesoid X receptor agonist and the gut microbiota activate G-protein bile acid receptor-1 signaling to improve metabolism. Hepatology. 2018;68(4):1574–1588. doi:10.1002/hep.29857
46. Talmud PJ, Drenos F, Shah S, et al. Gene-centric association signals for lipids and apolipoproteins identified via the HumanCVD BeadChip. Am J Hum Genet. 2009;85(5):628–642. doi:10.1016/j.ajhg.2009.10.014
47. Hendriks IA, Lyon D, Young C, et al. Site-specific mapping of the human SUMO proteome reveals co-modification with phosphorylation. Nat Struct Mol Biol. 2017;24(3):325–336. doi:10.1038/nsmb.3366
48. Zhou Y, Ren H, Dai B, et al. Hepatocellular carcinoma-derived exosomal miRNA-21 contributes to tumor progression by converting hepatocyte stellate cells to cancer-associated fibroblasts. J Exper Clin Cancer Res. 2018;37(1):324. doi:10.1186/s13046-018-0965-2
49. La Sala L, Mrakic-Sposta S, Tagliabue E, et al. Circulating microRNA-21 is an early predictor of ROS-mediated damage in subjects with high risk of developing diabetes and in drug-naïve T2D. Cardiovasc Diabetol. 2019;18(1):18. doi:10.1186/s12933-019-0824-2
50. Chen Y, Takikawa M, Tsutsumi S, et al. PHLDA 1, another PHLDA family protein that inhibits Akt. Cancer Sci. 2018;109(11):3532–3542. doi:10.1111/cas.13796
51. Liu T, Zhou Y, Ko KS, et al. Interactions between Myc and mediators of inflammation in chronic liver diseases. Mediators Inflamm. 2015;2015:276850. doi:10.1155/2015/276850
52. Zuo C, Li X, Huang J, et al. Osteoglycin attenuates cardiac fibrosis by suppressing cardiac myofibroblast proliferation and migration through antagonizing lysophosphatidic acid 3/matrix metalloproteinase 2/epidermal growth factor receptor signalling. Cardiovasc Res. 2018;114(5):703–712. doi:10.1093/cvr/cvy035
53. Petretto E, Sarwar R, Grieve I, et al. Integrated genomic approaches implicate osteoglycin (Ogn) in the regulation of left ventricular mass. Nat Genet. 2008;40(5):546–552. doi:10.1038/ng.134
54. Mori S. Association of genetic variations of genes encoding thrombospondin, type 1, domain-containing 4 and 7A with low bone mineral density in Japanese women with osteoporosis. J Hum Genet. 2008;53(8):694–697. doi:10.1007/s10038-008-0300-4
55. Hernández-Oliveras A. Histone deacetylase inhibitors promote ATP2A3 gene expression in hepatocellular carcinoma cells: p300 as a transcriptional regulator. Int J Biochem Cell Biol. 2019;113:8–16. doi:10.1016/j.biocel.2019.05.014
56. Decmann A, et al. MicroRNA expression profiling in adrenal myelolipoma. J Clin Endocrinol Metab. 2018;103(9):3522–3530. doi:10.1210/jc.2018-00817
 © 2023 The Author(s). This work is published and licensed by Dove Medical Press Limited. The
full terms of this license are available at https://www.dovepress.com/terms
and incorporate the Creative Commons Attribution
- Non Commercial (unported, 3.0) License.
By accessing the work you hereby accept the Terms. Non-commercial uses of the work are permitted
without any further permission from Dove Medical Press Limited, provided the work is properly
attributed. For permission for commercial use of this work, please see paragraphs 4.2 and 5 of our Terms.
© 2023 The Author(s). This work is published and licensed by Dove Medical Press Limited. The
full terms of this license are available at https://www.dovepress.com/terms
and incorporate the Creative Commons Attribution
- Non Commercial (unported, 3.0) License.
By accessing the work you hereby accept the Terms. Non-commercial uses of the work are permitted
without any further permission from Dove Medical Press Limited, provided the work is properly
attributed. For permission for commercial use of this work, please see paragraphs 4.2 and 5 of our Terms.
Recommended articles
Network Analysis of Osteoarthritis Progression Using a Steiner Minimal Tree Algorithm
Xie Y, Shao F, Ji Y, Feng D, Wang L, Huang Z, Wu S, Sun F, Jiang H, Miyamoto A, Wang H, Zhang C
Journal of Inflammation Research 2024, 17:3201-3209
Published Date: 18 May 2024