Back to Archived Journals » International Journal of Wine Research » Volume 12
The Influence of Conventional and Biodynamic Winemaking Processes on the Quality of Sangiovese Wine
Authors Picchi M, Canuti V ![]() , Bertuccioli M
, Bertuccioli M ![]() , Zanoni B
, Zanoni B ![]()
Received 8 January 2020
Accepted for publication 13 February 2020
Published 31 March 2020 Volume 2020:12 Pages 1—16
DOI https://doi.org/10.2147/IJWR.S245183
Checked for plagiarism Yes
Review by Single anonymous peer review
Peer reviewer comments 3
Editor who approved publication: Dr Roger Pinder
Monica Picchi, Valentina Canuti, Mario Bertuccioli, Bruno Zanoni
DAGRI – Department of Agricultural, Food, Environmental, and Forestry Sciences and Technologies, University of Florence, Firenze 50144, Italy
Correspondence: Valentina Canuti
DAGRI – Department of Agricultural, Food, Environmental, and Forestry Sciences and Technologies, University of Florence, via Donizetti, 6, Firenze 50144, Italy
Tel +39 055 2755517
Fax +39 055 2755500
Email [email protected]
Purpose: This research studied the impact of biodynamic and conventional winemaking processes, using biodynamic grapes, on both the intrinsic and perceived quality of some Sangiovese wines.
Materials and Methods: Three wineries producing biodynamic wine and a conventional winery participated in the study during the 2015 and 2016 harvests. Biodynamic and conventional winemaking protocols were applied on the same biodynamic Sangiovese grapes. The eligibility, identity, and style properties (the intrinsic quality) of both the biodynamic and conventional wines were measured after malolactic fermentation. Moreover, a group of experts evaluated the perceived quality by rating the overall quality and typicality of the wines.
Results: The experimental data showed that the intrinsic quality of Sangiovese wine samples was affected greatly by the vintage and winemaking protocol factors and slightly by the growing area factor. Significant differences in phenolic and aroma profile, intensity of taste, odor, and flavor attributes occurred between the biodynamic and conventional wine samples. The above differences in intrinsic quality levels did not lead to a different evaluation of either the perceived overall quality or perceived typicality by the wine experts.
Conclusion: The above result can be considered important because the biodynamic winemaking process affected the intrinsic quality level of the Sangiovese wines while the perceived overall quality and typicality of the biodynamic and conventional wines were not significantly different. The tested biodynamic wineries were able to produce appreciated biodynamic Sangiovese wine, as was the conventional one, but with the use of fewer resources in the winemaking process.
Keywords: Sangiovese, biodynamic wine, winemaking process, quality, typicality, volatile profile
Introduction
Recent surveys on consumer perceptions describe the wine market of the future as headed toward organic-labeled, carbon-free, vegan or other environmentally friendly products.1–3
Organic farming virtually excludes the use of synthetic fertilizers and pesticides, instead of relying on crop rotation, green manures, compost, natural fertilizers and pesticides, biological pest controls, mechanical cultivation, and modern technologies to build soil quality, supply plant nutrients, and control pests.4
Organic and biodynamic techniques are closely linked but with an important difference: in Europe, organic viticulture and winemaking are regulated by an official set of rules (EU Council Regulation EC No. 834/2007 and EC Reg No. 203/2012) while in other countries (eg, USA, Canada and Australia) has been regulated from 2000. Biodynamic production is instead a comprehensive organic farming method still founded on a “voluntary” basis, without any public intervention.5
In this perspective, the biodynamic winemaking process is more restrictive than the organic one, with even stricter limits.6 As an example, Demeter® (the most widespread voluntary biodynamic certification in Europe and the rest of the world) provides guidelines for the biodynamic winemaking process:7 exclusive use of indigenous yeasts; no added yeast nutrients; minimal use of sulfites; exclusive use of permitted adjuvants and additives.
Although some authors investigated the viticultural effects of biodynamic practices on wine grapes,8–10 few articles have reported the effect of these practices on wine quality.11,12 In some studies, it has been reported that eco-certification is associated with higher quality wines,12 even though this is not always perceived by consumers.13 Indeed, biodynamic wines have sometimes been reported as superior in quality to their conventional counterparts,11,14 or similar in other studies,9,10 but little information is available on the impact of the kind of winemaking process (organic, biodynamic, or conventional) on the chemical and sensory characteristics of wine.6,15
Food quality is commonly described as intrinsic quality and perceived quality. The ISO 9000–2015 defines intrinsic quality as the degree to which a set of inherent characteristics in an object fulfills the customer’s requirements. Many authors have dealt with the concept of intrinsic wine quality,16,17 defining the inherent physical-chemical characteristics of wine. For some wines, such as Protected Designation of Origin (PDO) wines, quality is integrated with an extra point relating to “typicality”, which is defined as those wine characteristics that are considered representative of the “terroir”.18 Considering the absence of defects as a pre-requisite, some authors19,20 proposed that quality is a combination of the following profiles of wine properties: (i) an eligibility profile, that is, it meets the needs of the globalized market whose terms are common to all wines (eg, the sensory attributes and chemical compounds related to acidity, astringency, balance, persistence, body, etc.); (ii) an identity profile, which reflects the territorial implications of the product on the sensory and aroma profiles; (iii) a style profile that represents the brand (ie, chemical compounds and sensory attributes related to the methods of conducting malolactic fermentation or derived from oak barrels, such as wood or vanilla). The eligibility profile parameters can change over time without effecting the identity of the wine,20 while the identity profile parameters (ie, varietal volatile compounds originating from the grape) can be considered the distinct characteristics that define the typicality of a wine.21
Wine rating, in which a customer or expert or critic assigns a score to a tasted wine, is the common method to evaluate perceived quality. Perceived quality may not be consistent with the intrinsic quality; the literature data16,22-24 has suggested that quality perception is a matter of the overall balance and complexity of perceptions, not just a matter of perception intensity.
The aim of this study was to evaluate the impact on wine quality of biodynamic and conventional winemaking processes using the same biodynamic Sangiovese grapes.
This study aimed to contribute to answering the following questions:
What are the intrinsic and perceived qualities of Sangiovese wines processed following biodynamic procedures? Is the Sangiovese biodynamic winemaking process able to differentiate the intrinsic and perceived qualities with respect to conventional processing?
Materials and Methods
Sangiovese Grape Samples and Winemaking Processes
The biodynamic Sangiovese red grapes were hand-harvested for the 2015 and 2016 vintages. For both vintages, the grapes were collected from three biodynamic estates in three different growing areas: two estates coded A and B located in the Chianti area of Tuscany (Cerreto Guidi, 43°45′42.12″N 10°52′37.56″E, 123 m elevation, Florence, Italy); one coded C in the Emilia Romagna region (San Clemente, 43°56ʹ2.04ʹ’N 12°37ʹ36.48ʹ’E, 180 m elevation, Ravenna, Italy). All three estates have produced biodynamic wines for at least 7 years.
For both vintages, each estate provided a 3500 kg lot of biodynamic Sangiovese grapes to perform the conventional vinification in a conventional winery located in the Chianti area (Montespertoli, Tuscany), and the processed wines were coded as follows: A15CONV, A16CONV, B15CONV, B16CONV, C15CONV and C16CONV. At the same time, each biodynamic estate vinified its own lot of grapes in the winery following the usual biodynamic winemaking protocols for both vintages, and the processed wines were coded as follows: A15BIOD, A16BIOD, B15BIOD, B16BIOD, C15BIOD and C16BIOD. Since it was not allowed to set the conventional vinifications in the biodynamic wineries because of the possibility of selected yeasts contamination, it was necessary to perform the conventional ones in an external conventional winery. Both the kind of trials were on industrial scale in order to reproduce the real conditions of the wine process and they were performed for two different vintages (2015 and 2016).
All the grapes were analyzed upon harvesting to measure the chemical characteristics and phenolic maturity (Table 1).
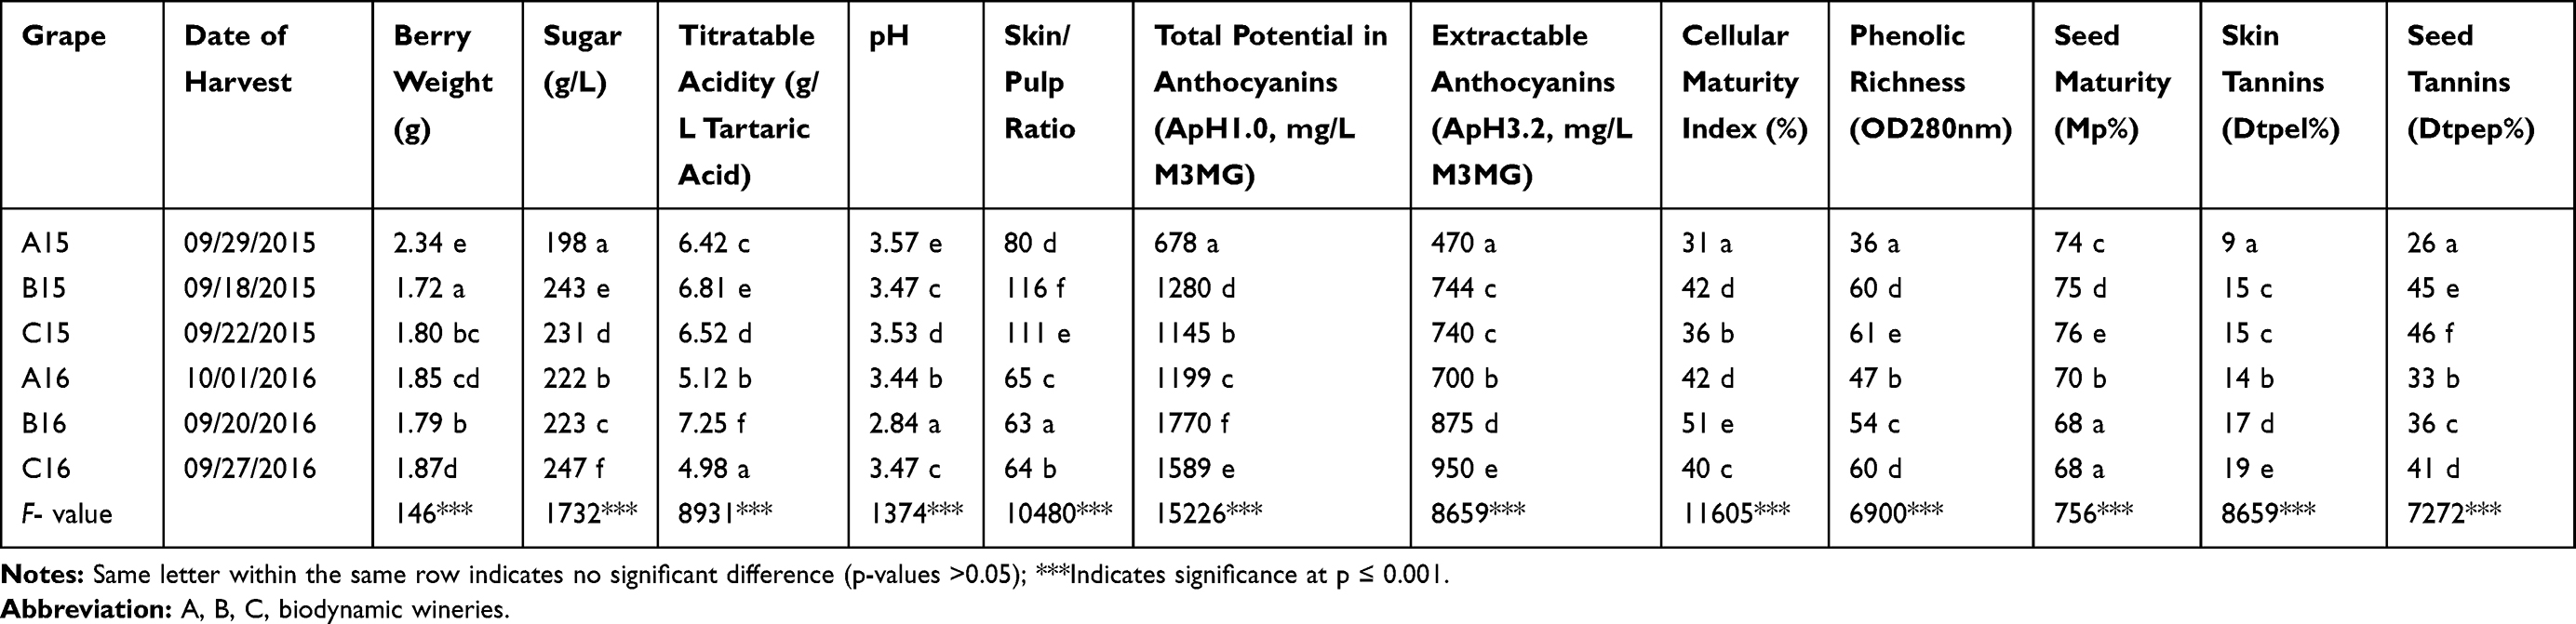 |
Table 1 Composition of Sangiovese Biodynamic Grapes at 2015 and 2016 Harvests: Mean Values, F-Values and Least Significant Difference (LSD) |
Table 2 summarizes the winemaking protocols applied in the biodynamic and conventional wineries during the fermentation/maceration of the grapes. In particular, it gives information about the tank material, fermentation/maceration time, added products, color extraction techniques, and conduction of malolactic fermentation.
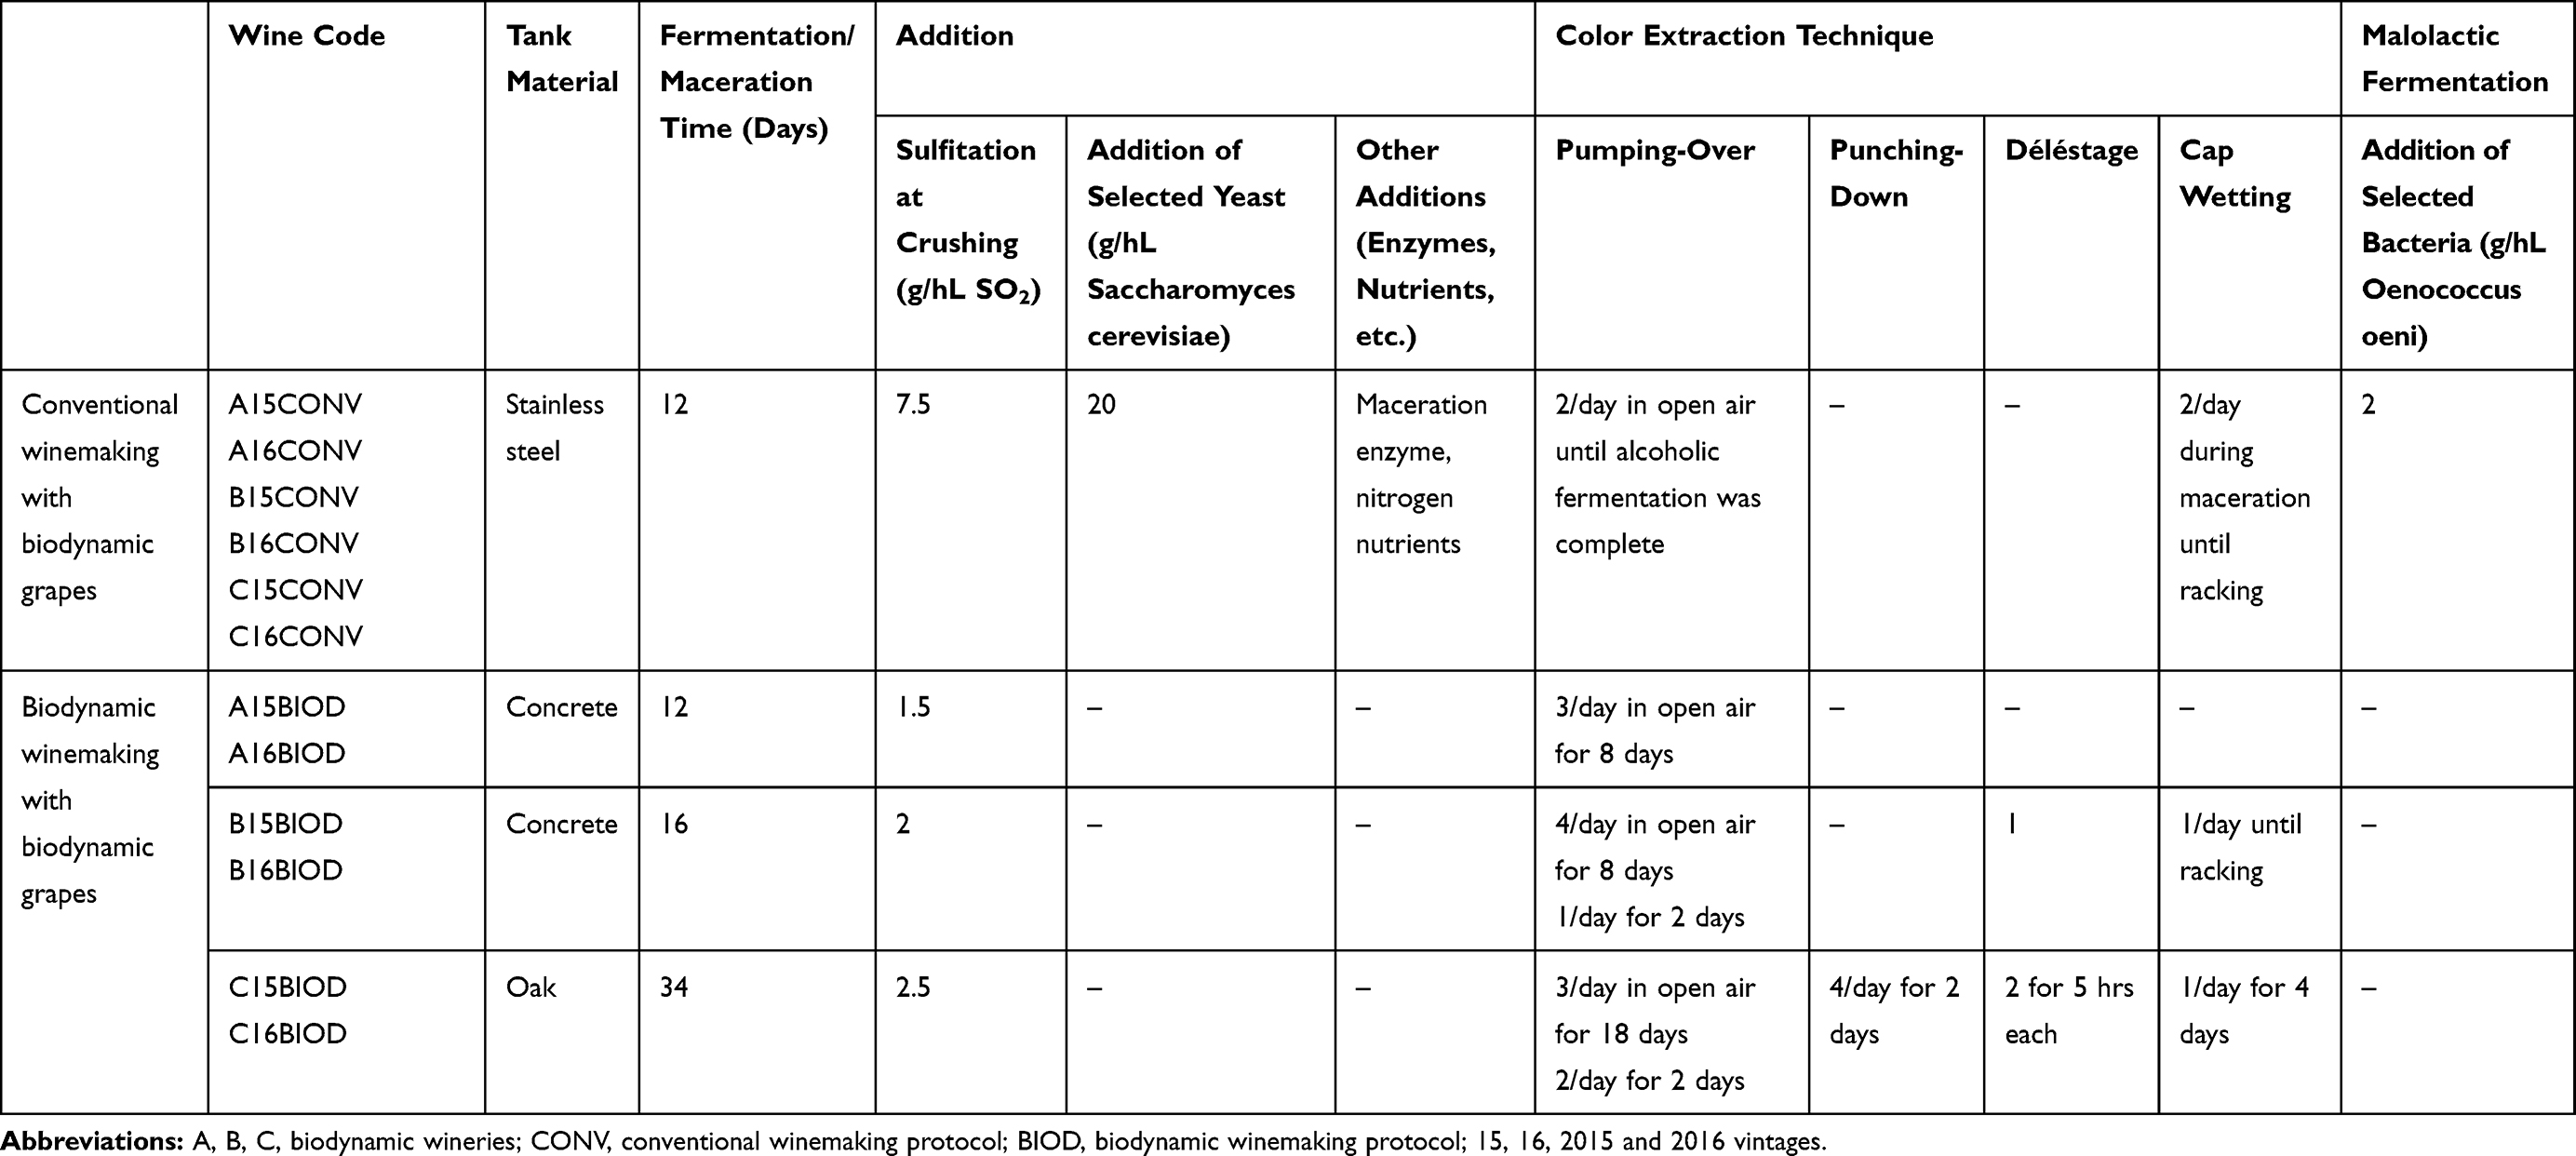 |
Table 2 Biodynamic and Conventional Winemaking Protocol Applied During Fermentation/Maceration (2015 and 2016 Vintages) |
All of the grapes were destemmed and crushed immediately after the hand-harvest. During the fermentation/maceration, the density and temperature of the must/wines were monitored daily (data not shown). The malolactic fermentation was completed in both the biodynamic and conventional processes, the wines were racked, the total sulfites adjusted to 50 mg/L and then the wines were bottled in 750 mL glass bottles, which were closed with corks and stored in temperature-controlled cells at 18°C until analysis.
Chemical Analyses
Chemical Characteristics of Grapes
The fresh grapes were analyzed upon harvesting to measure the technological maturity (berry weight, skin/pulp ratio, sugars, titratable acidity, pH) according to official OIV methods (Compendium of International Methods of Analysis – OIV – Oeno 21/2004). Two hundred berries were pressed to extract their juice. The juice sugar content (Brix), titratable acidity (g/L), and pH were measured after centrifugation of the juice at 3000 rpm for 10 min. The berry weight was determined as the ratio between the total weight and the number of berries. The phenol maturity indices (total potential and extractable anthocyanins, phenolic richness, grape seed maturity, skin and seed tannins) were measured according to the method proposed by Saint-Cricq et al.25 All the grape samples were analyzed in triplicates.
Chemical Characteristics for Measuring Eligibility, Identity, and Style Wine Properties
The chemical characterization of the wines was carried out after the malolactic fermentation according to Bertuccioli et al19 and Canuti et al.20 The eligibility chemical characteristics were represented by standard parameters and polyphenol profiles as shown in Table 3. The identity chemical characteristics were represented by the volatile fractions of the wines as shown in Table 3. The style requirement was instead represented by the chemical variables related to wine aging (ie, vanillin and γ-lactones).
 | 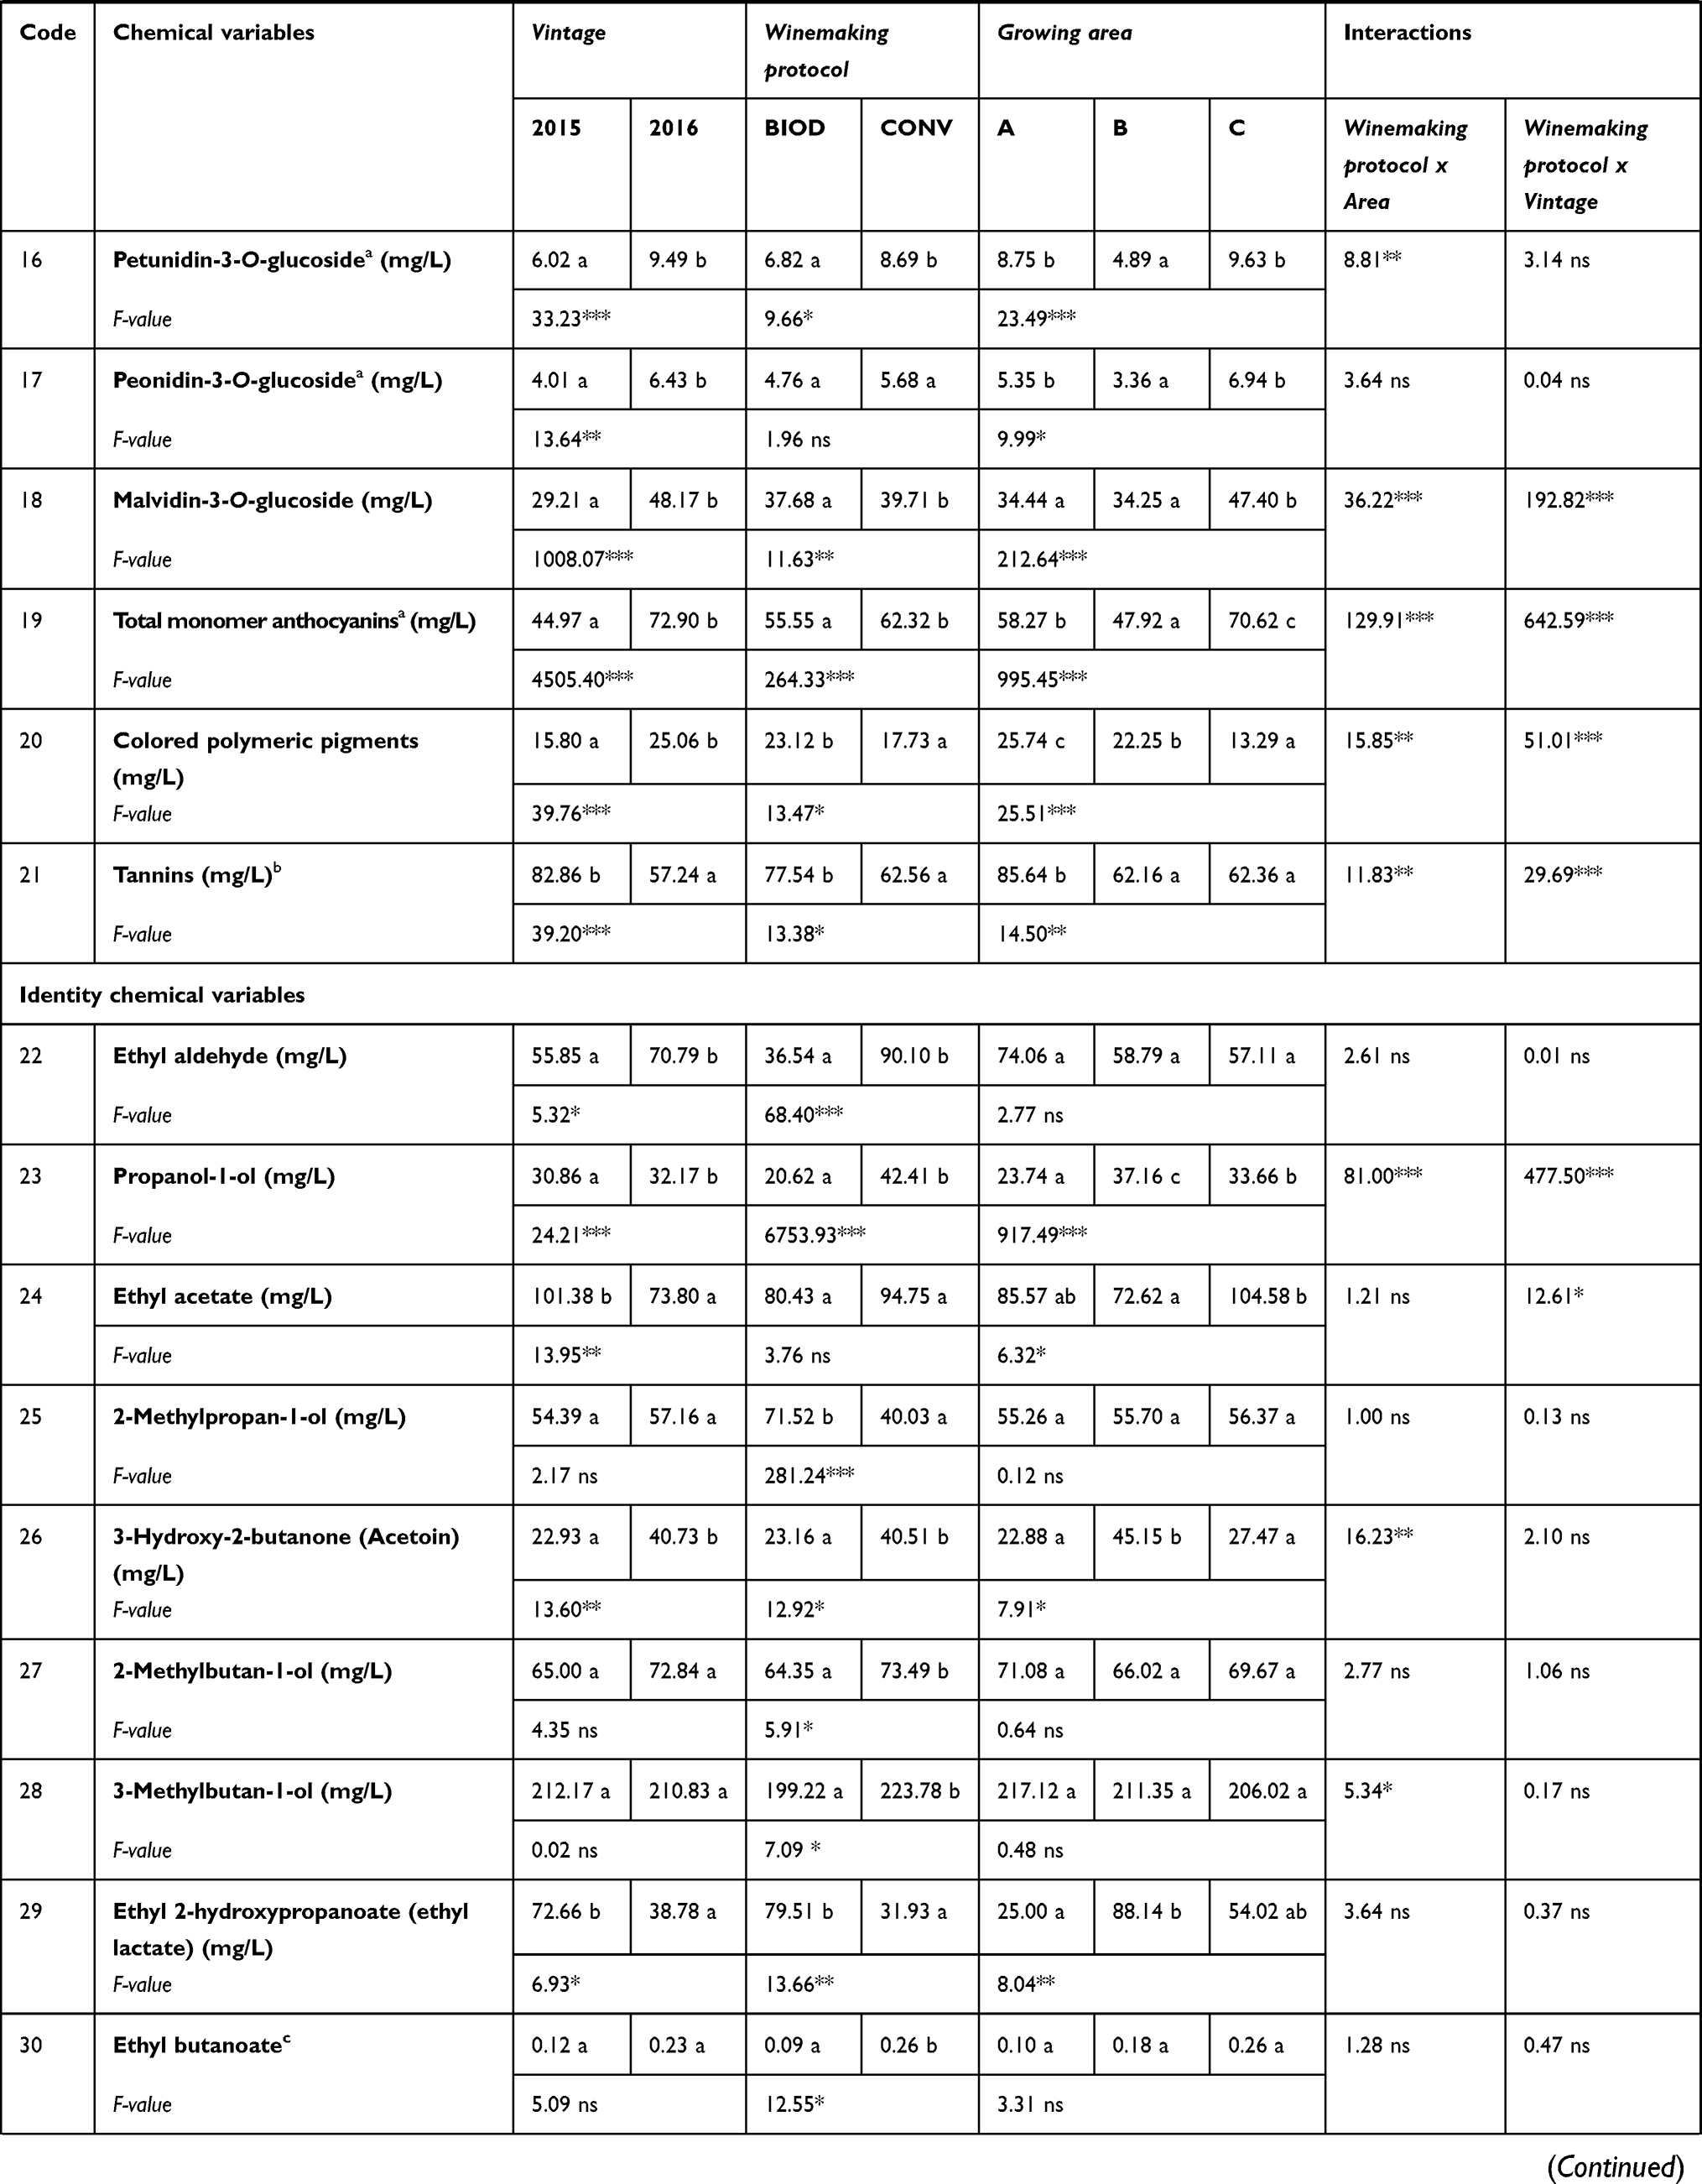 | 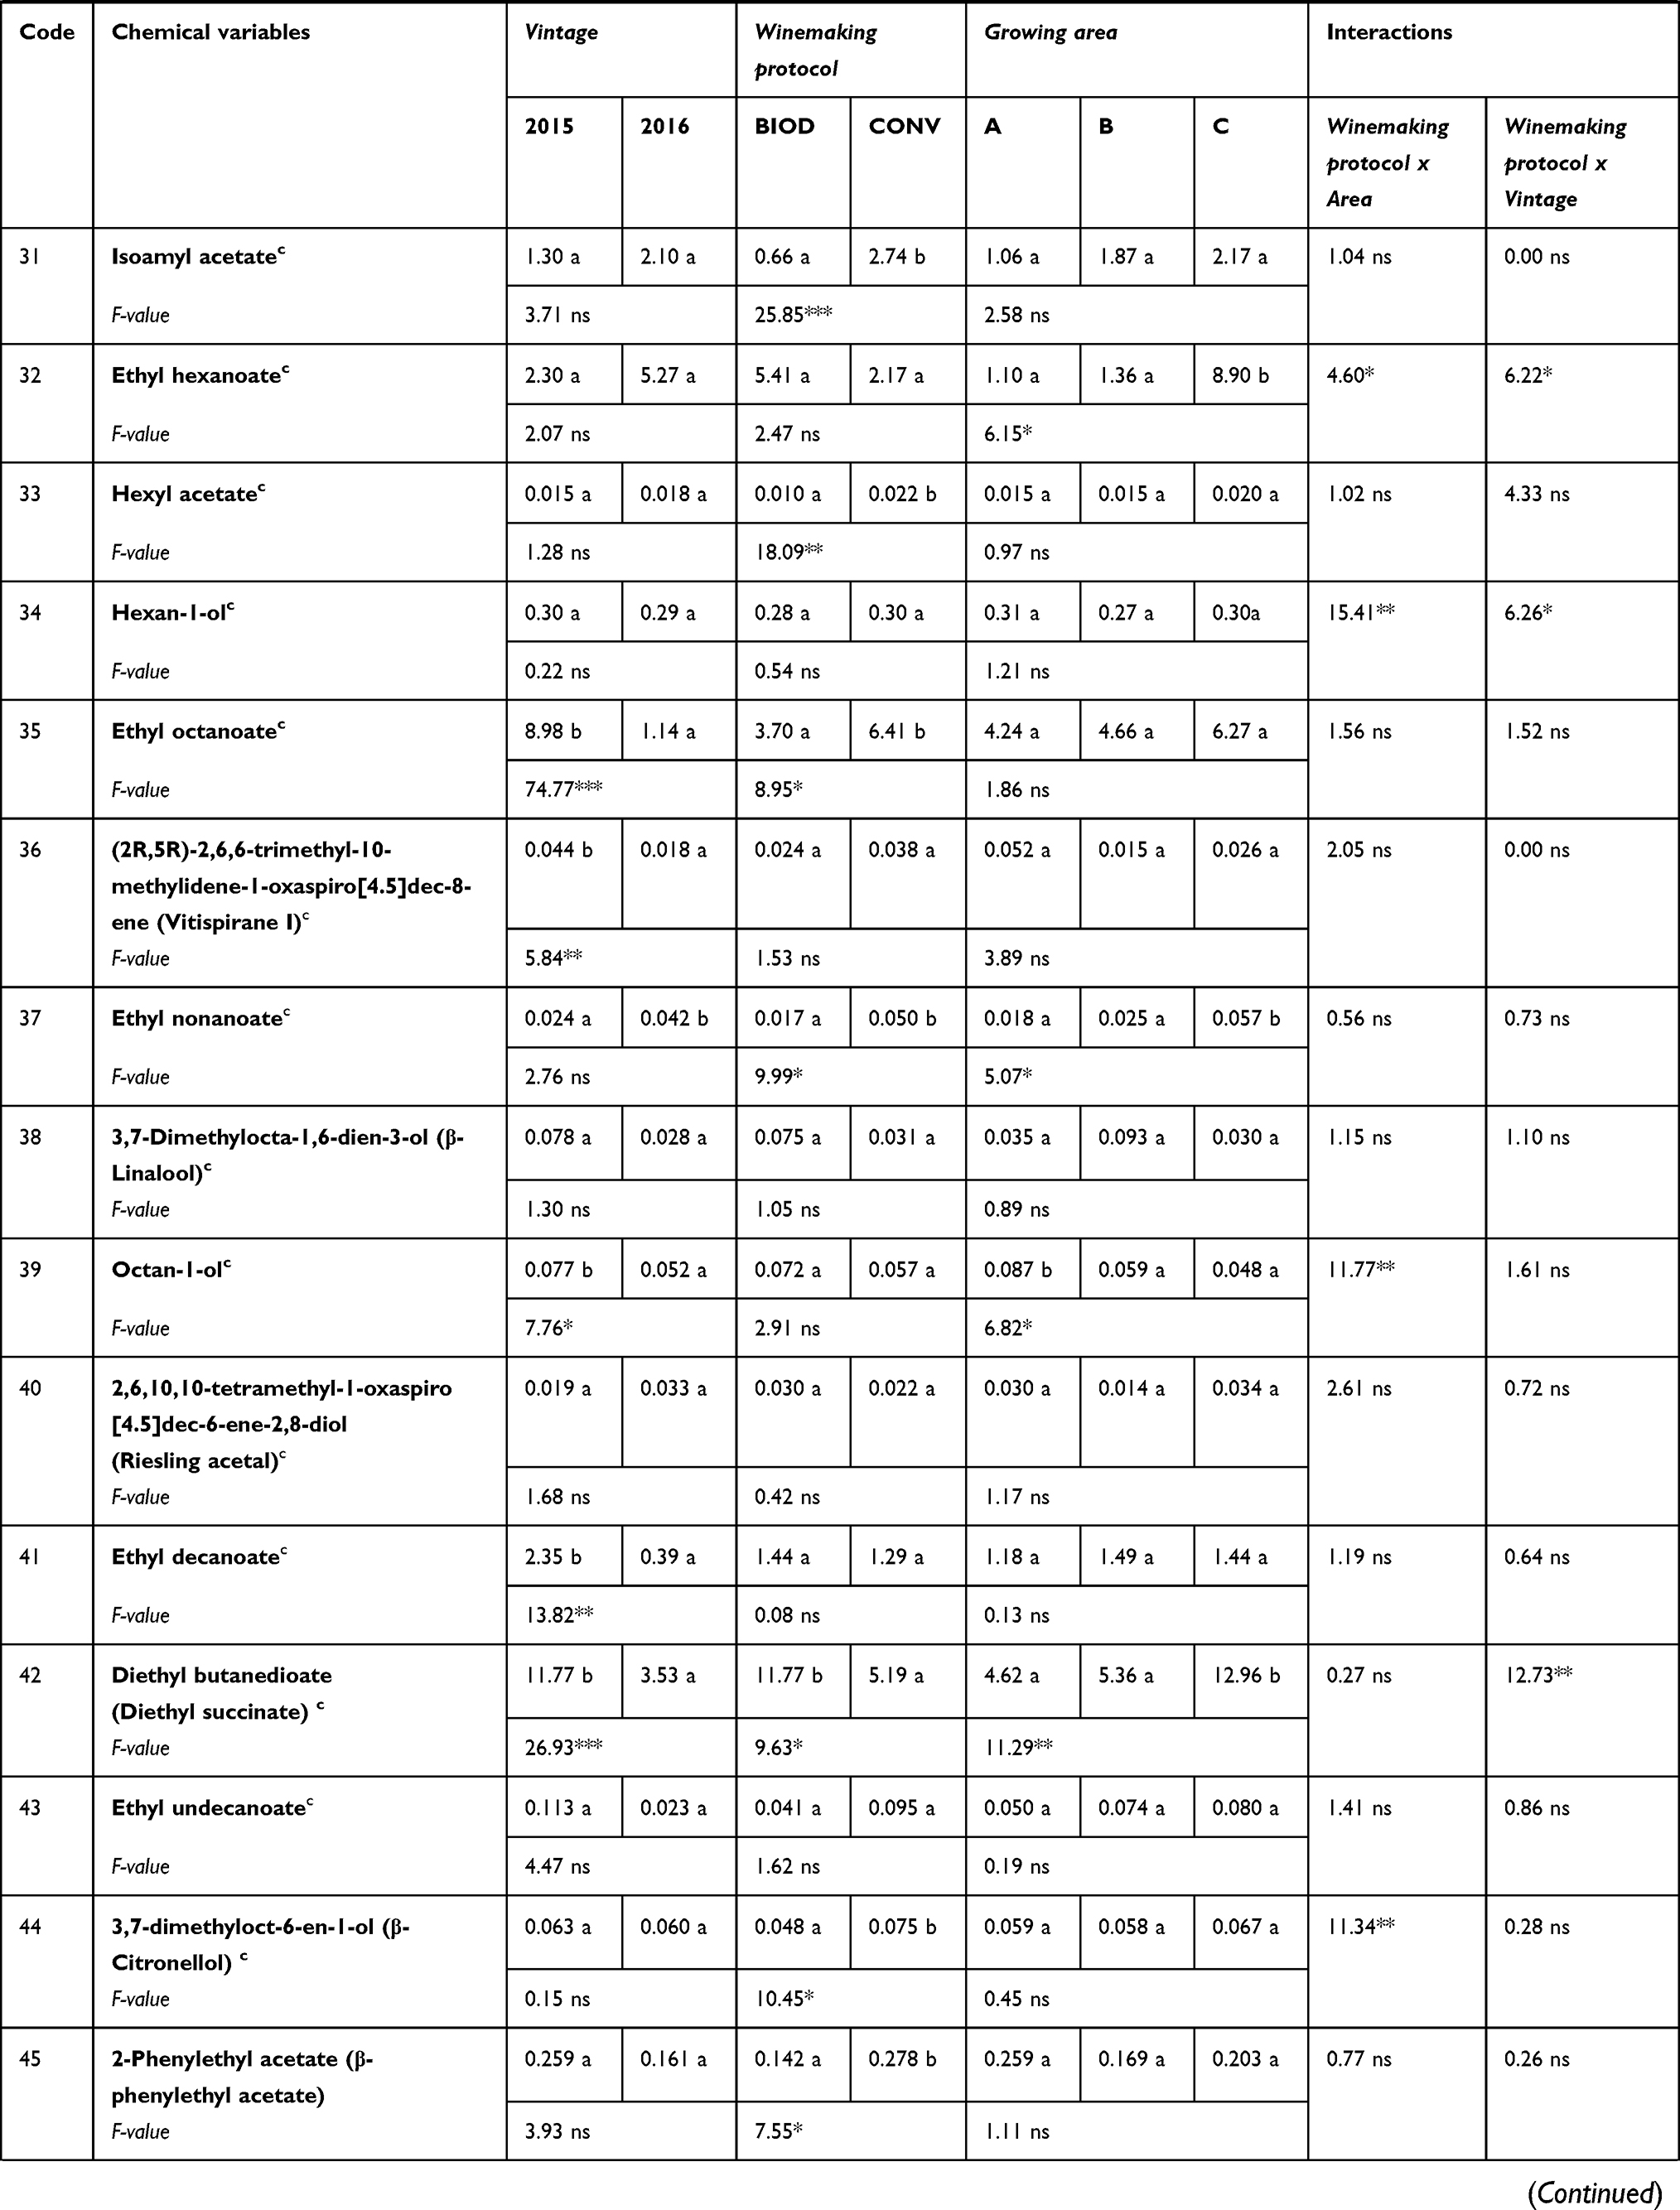 | 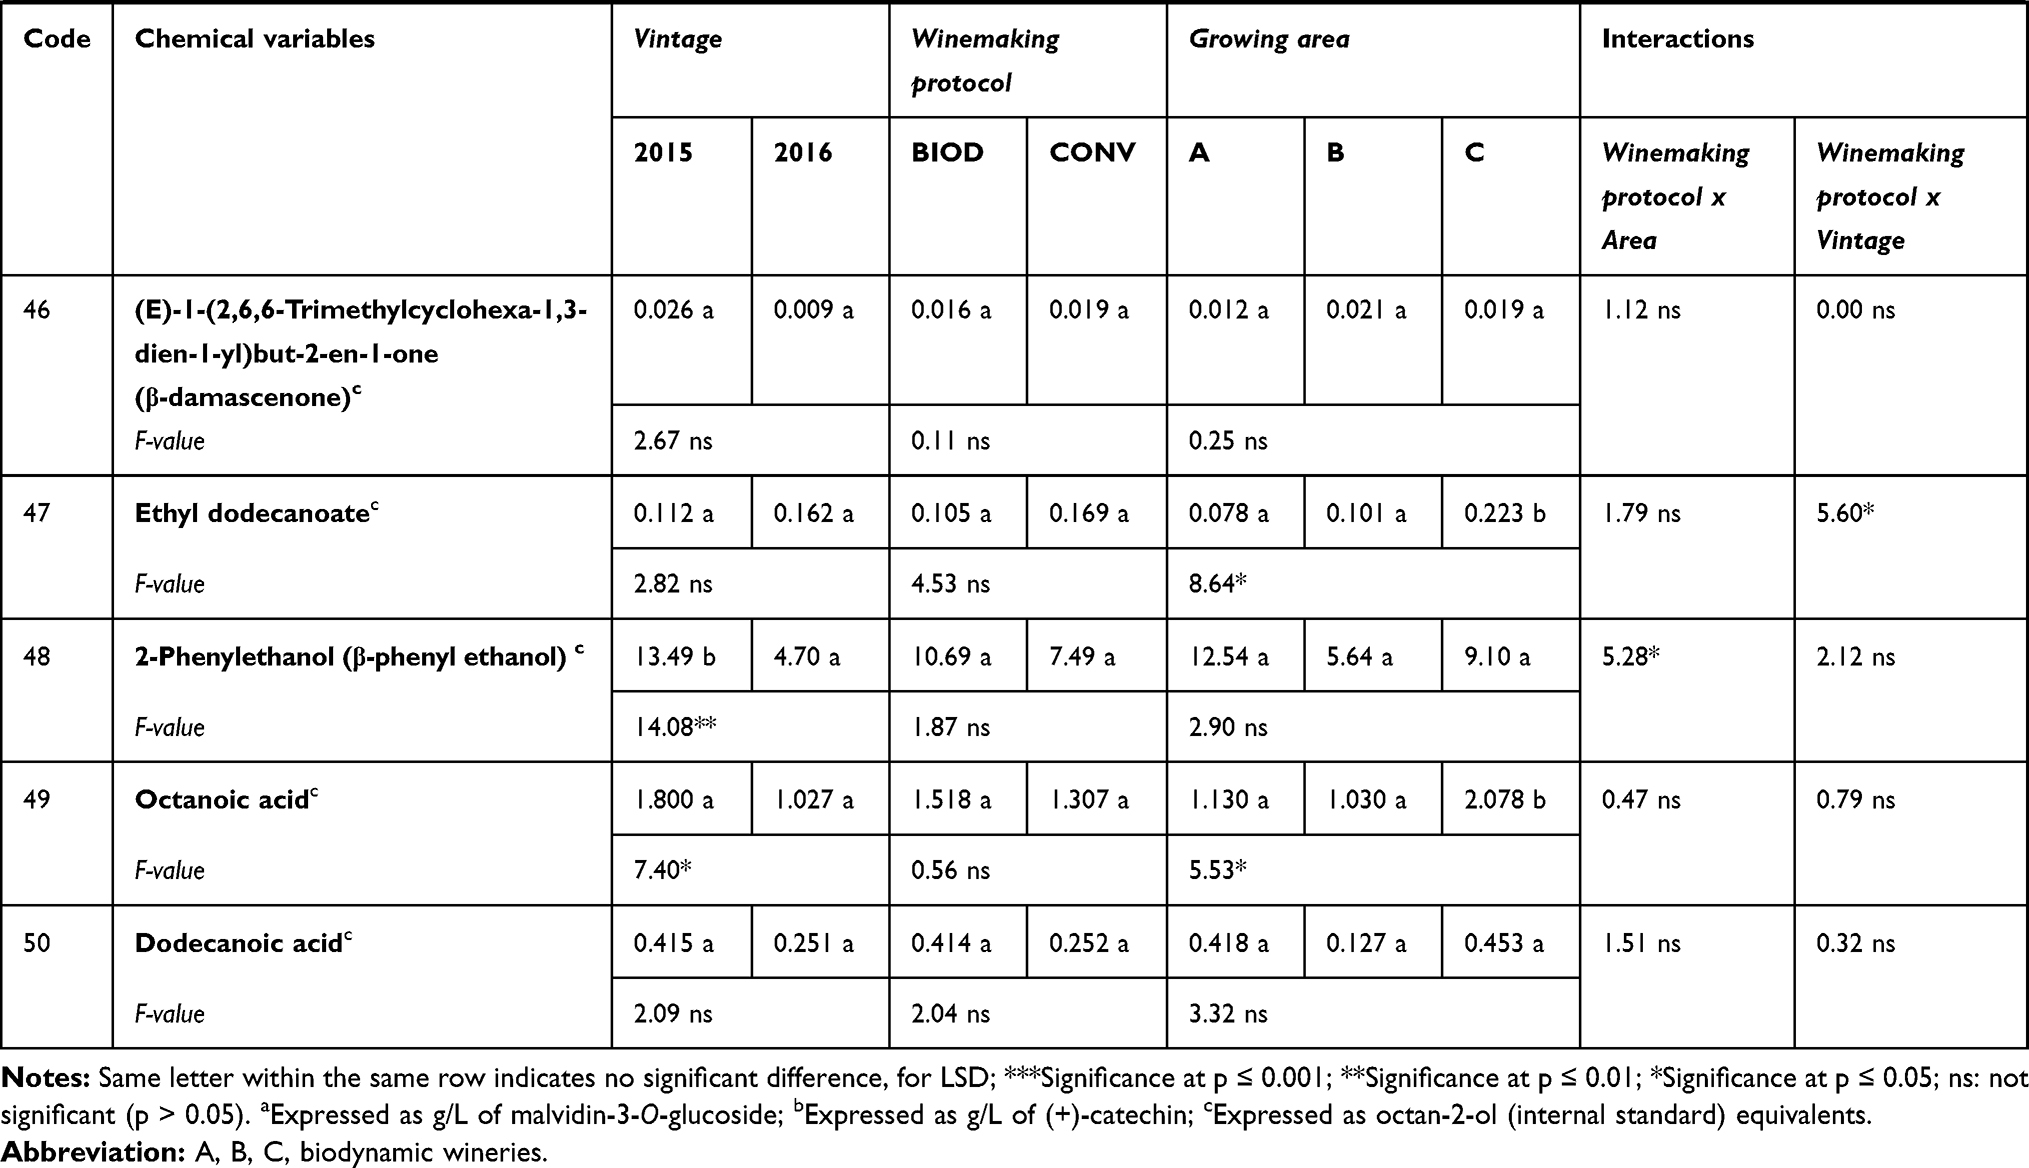 |
Table 3 Eligibility and Identity Chemical Variables Measured in the 2015 and 2016 Conventional (CONV) and Biodynamic (BIOD) Wines: Average, Interactions, F-Values and Least Significant Difference (LSD)1,2 |
The standard parameters (pH, titratable acidity, volatile acidity, alcohol content, residual sugars) were measured according to the official EU methods (Official Methods of Wine Analysis, Reg. 440/2003).
Phenolic and volatile characterization of the wines were performed according to literature.
Monomers and polymerized anthocyanins (colored polymeric pigments) (both expressed as malvidin-3-O-glucoside), and tannins (expressed as (+)-catechin) were measured by HPLC,26,27 and they were carried out on a Perkin Elmer Series 200 LC equipped with an autosampler and a diode-array detector (Perkin Elmer, Shelton, CT, USA). Chromatograms were acquired at 280 nm and 520 nm, recorded, and processed using Total Chrome Navigator software (PerkinElmer).
Color intensity and hue value were measured according to Glories (1984),28 the total phenols index was measured as described by Ribereau-Gayon (1970),29 and the gelatin index according to Mirabel (2000).30 The ultraviolet-visible (UV/vis) absorbance of the samples was measured on a Perkin Elmer Lambda 35 UV/Vis spectrophotometer (Perkin Elmer, Shelton, CT, USA).
CIE (Commission Internationale de l’Eclairage) L*a* and b* color coordinates were also measured according to the literature. Visible spectra were recorded at 400–700 nm reflectance using the same spectrophotometer equipped with the RSA-PE-20 Integrating Sphere accessory assembly (Labsphere, North Sutton, NH). A dark brown standard was used to evaluate measurement performance for each analysis session. UV WinLab Software was used to record the spectra (version 2.85.04, Perkin Elmer Inc.) and CIE L*a*b* color coordinates were calculated using Color software (version 3.00, 2001, Perkin Elmer Inc.).
Higher alcohols and ethyl aldehyde31 were determined using an AutoSystem XL gas chromatograph equipped with flame ionization detector. The free volatile profile was determined according to a method developed by Canuti et al.32 The analytical system for the determination of the volatile compounds comprised an AutoSystem XL gas chromatograph (Perkin Elmer) paired with a Turbomass Gold mass selective detector (Perkin Elmer). The software used was TurboMass v.5.1.0. An Innowax column (30 m × 0.25 mm o.d., 0.25 μm film thickness, Agilent Technology) was used for all analyses.
All the wine samples were analyzed in triplicates.
Sensory Analyses
All of the evaluations were performed in isolated, ventilated sensory booths under red lights, to eliminate bias attributed to color differences. The presentation was monadic with a balanced presentation order and carry-over effect,33 with six wines per session. The wine samples (30 mL) were poured at room temperature (around 19°C) and presented in standard tasting glasses (ISO-3591, 1977) covered with plastic lids and identified by random three-digit codes. In each step, the samples were evaluated globally (ie, orthonasal aroma after swirling, plus retronasal aroma, taste, and mouthfeel after sipping). Water was provided as a palate cleanser. All of the sensory data were collected using FIZZ software (Version 2.00L, Biosystemes, Couternon, France).
Sensory Attributes Measuring Eligibility, Identity, and Style Wine Properties
Sensory analyses were carried out by a panel of trained judges following the Quantitative Descriptive Analysis (QDA) method. Wine sensory characterization was performed after the malolactic fermentation. The samples were subjected to QDA by a panel of 13 trained judges (8 males and 5 females) in 2015 and 16 trained judges (10 males and 6 females) in 2016, who evaluated the wines in three replications in three subsequent sessions. The sensory data from the two descriptive analyses were combined using the shared or synonymous attributes and standardized to mean zero for each sensory attribute within each descriptive analysis.
According to Bertuccioli et al19 and Canuti et al,20 the eligible sensory profile was described by the three following attributes: acidity, sweetness, and astringency. The identity profile was defined by the following nine aromatic attributes: blackberry, prune, cherry, floral, vegetal, and spicy odor, fruity, floral, and vegetal in-mouth flavor. One attribute described the style requirement, that is wood odor and in-mouth flavor.
After every sample, the judges were obliged to wait 60 s, during which time they had to rinse their mouth with water. All of the samples were expectorated. Every evaluation session lasted about 15 mins. The panelists answered on a 10-point category scale (one scale per sample), anchored with 1 (absent) at the left end and 10 at the right end (very strong). The reference standards submitted to the judges corresponded to 6 on the intensity scale (medium intensity).
Wine Rating of Overall Quality and Typicality
The evaluation of overall quality and typicality was performed by 12 wine experts, 9 men and 3 women (producers, oenologists, and wine-makers), selected on the basis of their extensive experience34 with Sangiovese wine. In fact, the experts’ repeated experience of the products, within and outside the wine category, allows them the definition of the references to adjust the concept of the wine type and of the limits in terms of variation from the ideal example that can be tolerated before a wine is deemed outside the concept.21 Six of them worked in biodynamic production and 6 in conventional production. Before the session, they were instructed to consider overall quality and typicality independently from each other,35 as the samples may have been good even if they were not very representative of the product type (Sangiovese in this case). In keeping with this view, for the evaluation of overall quality, the judges were asked to consider the following aspects:16 i) no defects as a pre-requisite; ii) balance; iii) intensity, complexity, and elegance of flavor; iv) persistence of flavor (length); v) body. They had to express their judgments through a synthetic score including all of the considered characteristics, on a category scale (one scale per sample) from 1 to 7, in which the levels were anchored to the following definitions: Insufficient, Sufficient, Fair, Good, Very Good, Optimal, and Excellent.
Typicality was evaluated using the same set but on another card, with a different presentation order. The assessors were instructed as follows:36
Imagine that you want to explain to someone what a Sangiovese wine is. To explain, you suggest that this person tastes a wine. For each wine presented, you must answer the following question: Do you think that this wine is a good or a bad example of what a Sangiovese wine is?
The panelists answered on a category scale (one scale per sample) of 7 levels like the previous one, anchored to a “very bad example” on the left end and a “very good example” on the right end.
The whole session lasted about 20 min.
Statistical Analyses
The chemical and sensory data of the wines were analyzed by multifactor analyses of variance (MANOVA), and frequency distribution, analyzed by the Chi-square test, were performed using Statgraphics Centurion (Ver.XV, StatPoint Technologies, Warrenton, VA). Vintage (2015, 2016), Winemaking Protocol (biodynamic, conventional), Growing Area (A, B, C), and Replicates were considered as factors for both the chemical and the sensory analysis. Two-way interactions (Winemaking Protocol by Growing Area; Winemaking Protocol by Vintage) were considered for each chemical and sensory characteristic.
Results
Quality Evaluation as Inherent Chemical Characteristics
In all of the Sangiovese wine samples, the inherent chemical characteristics that represent the eligibility and identity wine properties were identified (Table 3). Instead, the style chemical characteristics were not considered, since no relevant volatile compounds (ie, vanillin and γ-lactones) were detected in the wine samples.
The eligible chemical characteristics were affected by the Vintage factor. Significantly higher color intensity, L*, a* and b* values, delphinidin-3-O-glucoside, cyanidin-3-O-glucoside, petunidin-3-O-glucoside, peonidin-3-O-glucoside, malvidin-3-O-glucoside, total monomer anthocyanins, and colored polymeric pigments contents were measured in the 2016 vintage (p ≤ 0.001). Significantly higher tannin content and hue value were measured in the 2015 vintage (p ≤ 0.01).
The Winemaking Protocol significantly affected the alcohol content, titratable acidity content, and the chemical characteristics related to the wine color (p ≤ 0.001). A higher alcohol content and lower titratable acidity were measured in the biodynamic wines. Higher color intensity, a* value, delphinidin-3-O-glucoside, cyanidin-3-O-glucoside, petunidin-3-O-glucoside, malvidin-3-O-glucoside, and total monomer anthocyanins contents were measured in the conventional wines, while a higher total phenols index, hue, L* and b* values, tannins (p ≤ 0.05), and colored polymeric pigments (p ≤ 0.05) content were measured in the biodynamic wines.
When the data were processed using the Growing Area factor, most of the characteristics related to the phenolic profile resulted significantly affected (p ≤ 0.001). In particular, growing area A showed the highest values of the total phenols index, color intensity, L*, a*, delphinidin-3-O-glucoside, cyanidin-3-O-glucoside, colored polymeric pigments, and tannin content. Growing area C showed the highest values for hue, petunidin-3-O-glucoside, peonidin-3-O-glucoside, malvidin-3-O-glucoside, and total monomer anthocyanins content.
With regard to the identity chemical characteristics, the aromatic compounds resulted significantly affected by the Vintage factor. Significantly higher vitispirane I (p ≤ 0.01), ethyl octanoate (p ≤ 0.001), diethyl succinate (p ≤ 0.001), and 2-phenylethanol (p ≤ 0.001) contents were measured in the 2015 vintage, while a higher acetoin (p ≤ 0.01) content was measured in the 2016 vintage.
Significantly higher ethyl aldehyde (p ≤ 0.001), β-citronellol (p ≤ 0.05), propan-1-ol (p ≤ 0.001), isoamyl acetate (p ≤ 0.001), and hexyl acetate (p ≤ 0.01) contents were measured in the conventional winemaking process. A higher 2-methylpropan-1-ol content was measured in the biodynamic wines.
The identity chemical characteristics were slightly affected by the Growing Area factor. Only the propan-1-ol, diethyl succinate, and ethyl lactate contents were significantly different between the growing areas.
With regard to the interactions between the factors, the experimental data (Table 3) showed that the interaction between the Winemaking Protocol and Growing Area was the most significant (p ≤ 0.001) for the total phenols index (F = 43.98), color intensity (F = 5386.59), L* (F = 192.64) and a* (F = 112.37) values, and total monomeric anthocyanins content (F = 129.91). Total monomeric anthocyanins (F = 642.59), colored polymeric pigments (F = 51.01), and tannin content (F = 29.69) were highly significant for the interaction between Winemaking Protocol and Vintage. Of the identity chemical characteristics, only the propan-1-ol content resulted highly significant (p ≤ 0.001) for the interaction between the Winemaking Protocol and Growing Area (F = 81.00) and the Winemaking Protocol and Vintage (F = 477.50).
Quality Evaluation in Terms of Inherent Sensory Characteristics
The inherent sensory characteristics that represent the eligibility, identity, and style wine properties were identified in all of the Sangiovese wine samples (Table 4).
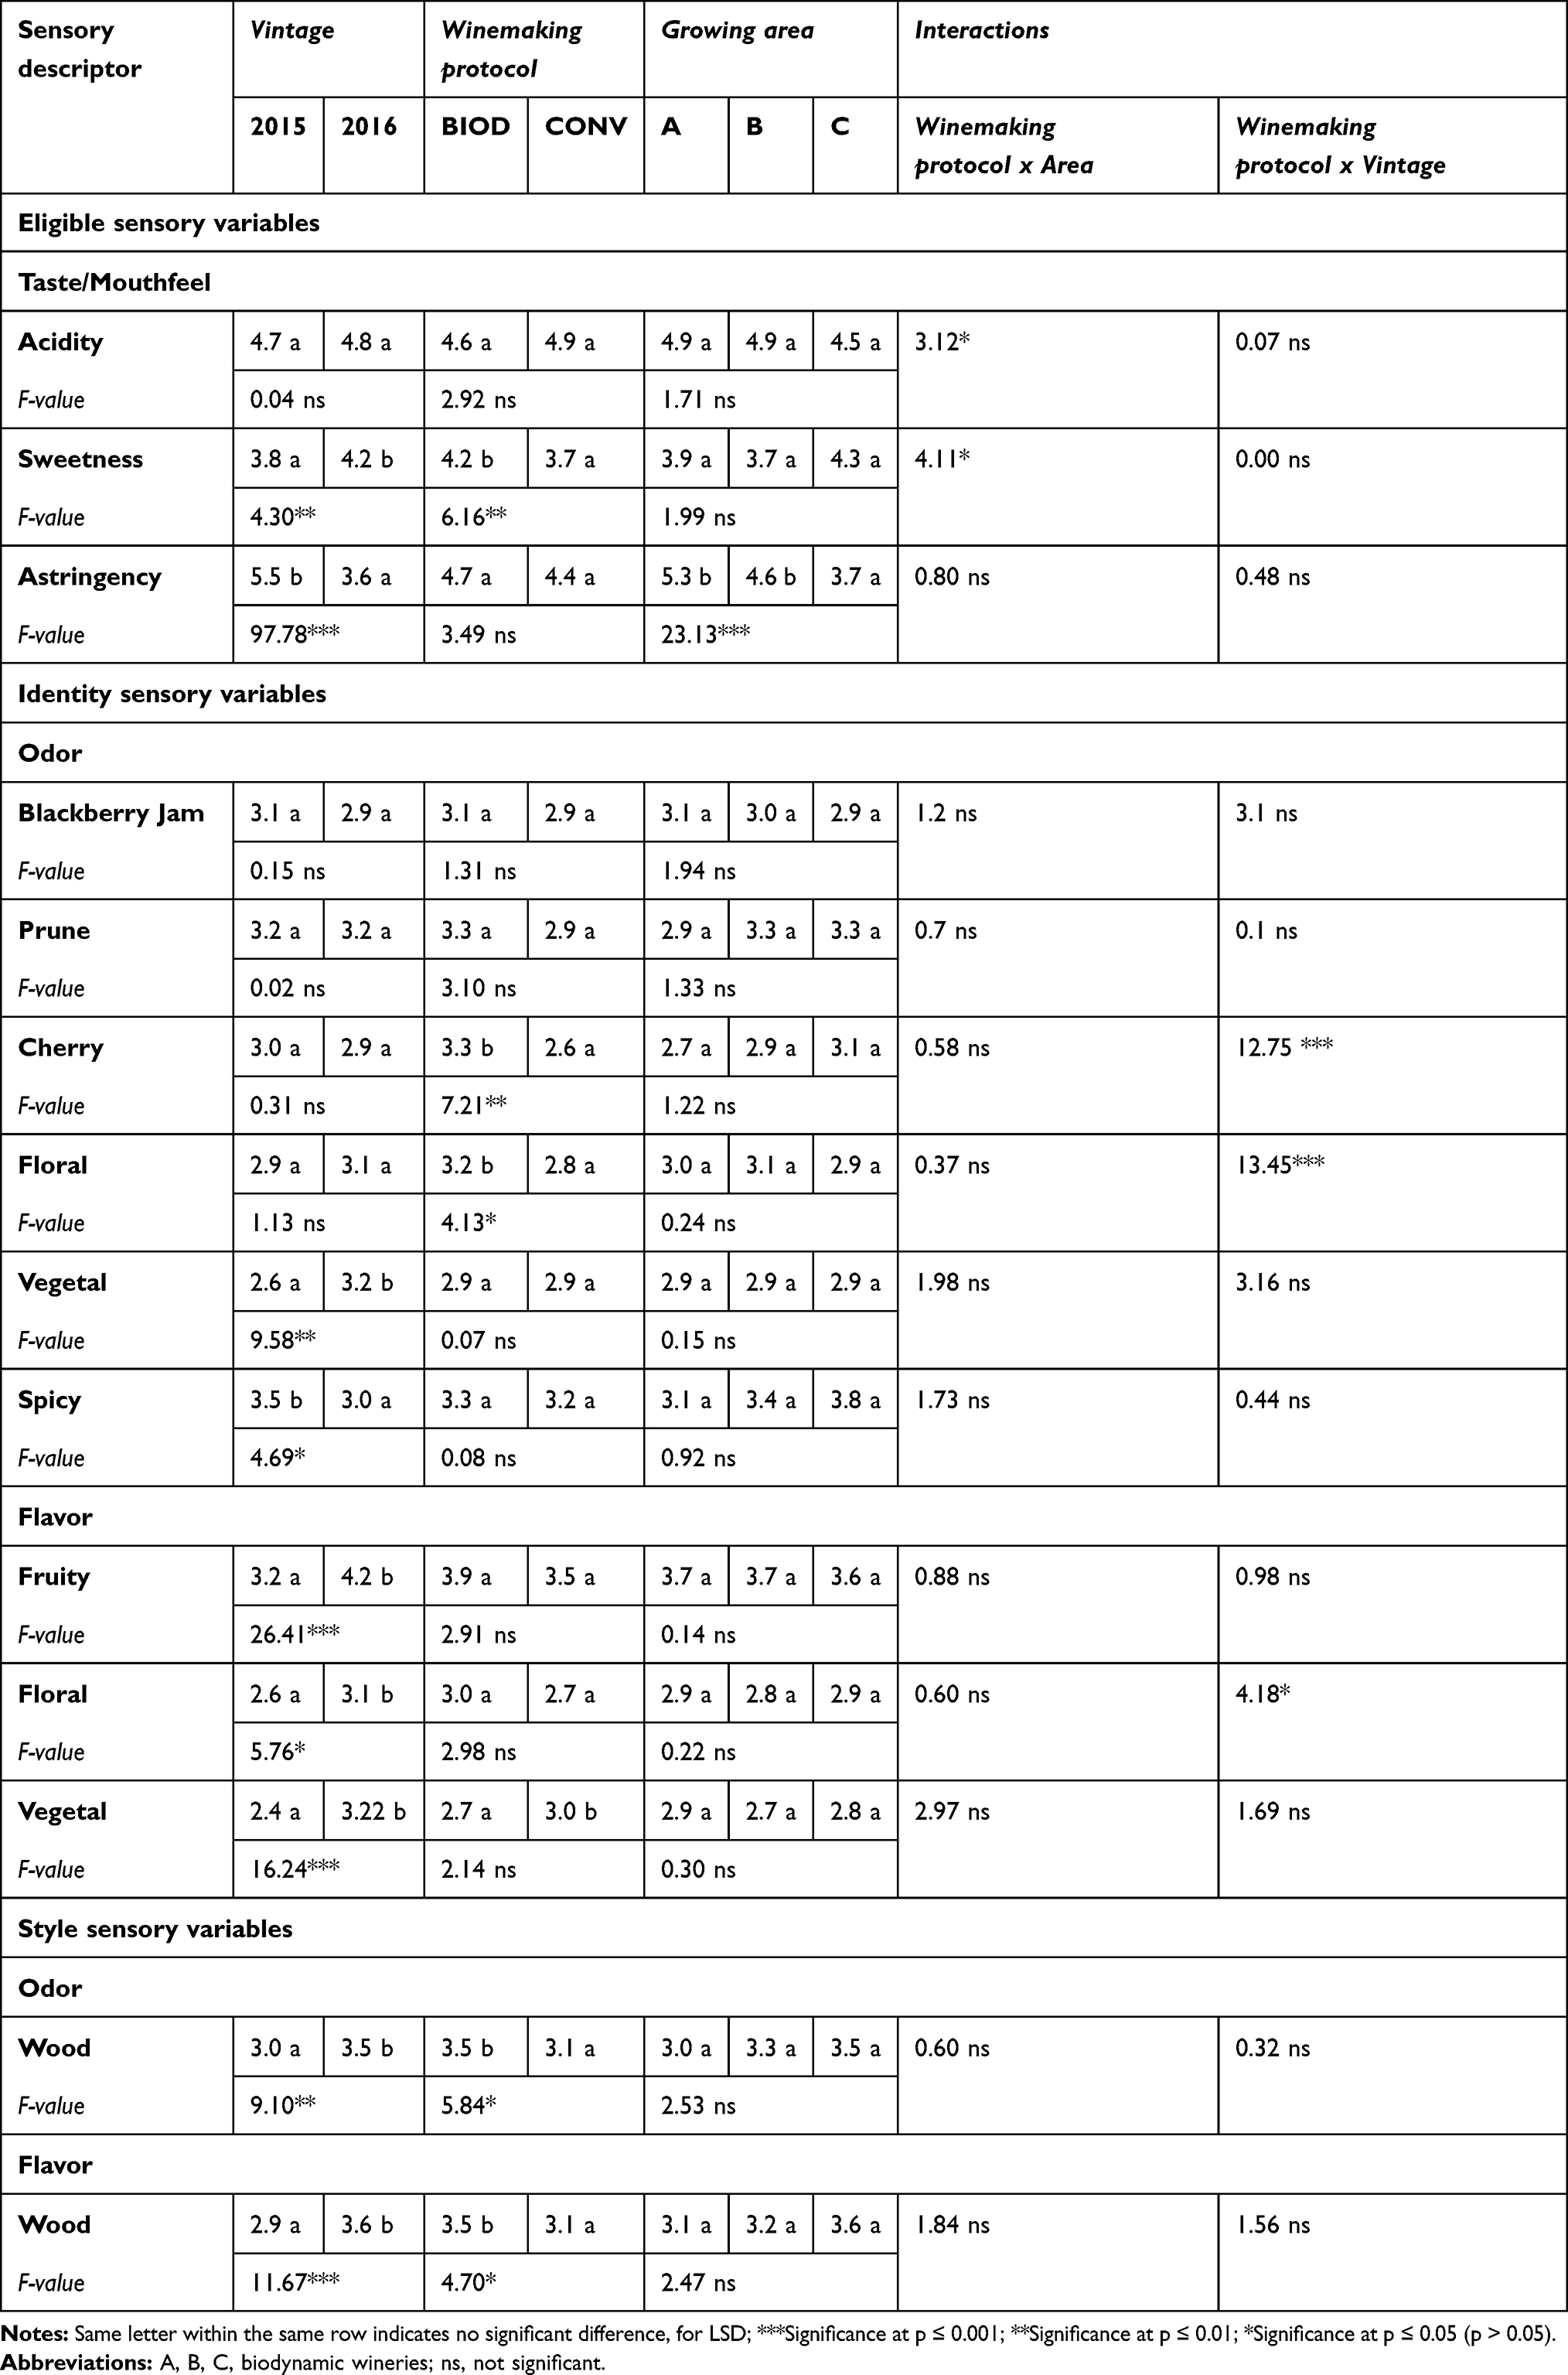 |
Table 4 Eligibility, Identity, and Style Sensory Variables Measured in 2015 and 2016 Conventional (CONV) and Biodynamic (BIOD) Wines: Average, Interactions, F-Values and Least Significant Difference (LSD) |
The eligible sensory characteristics were affected by the Vintage factor. A significantly higher sweetness attribute intensity was measured in the 2016 vintage (p ≤ 0.01). A significantly higher astringency attribute intensity was measured in the 2015 vintage (p ≤ 0.001). The sweetness attribute intensity was also affected by the Winemaking Protocol, resulting significantly higher (p ≤ 0.01) in the biodynamic wines than in the conventional wines, whereas the astringency attribute intensity was affected by the Growing Area factor, resulting significantly higher (p ≤ 0.001) in areas A and B than in area C.
The identity sensory characteristics were affected by the Vintage and Winemaking Protocol factors, but not by the Growing Area factor. A significantly higher intensity of vegetal odor (p ≤ 0.01), fruity (p ≤ 0.001), floral (p ≤ 0.05), and vegetal (p ≤ 0.001) flavors was measured in the 2016 vintage, whereas a higher intensity of the spicy odor (p ≤ 0.05) was measured in the 2015 vintage. The attribute intensity of cherry and floral odors was affected by the Winemaking Protocol, resulting significantly higher (p ≤ 0.01 and p ≤ 0.05, respectively) in the biodynamic wines than in the conventional wines.
The intensity of the style sensory attributes was also affected by the Vintage and Winemaking Protocol factors, but not by the Growing Area factor. The intensity of the wood odor and flavor attributes was significantly higher (p ≤ 0.01 and p ≤ 0.001, respectively) for the 2016 vintage than for the 2015 vintage. It was also significantly higher (p ≤ 0.05) in the biodynamic wines than in the conventional wines.
With regard to interactions between the factors, the experimental data (Table 4) showed that significant (p ≤ 0.001) interaction between the Winemaking Protocol and Vintage occurred for the cherry and floral odor attributes (F = 12.75 and F = 13.45, respectively).
Quality Evaluation as Rating of Overall Wine Quality and Typicality
The overall quality and typicality ratings showed essentially no difference between the wine samples with relation to the vintage, winemaking, and growing area factors (Table 5). Only the overall quality scores were significantly affected by the vintage factor (p ≤ 0.01) with higher values for the 2015 vintage (score 3.66 that is “Fair/Good”) than for the 2016 vintage (score 2.98 that is “Sufficient/Fair”). The overall quality of all of the biodynamic and conventional wine samples was evaluated as “Fair/Good” (ie, scores of 3.49 and 3.15, respectively), whereas the typicality was evaluated as “Good” (ie, scores of 5.48 and 4.49, respectively).
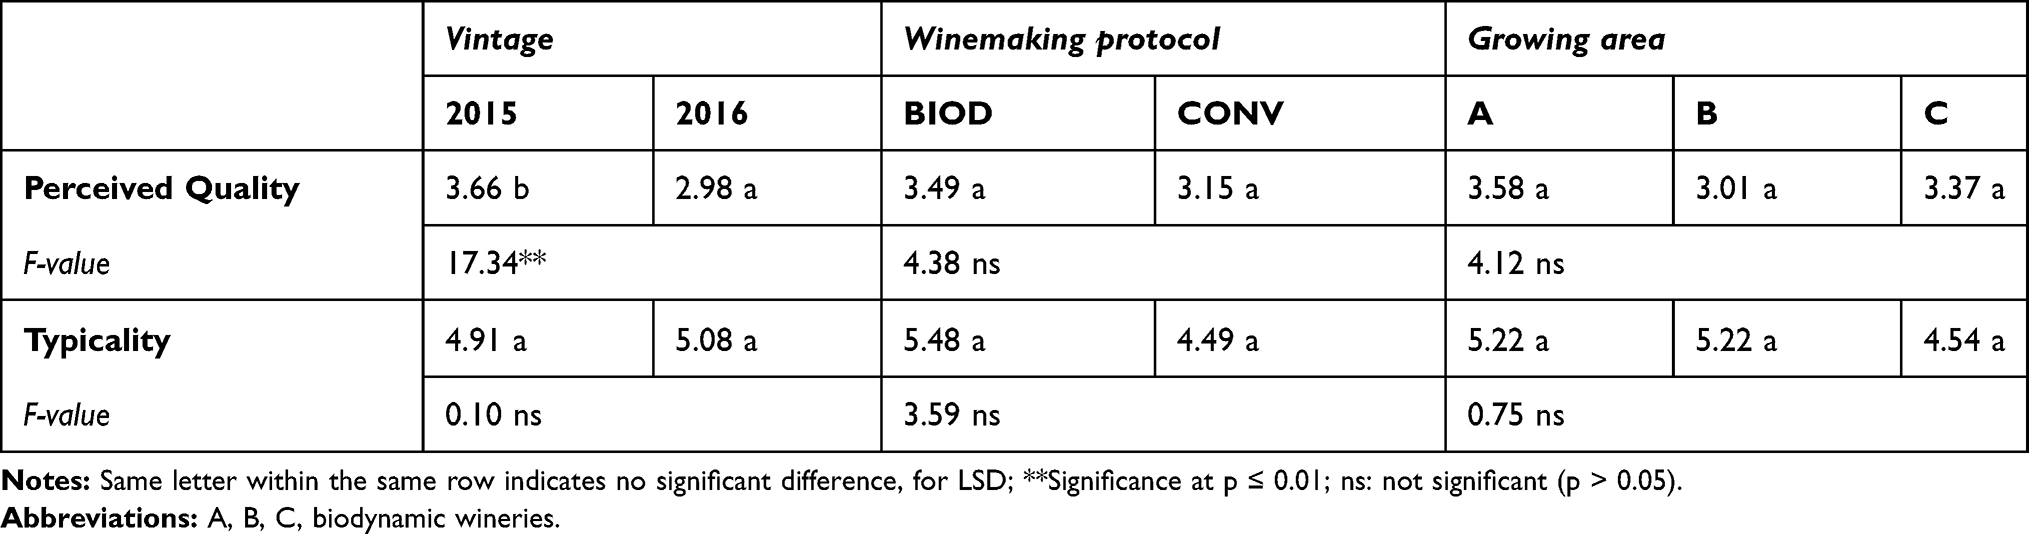 |
Table 5 Average Perceived Quality and Typicality Scores Attributed by Experts in 2015 and 2016 to the Conventional (CONV) and Biodynamic (BIOD) Wines, and Least Significant Difference (LSD) |
Discussion
The experimental data showed that the intrinsic quality of the Sangiovese wine samples was highly affected by the Vintage and Winemaking Protocol factors and slightly affected by the Growing Area factor.
The Vintage factor affected the intrinsic quality of the wine samples. The values of many chemical and sensory characteristics differed between 2015 and 2016 vintages, causing a variation in the eligibility, identity, and style of wine properties. Significant differences occurred for the phenolic and volatile profile (Table 3), intensity of taste, odor, and flavor attributes (Table 4). It is well known that climatic conditions vary according to the growing season and affect key phenological stages, especially grape ripening.9,37-39 The literature data40,41 show a relationship between grape ripening and wine color, taste, and chemical and sensory aroma. Since the 2015 grapes showed significantly lower cellular maturity index values (ie, more extractable anthocyanins) and a significantly higher seed maturity (Table 1) than the 2016 grapes, the 2015 grapes can be considered to have a higher degree of ripeness than the 2016 grapes; therefore, this may have led to a different intrinsic quality of the wine samples within the studied vintages.
The above intrinsic quality levels resulted in a different evaluation of the perceived overall quality by the wine experts, who preferred the 2015 wine samples (Table 5). Instead, the vintage factor did not affect the typicality perceived by the wine experts. According to Bertuccioli et al,19 Canuti et al,20 and Parr et al,21 the identity wine property reflects the territorial implications of the product, namely the “terroir” effect. Although the aroma profile and the intensity of the odor and flavor attributes (ie, the identity wine property) discussed above were significantly different between the vintages, the wine experts perceived no difference in typicality.
The eligibility chemical and sensory characteristics, such as several phenolic variables and the astringency taste attribute, were affected by the growing area (Tables 3 and 4). All of the wine samples produced from grapes from estates A and B (which were in the same geographical area) showed a significantly higher intensity of astringency than estate C, which was in a different region of Italy. These differences could be related to both the higher colored polymeric pigments content and the lower total monomer anthocyanins content in the wine samples from estates A and B compared to estate C. Indeed, flavanols play an important role: proanthocyanidin polymerization, condensation, and oxidation are responsible for astringency, due to the precipitation of salivary proteins that reduce saliva viscosity.42
Essentially, the identity chemical and sensory characteristics were not affected by the growing area and consistently wine experts perceived no significant differences in typicality between the wine samples (Tables 3–5), and so the Sangiovese grape variety expressed its typical aroma profile in all of the different growing areas considered. This finding is in agreement with other authors: the experimental data in Canuti et al43 demonstrated that Italian and Californian Sangiovese wine samples had some common grape-derived volatile compounds, which could be related to the expression of the variety in both the Californian and Italian growing areas. Moreover, other authors19 evidenced that Sangiovese sensory peculiarities are recognizable independently from the different Italian growing areas.
Some significant inherent chemical and sensory differences occurred regarding the characteristics of the biodynamic and conventional wine samples. The above differences were statistically consistent, considering both the single Winemaking Protocol factor and the interaction between the Winemaking Protocol factor and the other two operating factors (Vintage and Growing Area). The values of many chemical and sensory characteristics were involved, causing a significant variation in the eligibility, identity, and style wine properties between the biodynamic and conventional winemaking processes. Significant differences occurred in the phenolic and volatile profile (Table 3), intensity of taste, odor, and flavor attributes (Table 4). It was particularly interesting that the intensity of sweetness, cherry, floral, and wood odor, and flavor sensorial attributes was higher in the biodynamic than in the conventional wines.
It is possible to relate some results to the technical peculiarities of the biodynamic winemaking process (Table 2). The biodynamic and conventional wine samples presented different polyphenol compositions. According to Parpinello et al,9 the biodynamic wine samples resulted in less color intensity, but a higher content of colored polymeric pigments (Table 3). In the biodynamic wine samples, the phenol components seemed to evolve quickly to more stable molecules. The induction of alcoholic fermentation through the inoculation of selected yeasts could also be considered to explain the above different mouthfeel between the biodynamic and conventional wines. According to Patrignani et al,15 Benucci et al44 and Domizio et al,45 non-Saccharomyces cerevisiae strains, which usually persist for more time in spontaneous fermentation, could affect the tactile aspects of wine through the production of mannoproteins, which help to make “soft” wines. Therefore, considering that residual sugar of below 2 g/L was measured for all of the wine samples, the sensation of sweetness could be due to the greater “softness” in addition to a higher alcohol content and a lower titratable acidity content in the biodynamic wine samples46 (Table 3). Lastly, the difference in the tank material could be related to the greater intensity of wood odor and flavor attributes in the biodynamic wine samples.
However, the above differences in intrinsic quality levels did not lead to a different evaluation of both perceived overall quality and perceived typicality by the wine experts (Table 5). This behavior could confirm the literature data16,22-24,47 which indicates that the quality perception is a matter of overall balance and complexity of perceptions, not just a matter of perception intensity.
Conclusion
This study was able to suggest some answers to both the questions about Sangiovese biodynamic wines and the impact of the winemaking operating factors on the intrinsic and perceived quality of wine.
The biodynamic winemaking process affected the intrinsic quality level of the Sangiovese wine samples. The eligibility, identity, and style wine properties were different to the conventional wine samples. The Sangiovese wines obtained using the biodynamic winemaking process showed a different polyphenolic composition, for example, a lower color intensity, due to a lower monomeric anthocyanins content, but at the same time a higher colored polymeric pigments content. This evidence seems to indicate that the wine color stability evolves more quickly. The same wine samples were also perceived as more intense for the sweetness, cherry, and floral odor, and wood odor and flavor sensory attributes.
Regarding the perceived overall quality and typicality, on average the experts attributed higher scores to the biodynamic Sangiovese wine samples, even though they were not statistically significantly different to the conventional ones.
The above result can be considered important, as the biodynamic wineries that participated in this study were able to produce an appreciated biodynamic Sangiovese wine, as was the conventional one, but with the use of fewer resources in the winemaking process.
Since the vintage factor had a significant effect on both the intrinsic and perceived quality of the biodynamic and conventional wine samples, the quality differences recorded due to the vintage seemed to hide the effect of the biodynamic winemaking on the perceived quality. Therefore, further investigations should be carried out to understand the relative relevance of the intrinsic quality of biodynamic Sangiovese grapes and the effect of biodynamic winemaking. In other words, research needs to be performed to discover if the desired effect on the perceived quality of Sangiovese wine from the biodynamic winemaking process depends more on the biodynamic grapes than the biodynamic operating conditions in the winery.
Disclosure
There is no conflict of interest in this article.
References
1. Castellini A, Maraucher C, Procidano I, Sacchi G. Italian market of organic wine: a survey on production system characteristics and marketing strategies. Wine Econ Policy. 2014;3(2):71–80. doi:10.1016/j.wep.2014.12.001
2. Forbes SL, Cohen DA, Cullen R, Wratten SD, Fountain J. Consumer attitudes regarding environmentally sustainable wine: an exploratory study of the New Zealand marketplace. J Cleaner Prod. 2009;17(13):1195–1199. doi:10.1016/j.jclepro.2009.04.008
3. Robin RL. Defining Organic practices for wine and grapes. Wine Bus Monthly. 2006;15.
4. Reganold JP. Organic Agriculture as a form of sustainable agriculture. In: Goodman RM, editor. Encyclopedia of Plant and Crop Science. New York: Marcel Dekker; 2004:846–849.
5. Castellini A, Maraucher C, Troiano S. An overview of the biodynamic wine sector. Int J Wine Res. 2017;9:1–11. doi:10.2147/IJWR.S69126
6. Cravero MC. Organic and biodynamic wines quality and characteristics: a review. Food Chem. 2019;195:334–340. doi:10.1016/j.foodchem.2019.05.149
7. Production and Processing. International Standard for the use and certification of Demeter, Biodynamic and related trademarks [homepage on the internet]. (As of: july 2019/1th circulation). Available from: https://www.demeter.net/certification/standards.
8. Tassoni A, Tango N, Ferri M. Comparison of biogenic amine and poly-phenol profiles of grape berries and wines obtained following conventional, organic and biodynamic agricultural and oenological practices. Food Chem. 2013;139:405–413. doi:10.1016/j.foodchem.2013.01.041
9. Parpinello GP, Rombolà AD, Simoni M, Versari A. Chemical and sensory characterization of Sangiovese red wines: comparison between biodynamic and organic management. Food Chem. 2015;167:1–8. doi:10.1016/j.foodchem.2014.06.093
10. Parpinello GP, Ricci A, Rombolà AD, Nigro G, Versari A. Comparison of Sangiovese wines obtained from stabilized organic and biodynamic vineyard management systems. Food Chem. 2019;283:499–507. doi:10.1016/j.foodchem.2019.01.073
11. Ross CF, Weller KM, Blue RB, Reganold JP. Difference testing of merlot produced from biodynamically and organically grown wine grapes. J Wine Res. 2009;20(2):85–94. doi:10.1080/09571260903169423
12. Mc Cullough M, Qenani E, MacDougall N. Biodynamic practices, eco-label wines and Millennial consumers Michael. J Agr Sci Tech. 2012;2:1364–1372.
13. Delmas MA, Grant LE. Eco-labeling strategies: the eco-premium puzzle in the wine industry. 2008;ISBR Publications,
14. Reilly JK. A blind sampling of 20 wines shows that biodynamics works, but how? Fortune. 2004;150:1–2.
15. Patrignani F, Montanari C, Serrazanetti DI, et al. Characterisation of yeast microbiota, chemical and sensory properties of organic and biodynamic Sangiovese red wines. Ann Microb. 2017;67:99–109. doi:10.1007/s13213-016-1241-3
16. Charters S, Pettigrew S. The dimensions of wine quality. Food Qual Pref. 2007;18(7):997–1007. doi:10.1016/j.foodqual.2007.04.003
17. Jover AJV, Montes FJL, Fuentes MDF. Measuring perceptions of quality in food products: the case of red wine. Food Qual Pref. 2004;15(5):453–469. doi:10.1016/j.foodqual.2003.08.002
18. Salette J. La tipicité: une notion nouvelle au service du produit, de ceux qui l’élaborent, et de ceux qui le consomment en l’appréciant (Typicity:a new concept at the service of the product, of those who develop it, and of those who consume it while enjoying it). Rev Enol. 1997;85:11–13.
19. Bertuccioli M, Rosi I, Canuti V, Giovani G, Picchi M. La tipicità dei vini: il Sangiovese (Typicity of wine: the Sangiovese). Industria delle Bevande. 2011;40:7–14.
20. Canuti V, Picchi M, Zanoni B, Fia G, Bertuccioli M. A multivariate methodological approach to relate wine to characteristics of grape composition: the case of typicality. Am J Enol Vitic. 2017;68:49–59. doi:10.5344/ajev.2016.15111
21. Parr WV, Green JA, White KG, Sherlock RR. The distinctive flavour of New Zealand Sauvignon blanc: sensory characterisation by wine professionals. Food Qual Pref. 2007;18:849–861. doi:10.1016/j.foodqual.2007.02.001
22. Jackson RS. Wine Tasting: A Professional Handbook.
23. Hopfer H, Nelson J, Ebeler SE, Heymann H. Correlating wine quality indicators to chemical and sensory measurements. Molecules. 2015;20:8453–8483. doi:10.3390/molecules20058453
24. Parr WV, Mouret M, Blackmore S, Pelquest-Hunt T, Urdapilleta I. Representation of complexity in wine: influence of expertise. Food Qual Pref. 2011;22:647–660. doi:10.1016/j.foodqual.2011.04.005
25. Saint-cricq de Gaulejac N, Vivas N, Glories Y. Maturité phénolique: définition et control (Phenolic ripening: definition and control). Rev Franç Enol. 1998;173:22–25.
26. Zanoni B, Siliani S, Canuti V, Rosi I, Bertuccioli M. A kinetic study on extraction and transformation phenomena of phenolic compounds during red wine fermentation. Int J Food Sci Technol. 2010;45(10):2080–2088. doi:10.1111/j.1365-2621.2010.02374.x
27. Peng Z, Iland PG, Oberholster A, Sefton MA, Waters EJ. Analysis of pigmented polymers in red wine by reverse phase HPLC. Aust J Grape Wine Res. 2020;8:70–75. doi:10.1111/j.1755-0238.2002.tb00213.x
28. Glories Y. La couleur des vins rouges II (The color of re wines II). Connaissance de la vigne et du vin. Vigne vin. 1984;18:253–271.
29. Ribereau-Gayon P. Le dosage des composés phénoliques totaux dans les vins rouges (The dosage of polyphenolic compounds in red wines). Chim Anal. 1970;52:627–631.
30. Mirabel M Caracteristiques chimiques et organoleptiques des tanins des raisins de Vitis vinifera var. Merlot et Cabernet Sauvignon issus de differents terroirs Bordelais [PhD dissertation]. Accra: Université Victor Segalen Bordeaux; 2000.
31. Bertuccioli M. Direct gas chromatographic determination of some volatile compounds in wine. Vini Ital. 1982;138:149–156.
32. Canuti V, Conversano M, Li Calzi M, Heymann H, Matthews MA, Ebeler SE. Headspace solid-phase microextraction-gas chromatography-mass spectrometry for profiling free volatile compounds in Cabernet Sauvignon grapes and wines. J Chromatogr. 2009;1216:3012–3022. doi:10.1016/j.chroma.2009.01.104
33. MacFie HJ, Bratchell N, Greenhoff K, Vallis LV. Designs to balance the effect of order of presentation and first-order carry-over effects in hall tests. J Sens Stud. 1989;4:129–148. doi:10.1111/j.1745-459X.1989.tb00463.x
34. Parr W, Heatherbell D, White KG. Demystifying wine expertise: olfactory threshold, perceptual skill and semantic memory in experts and novice wine judges. Chem Senses. 2020;8:747–755.
35. Charters S, Pettigrew S. The intrinsic dimensions of wine quality: an exploratory investigation.
36. Ballester J, Dacremont C, Le Fur Y, Etievant P. The role of olfaction in the elaboration and use of the Chardonnay wine concept. Food Qual Pref. 2005;16:351–359. doi:10.1016/j.foodqual.2004.06.001
37. Jackson DI, Lombard PB. Environmental and management practices affecting grape compositional wine quality – a review as regard the aromatic profile. Am J Enol Vitic. 1993;44:409–430.
38. Laghi L, Versari A, Marcolini E, Parpinello GP. Metabonomic investigation by 1H-NMR to discriminate between red wines from organic and biodynamic grapes. Food Nutr Sci. 2014;5:52–59. doi:10.4236/fns.2014.51007
39. Pereira GE, Gaudillére JP, Van Leeuwen C, et al. 1HNMR metabolic profiling of wines from three cultivars, three soils types and two contrasting vintages. J Int Sci Vigne Vin. 2007;41:103–109.
40. Cadot Y, Caillé S, Samson A, Barbeau G, Cheynier V. Sensory representation of typicality of Cabernet franc wines related to phenolic composition: impact of ripening stage and maceration time. Anal Chim Acta. 2012;732:91–99. doi:10.1016/j.aca.2012.02.013
41. Pineau B, Trought MCT, Strong K, Bereford MK, Wohler MW, Jaeger SR. Influence of fruit ripeness and juice chaptalisation on the sensory properties and degree of typicality expressed by Sauvignon Blanc wines from Marlborough, New Zealand. Aust J Grape Wine Res. 2011;17:358–367. doi:10.1111/j.1755-0238.2011.00160.x
42. Gawel R. Red wine astringency: a review. Aust J Grape Wine Res. 1998;4(2):74–95. doi:10.1111/j.1755-0238.1998.tb00137.x
43. Canuti V, Frost S, Lerno LA, et al. Chemical Characteristics of Sangiovese Wines from California and Italy of 2016 Vintage. J Agr Food Chem. 2019;67(9):2647–2659. doi:10.1021/acs.jafc.8b05674
44. Benucci I, Cerreti M, Liburdi K, et al. Pre-fermentative cold maceration in presence of non-Saccharomyces strains: evolution of chromatic characteristics of Sangiovese red wine elaborated by sequential inoculation. Food Res Int. 2018;107:257–266. doi:10.1016/j.foodres.2018.02.029
45. Domizio P, Liu Y, Bisson LF, Barile D. Use of non-Saccharomyces wine yeasts as novel sources of mannoproteins in wine. Food Microbiol. 2014;43:5–15. doi:10.1016/j.fm.2014.04.005
46. Sáenz-Navajas MP, Avizcuri JM, Ferreira V, Fernández-Zurbano P. Insights on the chemical basis of the astringency of Spanish red wines. Food Chem. 2012;134(3):1484–1493. doi:10.1016/j.foodchem.2012.03.060
47. Hopfer H, Heymann H. Judging wine quality: do we need experts, consumers or trained panelists? Food Qual Pref. 2014;32:221–233. doi:10.1016/j.foodqual.2013.10.004
 © 2020 The Author(s). This work is published and licensed by Dove Medical Press Limited. The
full terms of this license are available at https://www.dovepress.com/terms
and incorporate the Creative Commons Attribution
- Non Commercial (unported, 3.0) License.
By accessing the work you hereby accept the Terms. Non-commercial uses of the work are permitted
without any further permission from Dove Medical Press Limited, provided the work is properly
attributed. For permission for commercial use of this work, please see paragraphs 4.2 and 5 of our Terms.
© 2020 The Author(s). This work is published and licensed by Dove Medical Press Limited. The
full terms of this license are available at https://www.dovepress.com/terms
and incorporate the Creative Commons Attribution
- Non Commercial (unported, 3.0) License.
By accessing the work you hereby accept the Terms. Non-commercial uses of the work are permitted
without any further permission from Dove Medical Press Limited, provided the work is properly
attributed. For permission for commercial use of this work, please see paragraphs 4.2 and 5 of our Terms.