Back to Journals » Clinical Interventions in Aging » Volume 16
The Impact of Cognition and Gender on Speeding Behaviour in Older Drivers with and without Suspected Mild Cognitive Impairment
Authors Feng YR, Meuleners L, Stevenson M, Heyworth J ![]() , Murray K, Fraser M, Maher S
, Murray K, Fraser M, Maher S ![]()
Received 7 May 2021
Accepted for publication 30 June 2021
Published 6 August 2021 Volume 2021:16 Pages 1473—1483
DOI https://doi.org/10.2147/CIA.S319129
Checked for plagiarism Yes
Review by Single anonymous peer review
Peer reviewer comments 2
Editor who approved publication: Prof. Dr. Nandu Goswami
Ying Ru Feng,1 Lynn Meuleners,1 Mark Stevenson,2,3 Jane Heyworth,4 Kevin Murray,4 Michelle Fraser,1 Sean Maher5
1Western Australian Centre for Road Safety Research, School of Population and Global Health, The University of Western Australia, Perth, WA, Australia; 2Transport, Health and Urban Design Research Lab, Melbourne School of Design, University of Melbourne, Melbourne, VIC, Australia; 3Melbourne School of Population and Global Health, University of Melbourne, Melbourne, VIC, Australia; 4School of Population and Global Health, The University of Western Australia, Crawley, WA, 6009, Australia; 5Department of Rehabilitation and Aged Care, Sir Charles Gairdner Hospital, Perth, WA, Australia
Correspondence: Lynn Meuleners
Western Australian Centre for Road Safety Research, School of Population and Global Health, The University of Western Australia (M431), 35 Stirling Highway, Crawley, WA, 6009, Australia
Tel +61 8 6488 7375
Email [email protected]
Purpose: Mild cognitive impairment and gender can impact different aspects of driving performance and behaviour in older drivers. However, there is little evidence on how these may affect naturalistic speeding behaviour. Therefore, the aim of this study was to examine the relationship between speeding events and cognitive status for older male and female drivers.
Participants and Methods: A naturalistic driving study collected objective driving information over a two-week period using an in-vehicle monitoring device from 36 older drivers with suspected mild cognitive impairment and 35 older drivers without cognitive impairment. The outcome of interest examined was the number of speeding events, defined as travelling 5+ km/h over the posted speed limit for at least a minute.
Results: The majority of participants (n=58, 81.69%) did not have a speeding event during the two-week monitoring period. Twenty-three speeding events were recorded among seven drivers with suspected mild cognitive impairment and six drivers without cognitive impairment. The majority of speeding events (82.61%) were by older male drivers and occurred in 60km/h and 70km/h speed zones. The results of the two negative binomial regression models found that in older male drivers, suspected mild cognitive impairment (IRR=7.45, 95% CI=1.53– 36.15, p=0.01) was associated with a significantly higher rate of speeding events, while increasing age was associated with a lower rate of speeding events (IRR=0.80, 95% CI=0.64– 1.00, p=0.04). For older female drivers, there were no factors significantly associated with the rate of speeding events.
Conclusion: While the overall number of speeding events were infrequent, suspected mild cognitive impairment was associated with a significant increase in the rate of speeding events for older male drivers, but not for older female drivers. Speeding interventions and injury prevention policy strategies may need to be targeted differently for male and female drivers with mild cognitive impairment.
Keywords: naturalistic, driver monitoring, cognitive decline, gender differences, driving behaviour
Introduction
Motor vehicle crashes are a leading cause of injury for drivers aged 65+ with over 300 road fatalities and 5000 hospitalizations reported per annum in Australia.1 When older drivers are involved in a crash they are more likely to be killed or seriously injured due to a variety of reasons which include increased fragility,2 polypharmacy,3 presence of chronic medical conditions,4 poorer physical mobility and motor ability,5,6 and increased difficulty in complex driving situations.7 Although older drivers are less likely to engage in risky behaviours such as speeding compared to other age groups,5,8 there is minimal information about the association between cognition and speeding for older drivers.
Mild cognitive impairment (MCI) is an intermediate stage of cognitive decline between normal aging and dementia.9 Although MCI may have minimal impact on an individual’s independence and activities of daily living, there may be issues when carrying out more complex and cognitively demanding tasks such as driving.9 Since the prevalence of MCI increases with age10 and the number of older drivers continues to rise,11 drivers with MCI are also expected to increase.12
Previous research has found that drivers with cognitive conditions, such as Alzheimer’s disease, Parkinson’s disease and MCI, undertake self-regulation practices and may be aware of how their impairment affects their driving.13–15 However, it is unknown whether older drivers with MCI also compensate for their cognitive impairment and reduce their travel speed. A recent naturalistic driving study examined speeding behaviour among older drivers and found that cognitive function did not predict speeding-related events.16 However, this study did not use a global cognitive function test to assess cognitive status; rather they used the Australian DriveSafe/DriveAware instrument and Trail Making Test Parts A and B.16 A subsequent study found that older drivers with reduced cognitive function were involved in less high-range speeding events.17 A recent simulator study by Fragkiadaki et al also examined objective driving performance in older participants with MCI and found that they drove at a lower speed, maintained a longer headway and had significantly slower reaction time than a comparison group without cognitive impairment.13
There is also a body of research regarding the differences in driving behaviours and patterns between older male and female drivers. Females are more likely to be less confident drivers, limit their driving exposure and engage in self-regulation practices.18–20 They are also usually not the principal driver of the household and are more likely to cease driving earlier than male drivers.20,21 It is also established that female drivers are less likely to speed than their male counterparts.22,23 Gender differences are also documented in participants with MCI with previous studies indicating that while MCI is more prevalent in males,10,24 females are more likely to progress at a faster rate of cognitive decline.25 However, it is unknown if gender differences in the progression of MCI may influence driving, including their speeding behaviours. Given these challenges, it is important to extend our knowledge about driver behaviours for those with MCI. Therefore, the aim of this study was to examine the relationship between speeding events and cognitive status for older male and female drivers.
Participants and Methods
Study Design
This cross-sectional naturalistic driving study examining speeding events in older drivers is part of a larger prospective cohort study examining the association between cognitive ability and driving.26–28 Speeding events, which were measured using an in-vehicle monitoring device over a two-week period, were examined in 35 older drivers with suspected MCI, defined by the Montreal Cognitive Assessment (MoCA), and 36 older drivers with no cognitive impairment.
Sample
Participants were recruited from the initial 1001 drivers who completed the first phase of the study (telephone interview).26 Those who met eligibility requirements, expressed an interest and agreed to participate in the naturalistic driving phase of the study, were recruited between October 2019 and March 2020.
Eligibility criteria stipulated that participants were aged ≥65 years, held a current driver’s license, drove a minimum of twice a week, lived in the Perth metropolitan area of Western Australia, and agreed to have an in-vehicle monitoring device installed in their vehicle for two weeks. Exclusion criteria included medical conditions that could interfere with safe driving (eg Parkinson’s disease, receptive or expressive aphasia and severe hearing loss).
Data Collection
Participants were provided an information sheet and informed they could withdraw from the study at any time. Prior to any data collection, voluntary informed consent was collected. Participants were also allowed to have a significant other or family member with them during the interviews.
Each participant was interviewed to collect information on socio-demographic characteristics, cognition, activities of daily living, depression and vision. They also had an in-vehicle monitoring device installed in their own vehicle and were asked to complete a travel diary during the driving monitoring period. Ethics approval was obtained from The University of Western Australia Human Research Ethics Committee #RA/4/20/5126 and followed the Declaration of Helsinki.
Instruments
Socio-Demographic Questionnaire
Information about participants’ socio-demographic characteristics, self-reported health, medical conditions, and prescription medication that could affect driving ability (eg opioids, antidepressants and sleep medications) were collected through a structured telephone interview. Several driving-related questions were included to elicit information about participants’ driving behaviour, including the number of previous crashes and traffic infringements in the past year, and license restrictions.
Montreal Cognitive Assessment (MoCA)
Cognitive status was the exposure of interest for the study. This was measured using the Montreal Cognitive Assessment (MoCA) to screen for suspected MCI.29 The MoCA takes about ten minutes to complete and is able to assess short-term memory recall, visuospatial abilities, executive functioning, attention, concentration, working memory, language and orientation.29 It includes subtests commonly used in neuro-psychological batteries including the Trail Making test B, copy of the cube, the clock drawing test, digit span forward and backward.29 MoCA scores can range from zero to 30. A score of 26 or higher suggests normal cognitive functioning, whilst a score between 18 and 25 suggests suspected MCI.29 The overall MoCA score was used rather than the isolated individual scores on each subtest as it allows for greater accuracy.30,31
In addition to the MoCA, functional status and depressive symptoms were also measured in participants, as Staplin et al has previously suggested the importance of considering these measures whilst defining MCI.32
Older Americans Resources and Services-Activities of Daily Living (OARS-ADL)
The functional status of participants was measured using the Activities of Daily Living (ADL) questionnaire from the Older Americans Resources and Services Assessment (OARS).33 Furthermore, the OARS-ADL was used to help identify those with high MoCA scores who may have dementia, which would be reflected if they had impaired activities of daily living function.34 The questionnaire contains 15 questions on both instrumental and physical ADLs to assess a person’s capability to perform daily routine activities. OARS-ADL scores can range from zero to 28, with a higher score suggesting better ability in performing activities of daily living.
Geriatric Depression Scale (GDS)
The Geriatric Depression Scale (GDS) was used to screen for depression among participants, as depression can be a confounder for driving performance in older drivers.35,36 It consists of 15 questions, which require a yes/no response based on how participants had felt over the past week. Scores on the GDS can range from 0 to 15, with a score between zero to five indicating no depressive symptomatology and a score of 6 or greater indicating symptoms of depression.
Objective Visual Measures
Visual tests measuring visual acuity, contrast sensitivity and stereopsis were conducted under standardized protocols with constant conditions and luminance. Participants were instructed to wear their habitual corrective lenses/glasses for all visual tests. Visual acuity refers to the clarity of vision and was measured using the Early Treatment Diabetic Retinopathy Study (ETDRS) chart. A letter by letter scoring technique was used and converted to the logarithm of the minimum angle resolution (logMAR).37 Scores of visual acuity range from −0.3 to 1 with a lower logMAR score indicating better visual acuity.
Contrast sensitivity refers to the ability to differentiate finer increments of contrast (light versus dark). The Mars Letter Contrast Sensitivity Test (Mars Perceptrix©) was used to measure binocular contrast sensitivity. Scores range from 0.00 to 1.92 with a higher score indicating better contrast sensitivity.
Stereopsis refers to depth perception. The Traditional Fly image and Graded Circle Test (Vision Assessment Corporation©) was used to measure stereopsis. Scores can range from 4800 to 20 seconds of arc with a lower score indicating better stereopsis. Log seconds of arc were used in the analysis.
In-Vehicle Monitoring Device
An in-vehicle monitoring device with a GPS log receiver (© Geotab Inc.) was installed in each participant’s car to monitor their driving for two weeks (Figure 1). It recorded real-time naturalistic driving, exposure and driving behaviour including speeding events.
 |
Figure 1 Image of the Geotab® GO7® telematics device. |
The recording device was installed in either the cigarette lighter (for vehicles manufactured pre-2006) or through the On-Board Diagnostic II (OBD II) port (for vehicles manufactured in 2006 or after). Data recorded by the in-vehicle monitoring device were stored and downloaded by the fleet management software (MyGeotab, Oakville, Canada) provided by Geotab ©. (© Geotab Inc.)
Participants were also required to fill out a travel diary over the two-week period. For every trip they undertook as the driver, they recorded the start and end time, the purpose, and whether there was another passenger in the vehicle.
Outcome of Interest – Speeding Events
A speeding event was defined as driving at a minimum of 5 km/h or greater over the speed limit for at least a minute.38 Data on speed limits were obtained from the service provider (© Geotab Inc.) and based on a combination of NAVTEQ and OpenStreetMap data.
Data Processing and Cleaning
Each participant’s driving files were downloaded from Geotab © and were checked against each trip recorded by the driver from the travel diary (Figure 2). Only trips that were recorded in the travel diary and matched a trip recorded by the in-vehicle monitoring device were considered valid and included in the analysis. Speeding events were checked and verified for all trips by comparing the speed limit of the road (obtained from OpenStreetMap (OSM)) against the speed the driver was travelling for each flagged episode of speeding. Data were cleaned and checked in Microsoft Excel, before being imported to SAS for statistical analysis.
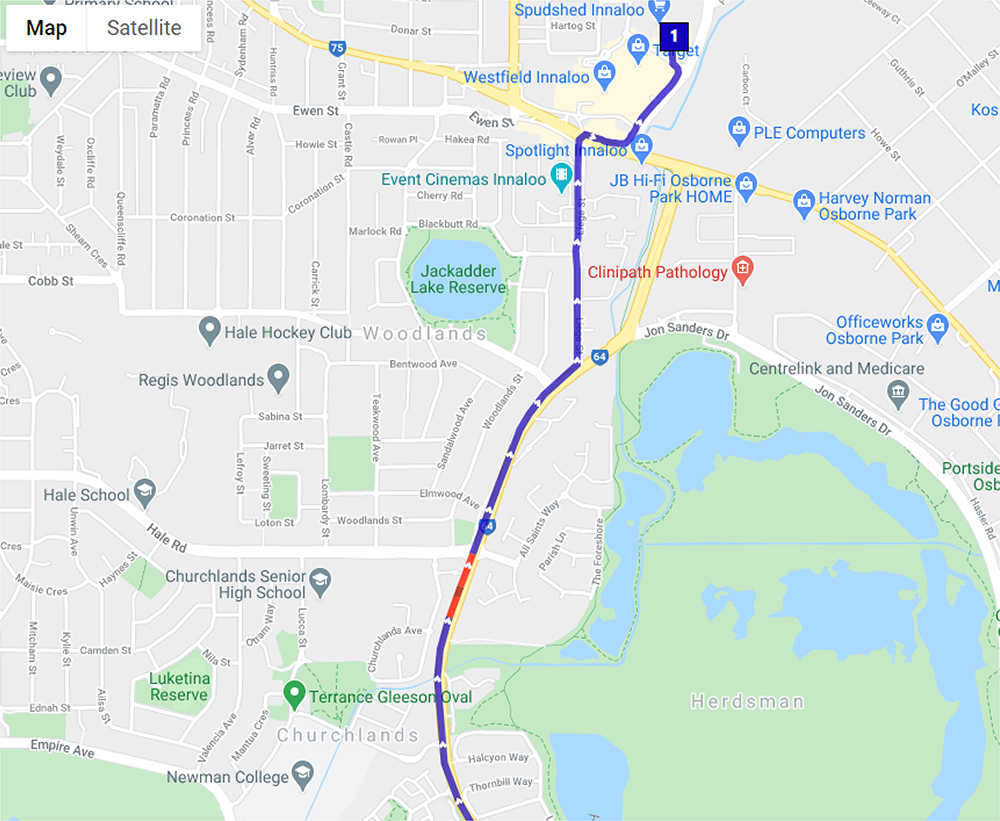 |
Figure 2 Example of a participant trip containing a speeding event (red), and non-speeding (blue). |
Statistical Analysis
Descriptive and inferential analyses (Student’s t-test, Chi-squared test and Fisher’s exact test) examined differences in socio-demographic characteristics, visual measures, driving exposure and incidents of speeding events between drivers with suspected MCI and those without cognitive impairment.
As the outcome of interest was the count of speeding events, two separate negative binomial regression models, one for male drivers and one for female drivers, were undertaken to assess the association between the number of speeding events and cognition. A backwards stepwise selection was undertaken and only significant variables were included in the final models. However, visual acuity and contrast sensitivity were included due to the impact of vision on driving.39
Negative binomial models were undertaken due to the count nature of the outcome variable and the over-dispersion in the number of speeding events amongst participants (mean=0.30, variance=0.53). The distance driven during the two-week monitoring period (driving exposure) was included as an exposure/offset in the model. The significance level was set as p<0.05.
Results
One hundred and fifty participants were contacted with 90 participants agreeing to undertake the naturalistic driving portion of the study, representing a response of 60%. The final sample consisted of 71 participants as usable driving data were only obtained from 72 participants and one participant had a MoCA score of 16 which was suggestive of dementia.
In total, thirty-six participants had a MoCA score between 26 and 30 (mean=27.50, SD=0.97, range=26–29), which suggested no cognitive impairment. The remaining thirty-five participants were classified as having suspected MCI, with MoCA scores between 18 and 25 (mean=23.26, SD=1.44, range=20–25).
Socio-Demographic Characteristics
Socio-demographic characteristics are summarised in Table 1. The study sample consisted of 31 female drivers (suspected MCI: n=14, no cognitive impairment: n=17) and 40 male drivers (suspected MCI: n=21, no cognitive impairment: n=19). The mean age of participants with suspected MCI was 75.26 years (SD=4.86) and the mean age of participants without cognitive impairment was 73.06 years (SD=4.17). There were no significant differences in gender (p=0.54), age (p=0.11), marital status (p=0.73), employment (p=0.08) living arrangements (p=0.48), number of co-morbidities (p=0.85), prescription medication affecting driving (p=1.00), license restrictions (p=0.44) and crashes in the previous year (p=1.00) between drivers with and without suspected MCI. There were no significant differences in GDS scores (p=0.57) and OARS-ADL scores (p=0.61) between drivers with and without suspected MCI, with scores indicating that both groups reported no evidence of depressive symptoms and had high functional status.
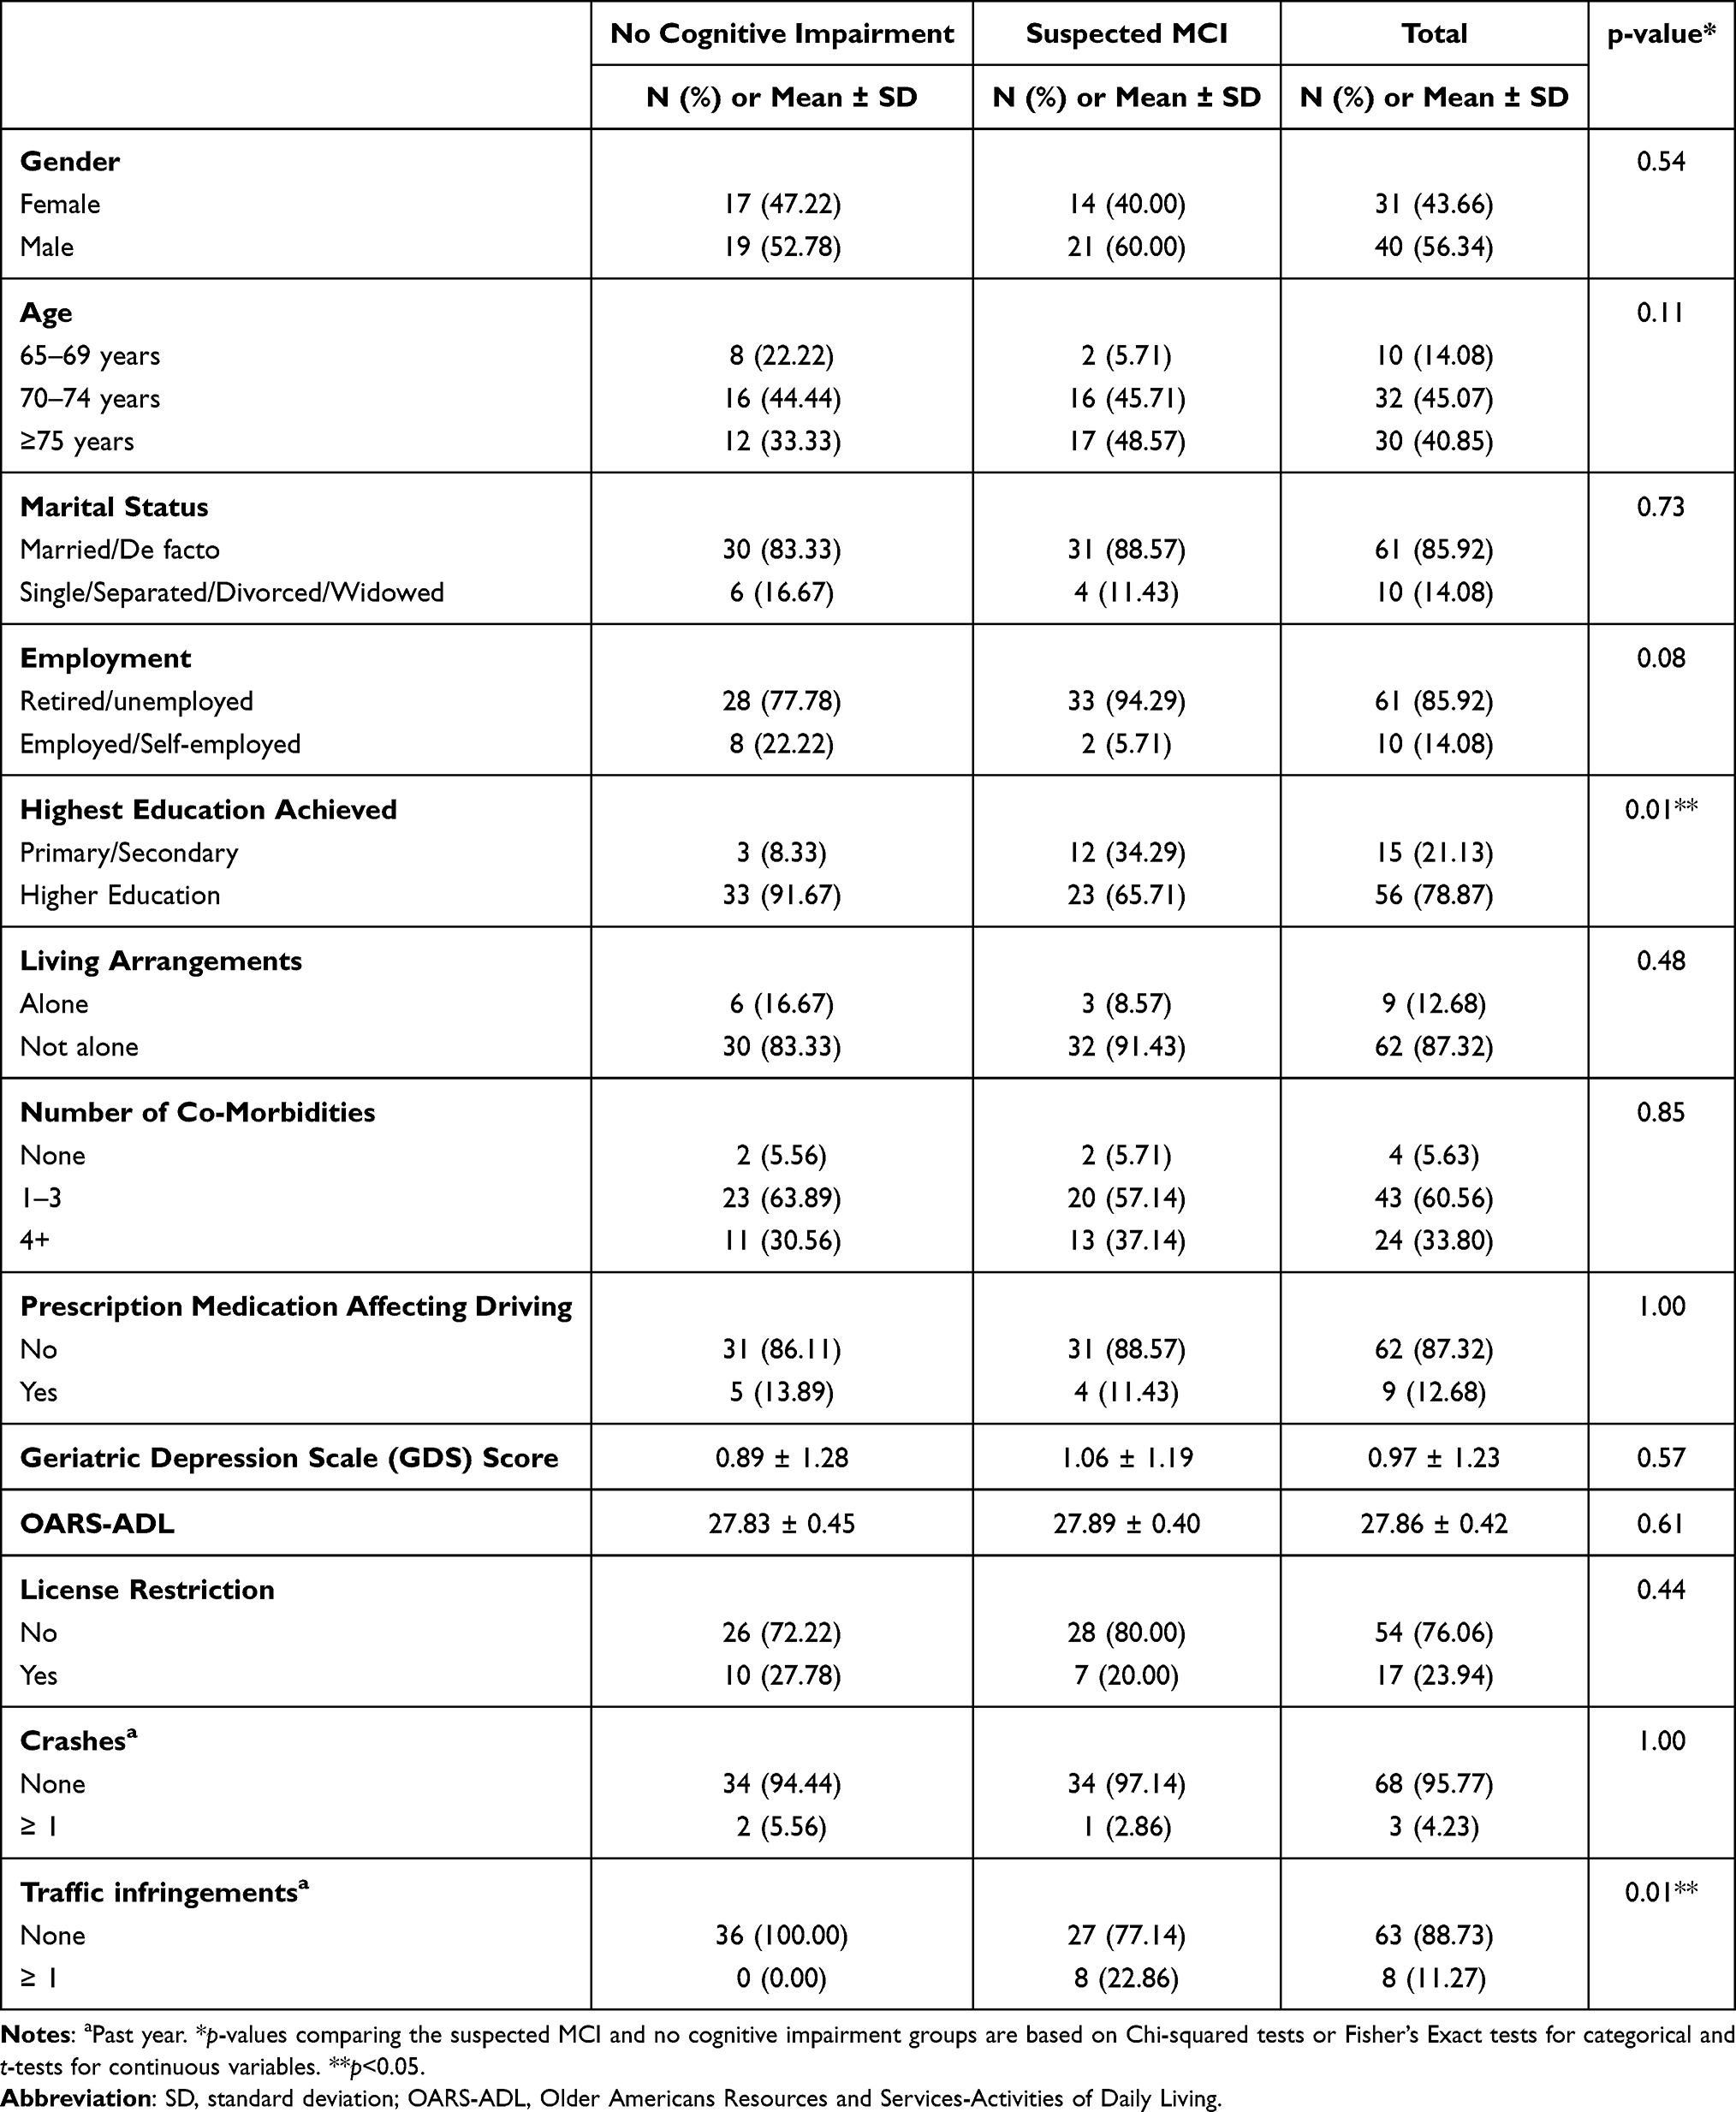 |
Table 1 Socio-Demographic Characteristics of Older Drivers with and without Suspected MCI |
There was a significantly larger proportion of drivers with suspected MCI who did not achieve a higher education (p=0.01) and received at least one traffic infringement in the previous year (p=0.01) compared to drivers without cognitive impairment.
Vision
The visual characteristics of participants are summarised in Table 2. Binocular visual acuity was 0.14 LogMAR for both drivers with suspected MCI (SD=0.14) and without cognitive impairment (SD=0.17) and was not significantly different (p=0.94). However, drivers with suspected MCI had significantly poorer contrast sensitivity (mean=1.58 log units, SD=0.14) compared to drivers without cognitive impairment (mean=1.64 log units, SD=0.13); (p=0.04). Drivers with suspected MCI also had significantly better stereopsis (mean=4.70 log seconds of arc, SD=0.60) compared to drivers without cognitive impairment (mean=4.21 log seconds of arc, SD=0.77); (p=0.01).
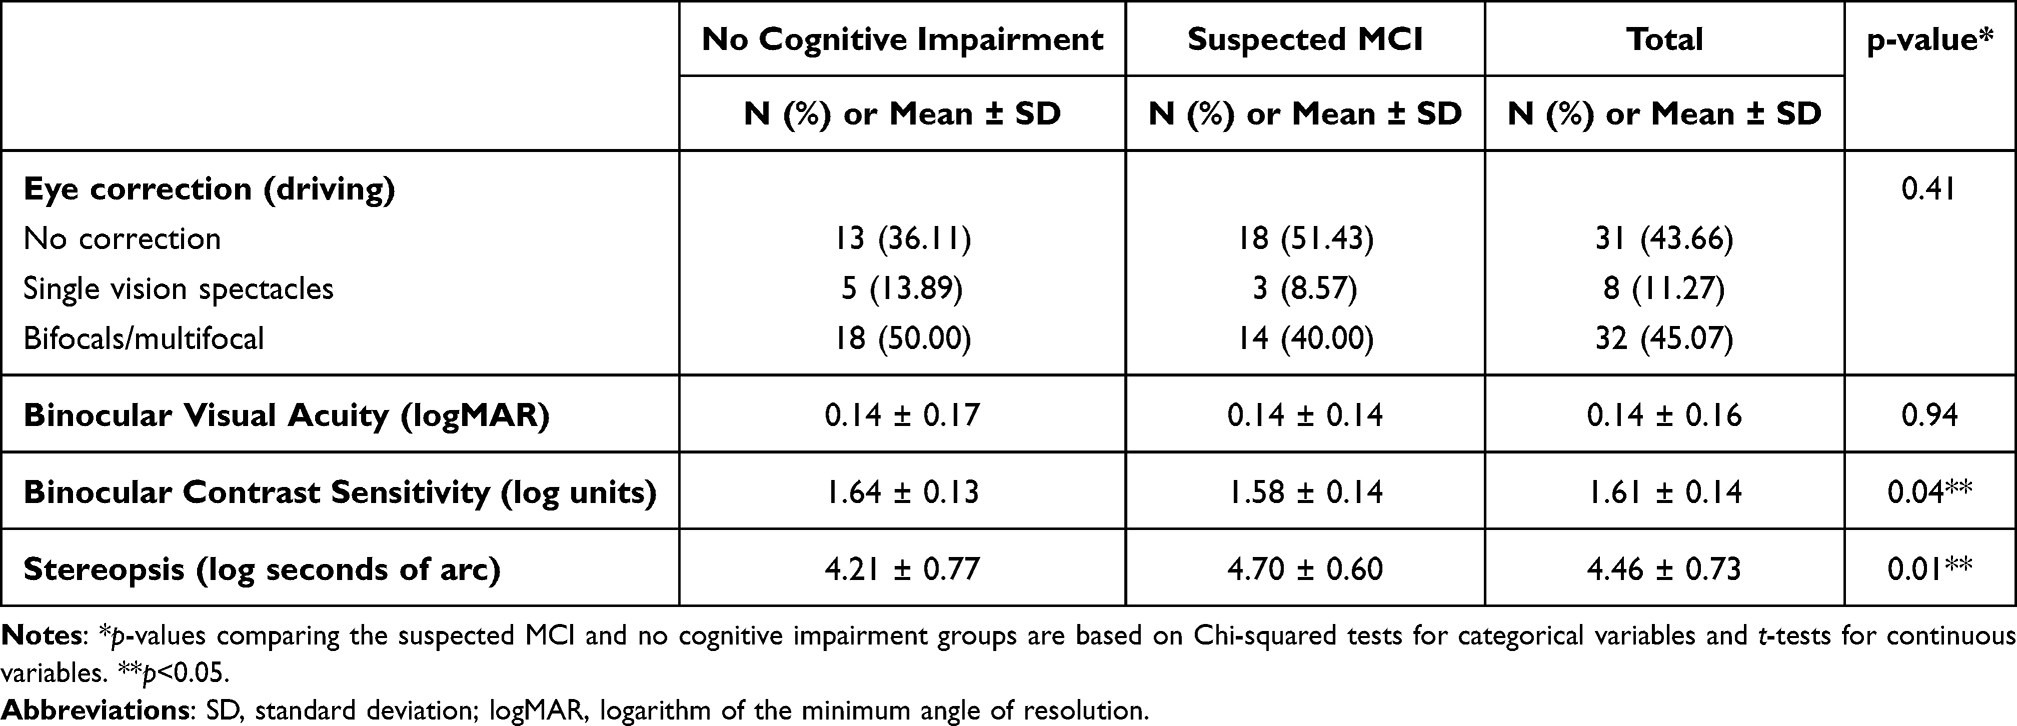 |
Table 2 Visual Characteristics of Older Drivers with and without Suspected MCI |
Fifty-one percent of drivers with suspected MCI wore no eye correction while driving, while only 36.1% of drivers without cognitive impairment wore no correction, however the difference was not significant (p=0.41).
Profile of Speeding Behaviour and Driving Exposure by Cognition and Gender
A total of 645.02 driving hours (mean=9.08, SD=4.85) representing 24,678.55 km travelled (mean=347.59, SD=244.56) and 3226 trips (mean=45.44, SD=19.37) were collected during the two-week driving monitoring period for all participants. When comparing driving exposure by gender, male drivers with suspected MCI drove significantly more kilometres over the two-week period (mean=408.25, SD=254.12), compared to female drivers with suspected MCI (mean=244.56, SD=110.27) (p=0.03). Similarly, male drivers without cognitive impairment drove significantly more kilometres (mean=447.46, SD=311.53), compared to female drivers without cognitive impairment (mean=245.86, SD=110.27) (p=0.02).
Overall, a total of 23 speeding events involving 13 participants were recorded (18.31%). This represented 0.71% of all trips for the study cohort. There were eight participants (suspected MCI: n=3, no cognitive impairment: n=5) who had recorded one speeding event and two participants (suspected MCI: n=1, no cognitive impairment: n=1) who recorded two speeding events. Three participants (suspected MCI: n=3) recorded three or more speeding events. Of the 13 participants who recorded a speeding event, 9 (69.23%) were male (suspected MCI: n=6, no cognitive impairment: n=3) and 4 were female (suspected MCI: n=1, no cognitive impairment: n=3).
Speeding events in different speed zones are summarised in Table 3. The majority of speeding events took place in the 60km/h and 70km/h speed limit zone. For drivers with suspected MCI the majority of speeding events took place in a 60km/h speed zone however, for drivers without cognitive impairment the majority of speeding events took place in either the 50km/h or 70km/h speed zones.
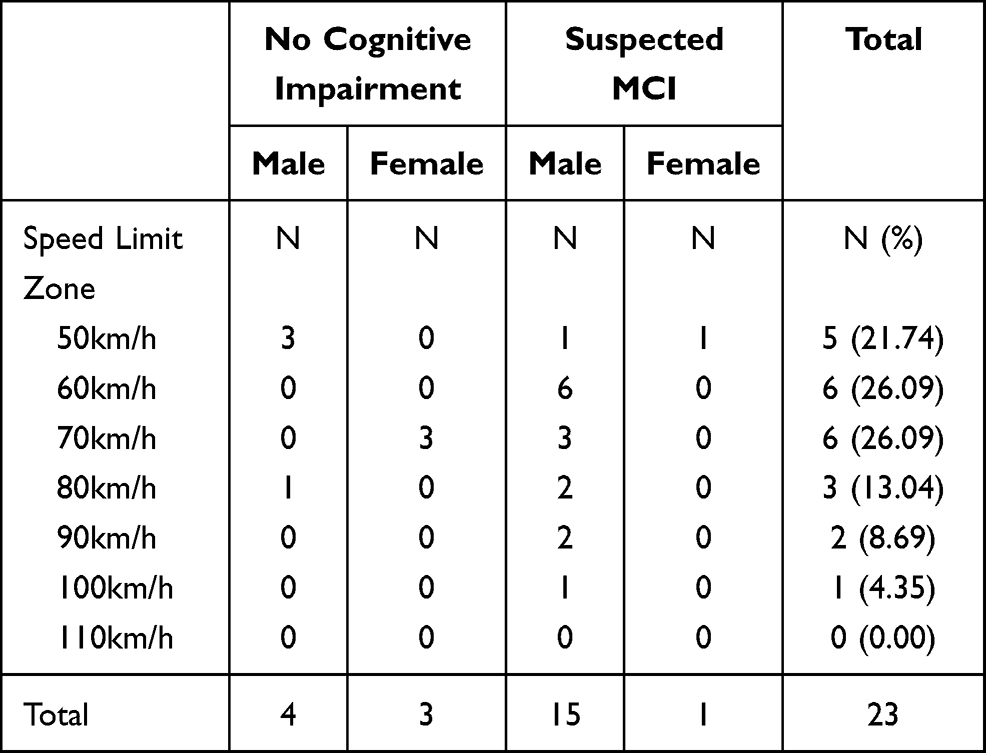 |
Table 3 Speeding Events in Drivers with and without Suspected MCI, Stratified by Speed Zone |
Association Between Cognition and Speeding Events by Gender
The results of the two separate multivariate negative binomial regression models, for male and female drivers aged ≥65 years, are summarised in Table 4. For female drivers, cognitive status (p=0.64), age (p=0.42), visual acuity (p=0.36) and contrast sensitivity (p=0.81) were not significantly associated with the rate of speeding events. However, male drivers with suspected MCI had a significant 7.5 times the rate of speeding events compared to males without cognitive impairment (IRR=7.45, 95% CI=1.53–36.15, p=0.01). Also, for every one year increase in age, the rate of speeding events significantly decreased by 20% (IRR=0.80, 95% CI=0.64–1.00, p=0.04) for males. Visual acuity (p=0.98) and contrast sensitivity (p=0.82) were not significant factors contributing to the rate of speeding events for males.
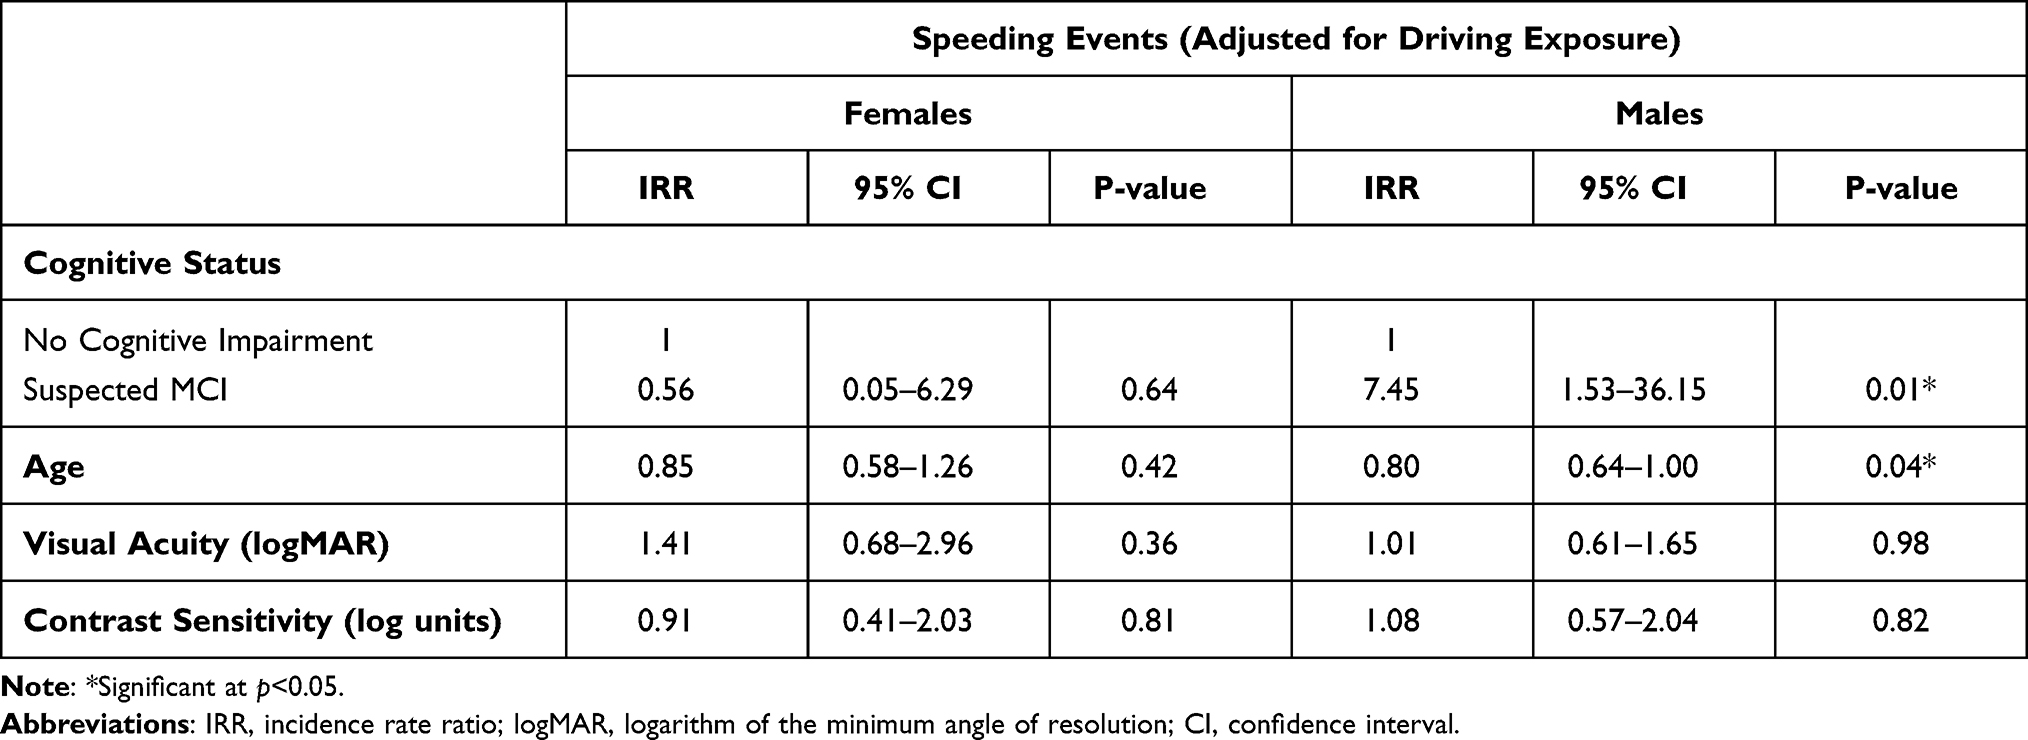 |
Table 4 The Results of the Multivariate Negative Binomial Regression Models Examining the Association Between Cognitive Status and the Rate of Speeding Events, by Gender |
Discussion
This study examined the association between cognition and speeding events for male and female drivers age ≥65 years. The results found that the prevalence of speeding events were infrequent with a total of 23 speeding events recorded for 71 participants during the two-week driving monitoring period. This finding was different to previous research by Cull et al where all 493 drivers in the study, aged 70+ years, exceeded the posted speed limit during the 25-day study period, although cognitive status was not assessed.22 Another study found that 78% of drivers aged 75+ years were involved in speeding events over a 12-month monitoring period.16 However, both of these studies collected driving data over a longer monitoring period and used a different operational definition of speeding, which may explain the different results.
Our study also found that the majority of these speeding events were carried out by males (83%) on roads with a speed limit of 60km/h or 70km/h and is consistent with previous research.22,23,40 While the relatively low rates of speeding are reassuring, they are occurring mainly on average suburban streets (mostly on 50km-70km/h roads) rather than on freeways or highways, which may present a risk to pedestrians and cyclists. It is well-known that in the event of a crash, a higher speed will increase the severity of a crash and increase the likelihood of a severe injury or death especially for vulnerable road users,41,42 as well as older drivers.2,43
Of significant importance, this study found that suspected MCI, as measured by the MoCA, was associated with a significant increase in the rate of speeding events for older male drivers, even after controlling for age, which differs from previous research. A recent naturalistic driving study found no association between cognitive function and low-range speeding16 and a subsequent study found a lower rate of high-range speeding events among those with poorer cognition.17 However, these studies used a different assessment for cognitive status as well as an older sample of drivers (aged 75+). Several simulator studies also found that drivers with MCI were more likely to drive at slower speeds, compared to drivers without cognitive impairment.13,44 A possible explanation for the observed association between suspected MCI and speeding for male drivers aged ≥65 years is that driving is a demanding task and cognitive impairment can contribute to attentional deficits45 which may lead to inappropriate speed regulation. Previous research by Broberg et al found that older drivers did not regularly look at the speedometer when driving and relied on the flow of traffic to manage their speed.46 The study also found that increasing age was associated with a lower rate of speeding events in older male drivers and is consistent with previous naturalistic driving studies.16,17,22,47 It is well known that driving at reduced speeds can compensate for slower reflexes and reaction times, which often accompany older age.5,6
Suspected MCI was associated with an increased rate of speeding events among male drivers in our study; however this was not the case for female drivers in a separate analysis. Previous research has demonstrated significant differences between older male and female driving patterns and behaviours.18–20 Specifically, studies have reported that among the general older population, male drivers have a greater propensity to speed than female drivers,22 and that older females are actually more likely to drive under the speed limit.48 It is possible that the older female drivers with and without suspected MCI in our study were self-regulating as part of the ageing process by driving more cautiously and/or at lower speeds. Future research should examine travelling under the speed limit for both male and female drivers, particularly as the prevalence of speeding events in our cohort was low.
The strength of this study is the naturalistic design of the study, which examined objective, real-time GPS driving data and is effective in addressing the limitations of self-reported and driving simulator studies.49 However, naturalistic driving studies rely solely on objective driving data and the motives for different driving behaviours are not known. Future studies using a combination of naturalistic driving data and self-reported questionnaires could provide more informed insights into the driving behaviour for drivers with and without MCI. Another limitation is the use of the MoCA. The MoCA is a screening test for cognition, and while it is useful for identifying older adults with suspected MCI who may require further cognitive testing, it cannot clinically diagnose MCI. The MoCA also does not examine episodic memory impairment in detail which is a common symptom, particularly for those who generally perform well in other cognitive domains. However it is considered superior to the Mini-Mental State Examination.50,51 Furthermore, the study only used the overall MoCA score, rather than examine the correlation between speeding and the different cognitive domains measured by the MoCA, such as visuospatial and executive functioning. Future research should examine this in more detail. It is also possible that participants may have forgotten to fill in their travel diary, which may have led to the removal of a valid trip. This is particularly relevant for those with MCI, as it is commonly accompanied by memory impairment.52 In addition, information on the speed limit of an area was obtained from the Geotab software, and it is possible that not all speeding events may have been captured. For example, temporarily reduced speed limits on road work areas are not normally captured by this software. Participants in this study were also a convenience sample and may have better cognitive function considering that the average MoCA score for those with suspected MCI in our study was relatively high. Finally, the small sample size and the limited two-week driving monitoring period limits the conclusion that we can draw from our findings.
Conclusion
While the number of speeding events were infrequent, the study found that suspected MCI was associated with a significant increase in the rate of speeding events for older male drivers, but not for older female drivers. Speeding interventions and injury prevention policy strategies should be targeted differently for male and female drivers with MCI, and there are implications for future research and fitness to drive, especially with the projected growth in the number of older drivers including those with MCI. Future research should examine the motives and attitudes towards speeding among older drivers with and without MCI, and why drivers with MCI may be more likely to speed, in addition to the collection of naturalistic driving data for a longer period.
Abbreviations
ADL, activities of daily living; CI, confidence interval; ETDRS, Early Treatment Diabetic Retinopathy Study; IRR, incidence rate ratio; km, kilometers; km/h, kilometers per hour; logMAR, logarithm of the minimum angle of resolution; MCI, mild cognitive impairment; MoCA, Montreal Cognitive Assessment; OARS, Older Americans Resources and Services; OARS-ADL, Older Americans Resources and Services-Activities of Daily Living; OBD II, On-Board Diagnostic II; OSM, OpenStreetMap; SD, standard deviation.
Acknowledgments
The authors would like to acknowledge Vicki Graham, Lynn Sargent and the Survey Research Centre, Edith Cowan University, for their assistance in recruiting and interviewing participants for this research study. The authors would also like to thank all participants for their involvement and participation in the study.
Funding
This work was supported by an Australian Research Council Linkage Grant #LP160101446.
Disclosure
The authors report no conflicts of interest in this work.
References
1. Bureau of Infrastructure, Transport and Regional Economics (BITRE). Road Trauma Australia 2019 Statistical Summary. Canberra ACT: BITRE; 2020.
2. Meuleners LB, Harding A, Lee AH, Legge M. Fragility and crash over-representation among older drivers in Western Australia. Accid Anal Prev. 2006;38(5):1006–1010. doi:10.1016/j.aap.2006.04.005
3. Hill LL, Andrews H, Li G, et al. Medication use and driving patterns in older drivers: preliminary findings from the LongROAD study. Inj Epidemiol. 2020;7(1):38. doi:10.1186/s40621-020-00265-y
4. Charlton JL, Koppel S, Odell M, et al. Influence of Chronic Illness on Crash Involvement of Motor Vehicle Drivers.
5. Doroudgar S, Chuang HM, Perry PJ, Thomas K, Bohnert K, Canedo J. Driving performance comparing older versus younger drivers. Traffic Inj Prev. 2017;18(1):41–46. doi:10.1080/15389588.2016.1194980
6. Shin H-K, Lee H-C. Characteristics of driving reaction time of elderly drivers in the brake pedal task. J Phys Ther Sci. 2012;24:567–570. doi:10.1589/jpts.24.567
7. Charlton JL, Oxley J, Fildes B, Oxley P, Newstead S. Self-regulatory behaviours of older drivers. Annu Proc Assoc Adv Automot Med. 2003;47:181–194.
8. Porter MM, Whitton MJ. Assessment of driving with the global positioning system and video technology in young, middle-aged, and older drivers. J Gerontol a Biol Sci Med Sci. 2002;57(9):M578–M582. doi:10.1093/gerona/57.9.M578
9. Albert MS, DeKosky ST, Dickson D, et al. The diagnosis of mild cognitive impairment due to alzheimer’s disease: recommendations from the national institute on aging-alzheimer’s association workgroups on diagnostic guidelines for alzheimer’s disease. Alzheimers Dement. 2011;7(3):270–279. doi:10.1016/j.jalz.2011.03.008
10. Petersen RC, Roberts RO, Knopman DS, et al. Prevalence of mild cognitive impairment is higher in men. The Mayo Clinic Study of aging. Neurology. 2010;75(10):889–897. doi:10.1212/WNL.0b013e3181f11d85
11. Bureau of Infrastructure, Transport and Regional Economics (BITRE). Road Safety of Older Australians: Recent Statistics. Canberra: BITRE, Australian Government; 2014.
12. Castellucci HI, Bravo G, Arezes PM, Lavallière M. Are interventions effective at improving driving in older drivers?: a systematic review. BMC Geriatr. 2020;20(1):125. doi:10.1186/s12877-020-01512-z
13. Fragkiadaki S, Beratis IN, Kontaxopoulou D, et al. Self-awareness of driving ability in the healthy elderly and patients with Mild Cognitive Impairment (MCI). Alzheimer Dis Assoc. 2018;32(2):107–113. doi:10.1097/WAD.0000000000000254
14. Kowalski K, Love J, Tuokko H, MacDonald S, Hultsch D, Strauss E. The influence of cognitive impairment with no dementia on driving restriction and cessation in older adults. Accid Anal Prev. 2012;49:308–315. doi:10.1016/j.aap.2011.11.011
15. Pavlou D, Papantoniou P, Papadimitriou E, et al. Self-assessment of older drivers with brain pathologies: reported habits and self-regulation of driving. J Transp Health. 2017;4:90–98. doi:10.1016/j.jth.2016.08.008
16. Chevalier A, Coxon K, Chevalier AJ, et al. Exploration of older drivers’ speeding behaviour. Transp Res Part F Traffic Psychol Behav. 2016;42:532–543. doi:10.1016/j.trf.2016.01.012
17. Chevalier A, Coxon K, Rogers K, et al. Predictors of older drivers’ involvement in high-range speeding behavior. Traffic Inj Prev. 2017;18(2):124–131. doi:10.1080/15389588.2016.1225297
18. D’Ambrosio LA, Donorfio LKM, Coughlin JF, Mohyde M, Meyer J. Gender differences in self-regulation patterns and attitudes toward driving among older adults. J Women Aging. 2008;20(3–4):265–282. doi:10.1080/08952840801984758
19. Gwyther H, Holland C. The effect of age, gender and attitudes on self-regulation in driving. Accid Anal Prev. 2012;45:19–28. doi:10.1016/j.aap.2011.11.022
20. Oxley J, Charlton J. Gender differences in attitudes to and mobility impacts of driving cessation. In: Women’s Issues in Transportation: Summary of the 4th International Conference, volume 2. National Acadamies of Sciences, Engineering, and Medicine. Washington, DC: The National Academies Press; 2011:64–73.
21. Bauer MJ, Adler G, Kuskowski MA, Rottunda S. The influence of age and gender on the driving patterns of older adults. J Women Aging. 2003;15(4):3–16. doi:10.1300/J074v15n04_02
22. Cull AW, Porter MM, Nakagawa S, et al. Speeding and speed modification of older drivers: does vehicle type make a difference? Can J Aging. 2020;39(3):385–392. doi:10.1017/S0714980819000394
23. Machin MA, Sankey KS. Relationships between young drivers’ personality characteristics, risk perceptions, and driving behaviour. Accid Anal Prev. 2008;40(2):541–547. doi:10.1016/j.aap.2007.08.010
24. Roberts RO, Geda YE, Knopman DS, et al. The incidence of MCI differs by subtype and is higher in men: the Mayo Clinic Study of aging. Neurology. 2012;78(5):342–351. doi:10.1212/WNL.0b013e3182452862
25. Lin KA, Choudhury KR, Rathakrishnan BG, Marks DM, Petrella JR, Doraiswamy PM. Marked gender differences in progression of mild cognitive impairment over 8 years. Alzheimers Dement. 2015;1(2):103–110. doi:10.1016/j.trci.2015.07.001
26. Feng YR, Meuleners L, Stevenson M, Heyworth J, Murray K, Maher S. Driver self-regulation practices in older drivers with and without mild cognitive impairment. Clin Interv Aging. 2020;15:217–224. doi:10.2147/CIA.S236998
27. Feng YR, Meuleners L. Planning for driving cessation in older drivers. Transp Res Part F Traffic Psychol Behav. 2020;72:62–70. doi:10.1016/j.trf.2020.05.005
28. Feng YR, Meuleners L, Stevenson M, Heyworth J, Murray K, Maher S. Driving exposure, patterns and safety critical events for older drivers with and without mild cognitive impairment: findings from a naturalistic driving study. Accid Anal Prev. 2021;151:105965. doi:10.1016/j.aap.2020.105965
29. Nasreddine ZS, Phillips NA, Bédirian V, et al. The Montreal Cognitive Assessment, MoCA: a brief screening tool for mild cognitive impairment. J Am Geriatr Soc. 2005;53(4):695–699. doi:10.1111/j.1532-5415.2005.53221.x
30. Freitas S, Simões MR, Alves L, Duro D, Santana I. Montreal Cognitive Assessment (MoCA): validation study for frontotemporal dementia. J Geriatr Psychiatry Neurol. 2012;25(3):146–154. doi:10.1177/0891988712455235
31. Moafmashhadi P, Koski L. Limitations for interpreting failure on individual subtests of the montreal cognitive assessment. J Geriatr Psychiatry Neurol. 2013;26(1):19–28. doi:10.1177/0891988712473802
32. Staplin L, Lococo K, Mastromatto T, Gish K, Golembiewski G, Sifrit K. Mild Cognitive Impairment and Driving Performance (Report No DOT HS 812 577). Washington, DC: National Highway Traffic Safety Administration; 2019.
33. Fillenbaum G. Multidimensional Functional Assessment of Older Adults. Erlbaum. Hillsdale, NJ: Center for the Study of Aging and Human Development, Duke University Medical Center; 1988. [updated 1996]. Durham, NC 27710, USA, 1988.
34. Lee M-T, Jang Y, Chang W-Y, Innamorati M. How do impairments in cognitive functions affect activities of daily living functions in older adults? PLoS One. 2019;14(6):e0218112–e0218112. doi:10.1371/journal.pone.0218112
35. Yesavage JA, Brink TL, Rose TL, et al. Development and validation of a geriatric depression screening scale: a preliminary report. J Psychiatr Res. 1982;17(1):37–49. doi:10.1016/0022-3956(82)90033-4
36. Wickens C, Smart R, Mann R. The impact of depression on driver performance. Int J Ment Health Addict. 2014;12:524–537. doi:10.1007/s11469-014-9487-0
37. Ferris FL
38. Kloeden C, Mclean A, Moore V, Ponte G. Travelling Speed and the Risk of Crash Involvement. Adelaide, South Australia: NHMRC Road Accident Research Unit, The University of Adelaide; 1997.
39. Huisingh C, Levitan EB, Irvin MR, MacLennan P, Wadley V, Owsley C. Visual sensory and visual-cognitive function and rate of crash and near-crash involvement among older drivers using naturalistic driving data. Invest Ophthalmol Vis Sci. 2017;58(7):2959–2967. doi:10.1167/iovs.17-21482
40. Watson A, Kaye S-A, Fleiter J, Freeman J. Effectiveness of vehicle impoundment for high-range speeding offences in Victoria, Australia. Accid Anal Prev. 2020;145:105690. doi:10.1016/j.aap.2020.105690
41. Tefft BC. Impact speed and a pedestrian’s risk of severe injury or death. Accid Anal Prev. 2013;50:871–878. doi:10.1016/j.aap.2012.07.022
42. Boufous S, de Rome L, Senserrick T, Ivers R. Risk factors for severe injury in cyclists involved in traffic crashes in Victoria, Australia. Accid Anal Prev. 2012;49:404–409. doi:10.1016/j.aap.2012.03.011
43. Williams AF, Kyrychenko SY, Retting RA. Characteristics of speeders. J Safety Res. 2006;37(3):227–232. doi:10.1016/j.jsr.2006.04.001
44. Pavlou D, Papadimitriou E, Antoniou C, et al. Comparative assessment of the behaviour of drivers with mild cognitive impairment or alzheimer’s disease in different road and traffic conditions. Transp Res Part F Traffic Psychol Behav. 2017;47:122–131. doi:10.1016/j.trf.2017.04.019
45. Saunders NL, Summers MJ. Attention and working memory deficits in mild cognitive impairment. J Clin Exp Neuropsychol. 2010;32(4):350–357. doi:10.1080/13803390903042379
46. Broberg T, Dukic Willstrand T. Safe mobility for elderly drivers—considerations based on expert and self-assessment. Accid Anal Prev. 2014;66:104–113. doi:10.1016/j.aap.2014.01.014
47. Chevalier A, Coxon K, Chevalier AJ, et al. A longitudinal investigation of the predictors of older drivers’ speeding behaviour. Accid Anal Prev. 2016;93:41–47. doi:10.1016/j.aap.2016.04.006
48. Classen S, Shechtman O, Joo Y, Awadzi KD, Lanford D. Traffic violations versus driving errors: implications for older female drivers.
49. Silverstein NM, Gottlieb AG, Eby DW, et al. Do memory-impaired drivers and their family members agree on driving ability and behaviors? Transp Res Rec. 2011;2265(1):200–206. doi:10.3141/2265-23
50. Ciesielska N, Sokołowski R, Mazur E, Podhorecka M, Polak-Szabela A, Kędziora-Kornatowska K. Is the Montreal Cognitive Assessment (MoCA) test better suited than the Mini-Mental State Examination (MMSE) in mild cognitive impairment (MCI) detection among people aged over 60? Meta-analysis. Psychiatr Pol. 2016;50(5):1039–1052. doi:10.12740/PP/45368
51. Dautzenberg G, Lijmer J, Beekman A. Diagnostic accuracy of the Montreal Cognitive Assessment (MoCA) for cognitive screening in old age psychiatry: determining cutoff scores in clinical practice. Avoiding spectrum bias caused by healthy controls. Int J Geriatr Psychiatry. 2020;35(3):261–269.
52. Petersen RC, Caracciolo B, Brayne C, Gauthier S, Jelic V, Fratiglioni L. Mild cognitive impairment: a concept in evolution. J Intern Med. 2014;275(3):214–228. doi:10.1111/joim.12190
 © 2021 The Author(s). This work is published and licensed by Dove Medical Press Limited. The
full terms of this license are available at https://www.dovepress.com/terms
and incorporate the Creative Commons Attribution
- Non Commercial (unported, 3.0) License.
By accessing the work you hereby accept the Terms. Non-commercial uses of the work are permitted
without any further permission from Dove Medical Press Limited, provided the work is properly
attributed. For permission for commercial use of this work, please see paragraphs 4.2 and 5 of our Terms.
© 2021 The Author(s). This work is published and licensed by Dove Medical Press Limited. The
full terms of this license are available at https://www.dovepress.com/terms
and incorporate the Creative Commons Attribution
- Non Commercial (unported, 3.0) License.
By accessing the work you hereby accept the Terms. Non-commercial uses of the work are permitted
without any further permission from Dove Medical Press Limited, provided the work is properly
attributed. For permission for commercial use of this work, please see paragraphs 4.2 and 5 of our Terms.