Back to Journals » Journal of Multidisciplinary Healthcare » Volume 16
The Imaging Features and Diagnostic Value of Computerised Tomography in Seminal Duct Tuberculosis
Authors Qi M, Zhang L, Gan W, Xu Y, Wei J, Fu X, Li X
Received 15 December 2022
Accepted for publication 23 March 2023
Published 18 May 2023 Volume 2023:16 Pages 1395—1402
DOI https://doi.org/10.2147/JMDH.S401660
Checked for plagiarism Yes
Review by Single anonymous peer review
Peer reviewer comments 2
Editor who approved publication: Dr Scott Fraser
Min Qi,1,* Le Zhang,2,* Wei Gan,1 Yanling Xu,1 Jialu Wei,1 Xuwen Fu,1 Xiang Li1
1Department of Radiology, The Third People’s Hospital in Kunming/Yunnan Clinical Medical Center for Infectious Diseases, Kunming, 650041, People’s Republic of China; 2Department of ICU, The Third People’s Hospital in Kunming/Yunnan Clinical Medical Center for Infectious Diseases, Kunming, 650041, People’s Republic of China
*These authors contributed equally to this work
Correspondence: Xiang Li, Department of Radiology, The Third People’s Hospital in Kunming/Yunnan Clinical Medical Center for Infectious Diseases, No. 319 of Wujing Street, Guandu District, Kunming, 650041, People’s Republic of China, Tel +86 871 6352 3507, Fax +86 871 6351 4717, Email [email protected]
Objective: To analyse the computerised tomography (CT) imaging features and diagnostic value of seminal duct tuberculosis (TB).
Methods: The imaging data of male patients with ejaculatory duct TB who underwent surgical treatment in our hospital from 1 January 2019 to 31 December 2019 were retrospectively analysed. Through CT images, seminal duct TB was divided into different types, and the CT image features of different types of TB were analysed. The differences in diagnosis between CT and pathological results were compared.
Results: According to the CT manifestations of TB of the intrapelvic segment of seminal duct TB, this disease could be divided into an intra-tubular calcification type, a lumen dilatation and effusion type and a wall thickening type, among which 6 cases (15.8%) were intra-tubular calcification types, 14 cases (36.8%) were lumen dilatation and effusion types and 18 cases (47.4%) were wall thickening types. The diagnostic efficacy of CT in the diagnosis of ejaculatory duct TB: sensitivity = 63.89% (23/36), specificity = 80.01% (44/53), accuracy = 75.28% (67/89), positive predictive value = 51.87% (43/109), negative predictive value = 77.19% (44/57) and kappa = 0.558.
Conclusion: CT has high sensitivity and specificity in the diagnosis of seminal duct TB. The classification of seminal duct TB using CT images is of great significance for the diagnosis and treatment of the disease.
Keywords: seminal duct, tuberculosis, computerised tomography
Introduction
Tuberculosis (TB) has become a global public health problem. According to the World Health Organisation,1 there were 10 million TB cases worldwide in 2018. TB is a multi-system and multi-organ disease, which most often occurs in the lungs but can also occur in extrapulmonary organs, known as extrapulmonary TB. Compared with TB, extrapulmonary TB does not lead to the spread of TB, so the public pays less attention to it.2 According to statistics, extrapulmonary TB accounts for 20–50% of all TB,3–5 while in China, it accounts for about 32% of all TB.6
Urogenital TB accounts for about 14–41% of all extrapulmonary TB,7 and about 2/3 of patients with genital TB are complicated with urogenital TB.8 Studies have shown that TB in the male reproductive system is secondary to renal TB,9 and epididymal and prostatic TB is the most common TB in the male reproductive system.10 The delayed diagnosis and treatment of TB in the male reproductive system can lead to serious complications such as male infertility, perineal tuberculous abscesses and persistent sinus formation. In addition, male epididymal TB may be transmitted to women through sexual transmission.11
The imaging findings of the seminal duct TB are rarely reported. Studies have shown that ultrasound has a certain diagnostic value for the seminal ductnodules, but the diagnostic value for the pelvic part of the vas deferens is lower than that of the scrotum and inguinal segment.12 At present, there is no report on the CT imaging features of vas deferens TB. The purpose of this study is to analyse the CT manifestations of seminal duct TB, improve the clinical understanding of the disease and avoid serious complications caused by delayed diagnosis and treatment.
Materials and Methods
Materials
The imaging data of male patients with seminal duct TB who underwent surgical treatment in our hospital from 1 January 2019 to 31 December 2019 were retrospectively analysed. The inclusion criteria were as follows: (1) patients who were diagnosed with TB, and received surgical treatment, according to clinical manifestations, laboratory examination, imaging findings and pathological findings; (2) patients aged 18–80 years old; (3) male patients who underwent CT examination; (4) patients’ medical records and imaging data were complete. The exclusion criteria were as follows: (1) patients with mental illness; (2) patients with cognitive impairment and disturbance of consciousness who were unable to communicate normally. The study was approved by the institutional research and ethics committee of our hospital, and all patients provided informed consent.
Examining Method
All patients underwent chest and abdominal pelvis CT scanning. The CT scanning equipment used was UCT510, the voltage of the plain and enhanced scan tubes was 120 KV and the tube current used the automatic milliampere technique. The chest scan ranged from the apex of the lung to the diaphragm, and the abdominal and pelvic scans ranged from the diaphragm to the scrotum. The contrast medium was lophenol (1.2 mL/kg, injection rate 2.5–3 mL/s). The renal arterial phase, parenchymal phase and delayed phase of the abdominal and pelvic enhanced scan were observed. The arterial phase was 20–25 seconds after the injection of the iodine contrast medium, the parenchymal phase was 60–70 seconds after the injection of the iodine contrast medium and the delay time was 180 seconds after the injection of the iodine contrast medium. The thickness of the plain and enhanced scan was 5 mm in the chest and abdominal pelvis and 1.25 mm in reconstruction.
Computerised Tomography Image Analysis
The chest and abdominal CT findings of the patients were analysed by blind reading the film by two doctors who had been engaged in abdominal imaging diagnosis of infectious diseases for many years. If the two doctors read the film inconsistently, a third doctor would read the film and a consensus would be reached through consultation.
The diagnostic efficacy of each imaging method was calculated using the pathological diagnosis as the gold standard. The formula was as follows: sensitivity = true-positive cases / (true-positive cases + false-negative cases) × 100%, specificity = true-negative cases / (true-negative cases + false-positive cases) × 100%, accuracy = (true-positive cases + true-negative cases) / total cases × 100%, positive predictive value = true-positive cases / (true-positive cases + false-positive cases) × 100% and negative predictive value = true-negative cases (true-negative cases + false-negative cases) × 100%. The consistency between the diagnostic methods and the pathological diagnosis results was analysed.
Statistical Analysis
The SPSS 22.0 statistical software was used for data analysis. Descriptive analysis was performed on the results of various detection methods, and the chi-square test was performed on different examination results. The kappa test was used for consistency analysis between pathological results and imaging results. The kappa value was between −1 and 1. When it was greater than 0, it was considered meaningful. The higher the kappa value, the better the consistency was, and P < 0.05 was considered statistically significant.
Results
Basic Information
From 1 January 2019 to 31 December 2019, a total of 89 patients underwent surgery for seminal ductTB. After the screening, 38 cases were included as participants. The age of patients ranged from 24 to 77 years, with a median age of 29 years. Among them, 3 cases had diabetes and 20 cases had TB in other parts. There were 16 patients with left seminal duct TB, 10 patients with right seminal duct TB and 12 patients with bilateral TB. See Table 1 for details.
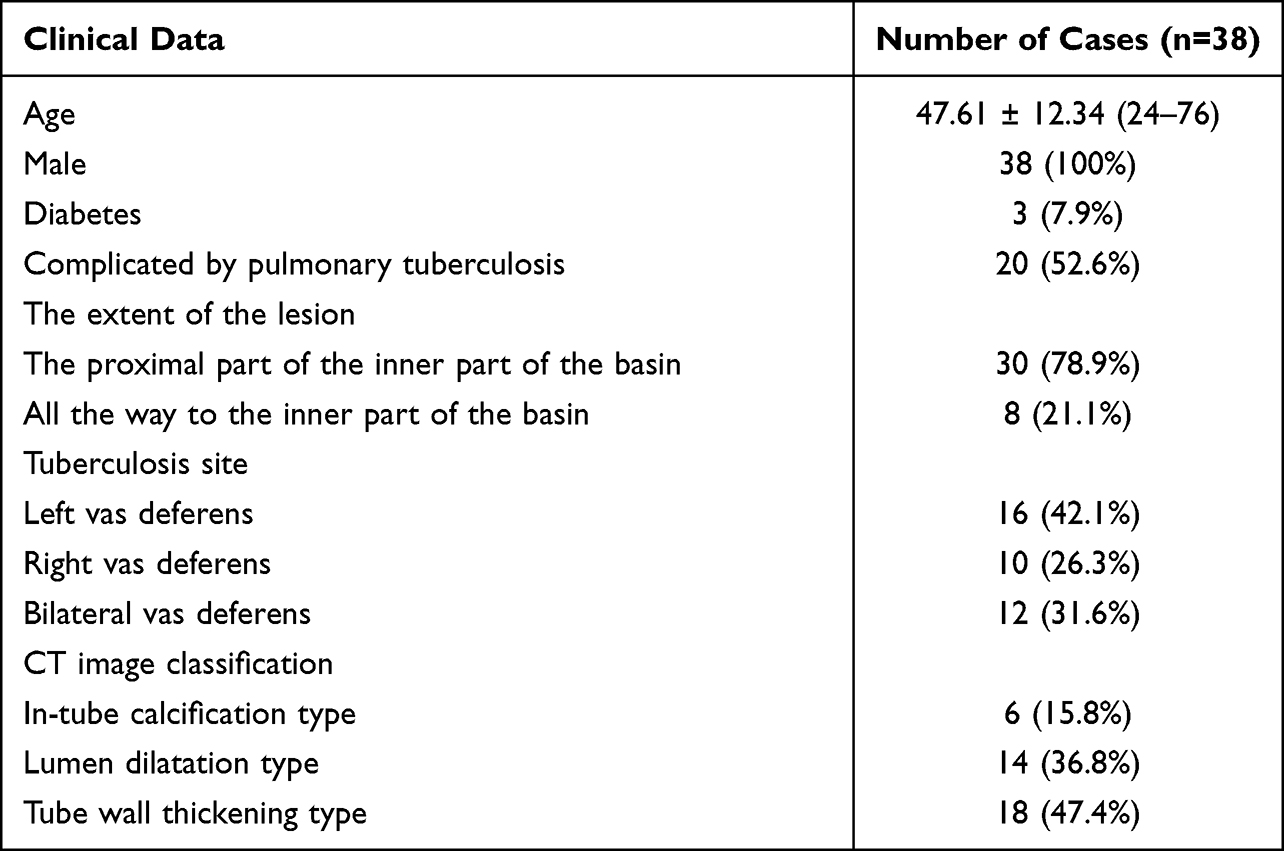 |
Table 1 Clinical Data |
Classification and Imaging Findings of Intrapelvic Vas Deferens Tuberculosis
Of the 38 patients, 16 (42.1%) had lesions on the left seminal duct, 10 (26.3%) had lesions on the right seminal duct and 12 (31.6%) had lesions on both seminal duct . According to the imaging findings, the intrapelvic TB of seminal duct can be divided into three types: intraductal calcification, wall thickening and lumen dilatation. There were 6 cases (15.8%) of intraluminal calcification, 14 cases (36.8%) of dilatation and 18 cases (47.4%) of wall thickening (see Table 1).
Intraductal Calcification
In the plain CT scan, the calcification pattern in the catheter was better, showing nodular (Figure 1A), punctate (Figure 1B) or irregular (Figure 1C-D) vas deferens calcification with or without vas deferens dilatation. CT coronal reconstruction helps to distinguish calcification in the seminal vesicle from calcification in Douglas-Rushkoff.
 |
Figure 1 Intraductal calcification of tubercle of vas deferens. Notes: (A-D) Different calcification types of the vas deferens (black arrows), and adjacent seminal vesicle glands (white arrows). |
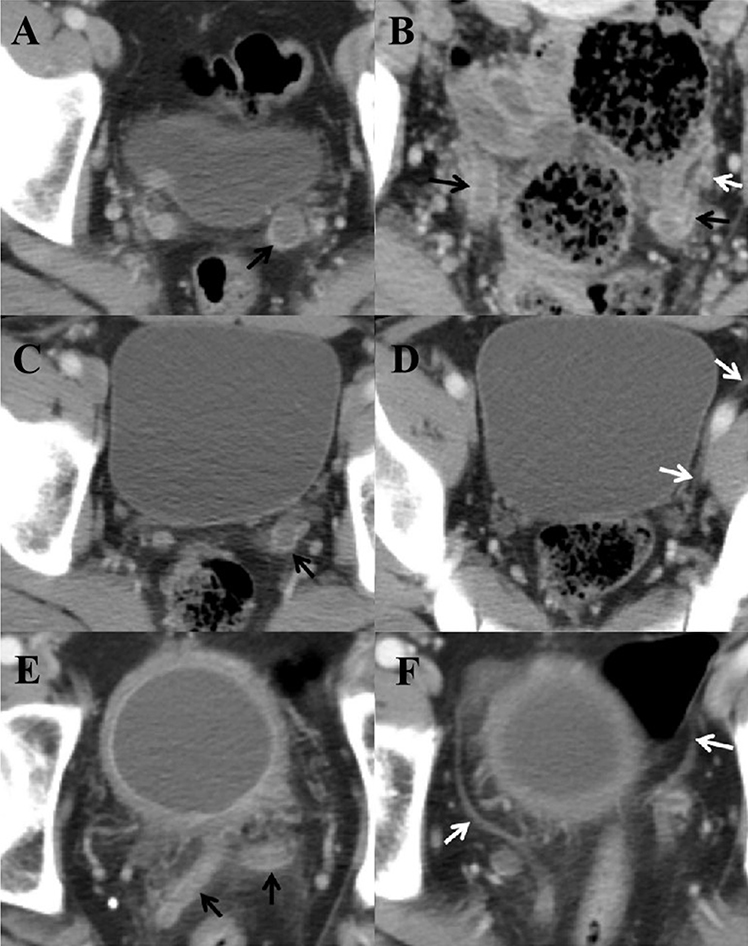 |
Figure 2 Vas deferens duct string bead calcification. Notes: (A–F) Low-density effusion in the dilated lumen of the left vas deferens (black arrow); expanded vas deferens (white arrow). |
The type of vas deferens dilatation is characterized by thickening of the vas deferens wall, vas deferens dilatation, low-density effusion in the lumen, significant enhancement of the thickened wall during enhanced scan, and no enhancement of effusion in the lumen. This is most common in the proximal vas deferens, where the density of the surrounding fat space increases. This is because the vas deferens is very close to the ureter. In some patients, due to the ipsilateral thickening of the ureter and vas deferens wall, it is necessary to observe at a continuous level for identification. The wall thickening pattern is characterized by thickening of the vas deferens, no obvious fluid accumulation in the lumen, thickening of the wall, with or without increased density of perivascular fat space. Some lesions may show vas deferens bead changes.
Dilatation of the Lumen of Tubercle of Vas Deferens
Figure 2 shows a contrast-enhanced scan in the parenchymal phase of the left vas deferens dilatation, wall thickening, and enhancement, and lumen can be seen as slightly low-density effusion shadow (black arrow Figure 2A). On contrast-enhanced CT, the vas deferens was dilated bilaterally in the parenchymal phase, the wall of the vas deferens was thickened and enhanced and a slightly low-density effusion (black arrow Figure 2B) was seen in the lumen of the vas deferens. On the left side of the vas deferens, its wall was thickened and dilated, and on the left side of the ureter, it was thickened and dilated (white arrow Figure 2B). On the contrast-enhanced scan, the left vas deferens was dilated, its wall was thickened and enhanced and a slightly low-density shadow (black arrow Figure 2C) was seen in the lumen. The distended vas deferens was normal (white arrow Figure 2D). In the parenchymal phase of the enhanced scan, the bilateral vas deferens was dilated, its wall was thickened and strengthened, the lumen had slightly low-density fluid, the density of fat around the wall was increased (black arrow Figure 2E) and the distally dilated vas deferens was normal (white arrow Figure 2F).
Vas Deferens Tuberculosis with Wall Thickening
Figure 3 shows that the wall of the proximal vas deferens was thickened and enhanced (black arrow) in the parenchymal phase of the enhanced scan. In the parenchymal phase of the enhanced scan, the inner part of the left vas deferens was enlarged, and the wall of the vas deferens was thickened and strengthened (black arrow). In contrast-enhanced scanning, the inner part of the left vas deferens was enlarged more than the contralateral one, and the proximal inguinal segment was inhomogeneously enlarged with beaded changes (black arrow).
 |
Figure 3 Intraductal calcification of tubercle of vas deferens. Notes: (A-D) Different calcification types of the vas deferens (black arrows), and adjacent seminal vesicle glands (white arrows). |
Consistency Analysis of the Computerised Tomography Diagnosis of Ejaculatory Duct Tuberculosis and Pathological Results
The diagnostic efficacy of CT in the diagnosis of ejaculatory duct TB: sensitivity = 63.89% (23/36), specificity = 80.01% (44/53), accuracy = 75.28% (67/89), positive predictive value = 51.87% (43/109), negative predictive value = 77.19% (44/57) and kappa = 0.558. The results are shown in Table 2.
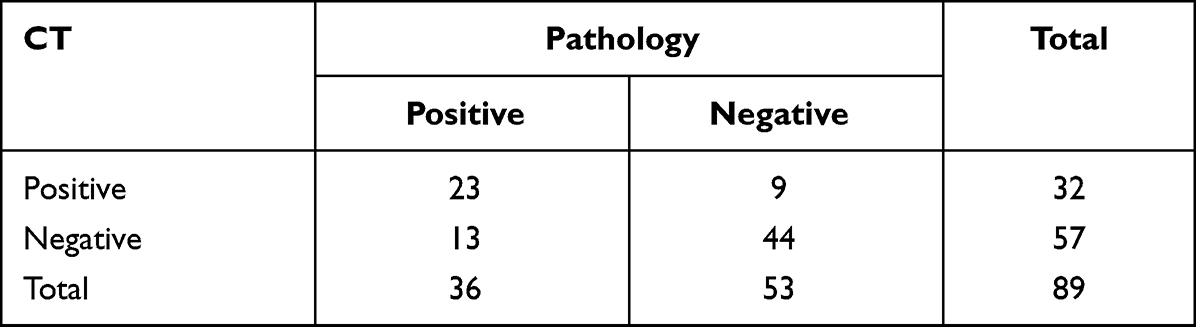 |
Table 2 Consistency Analysis of CT Diagnosis of Ejaculatory Duct TB and Pathological Results |
Discussion
Urogenital TB accounts for approximately 14–41% of all extrapulmonary TB,6,7 and epididymal and prostate TB are the most common forms of TB in the male reproductive system.8 TB in the male reproductive system is usually secondary to TB of the urinary system, and some believe that it is caused by hematogenous, lymphatic dissemination or the spread of TB infection in the adjacent organs. The time between the initial infection and the onset of clinical symptoms may be as long as 5–40 years.9–12 This also poses a huge challenge to the collection of epidemiological histories of TB diagnosis. TB of the epididymis is the most common type of TB in the male reproductive system. Most of the patients present with painless scrotum enlargement. All patients with TB of the vas deferens were complicated with TB of the epididymis or testis, but the vas deferens disease itself causes the symptoms, and semen examination needs further research.
The vas deferens is the direct continuation of the testicular duct, which can be divided into the testicle, spermatic cord and inguinal and pelvic regions, according to anatomy. The TB of the vas deferens may be caused by the antegrade infection of the prostate and the retrograde infection of the epididymis.13 TB of the prostate is generally asymptomatic and is often found incidentally in imaging studies of urinary tract TB, and its true incidence is underestimated.10 Epididymal TB is clinically characterised by chronic scrotal pain, and its pathogenesis has also been suggested to be a hematogenous spread of TB or retrograde infection of TB in the urinary system.14 The urinary system may be involved in the kidney, ureter, bladder and urethra. The typical CT findings of renal TB are multiple low-density shadows of the kidney, which are enhanced with garland-like enhancement and a palette-like change.15 Ureteric TB on CT presents with ureteric dilatation and thickening of the wall, whereas bladder TB on CT often presents with reduced bladder volume and thickening of the wall of the bladder, with marked enhancement on contrast-enhanced scan.16
In this group, 47.4% of the vas deferens TB cases were complicated with urinary TB, all cases were complicated with epididymal or testicular TB and the vas deferens was not easy to be observed on CT images because of its small lumen. Ultrasound of the tubercle of the vas deferens can show diffuse or nodular thickening,17 but ultrasound is less effective in observing the inside of the pelvis. Therefore, in the occurrence of urinary TB and epididymal-testicular TB, it is necessary to observe the vas deferens to check for lesions. In most of the cases, TB of the vas deferens involved one side of the vas deferens, and the calcification in the vas deferens presented as punctate, nodular and irregular calcification in the lumen of the vas deferens, and the wall of the vas deferens may have been thickened. Moreover, intraluminal calcification may be the imaging manifestation of TB healing. The pathological basis of the type of thickening was the formation of granuloma in the wall of the ureter, which was characterised by the obvious thickening and enhancement of the wall with or without inflammatory infiltration around the wall. The dilatation of the lumen was characterised by thickening and dilatation of the lumen, obvious enhancement of the wall of the lumen and the presence of low-density fluid shadow in the dilatation of the lumen. Because the vas deferens and the seminal vesicular glands open into the ejaculatory duct together, TB of the ejaculatory duct, when involved, causes cicatricial stricture, which results in dilatation of the distal lumen.16 During the acute phase, seminal vesicles can appear enlarged, with wall and septal thickening on CT, while atrophy and calcifications can be observed during chronic disease.18 In rare cases, a TB granuloma of the vas deferens may rupture, resulting in a peripheral abscess,17 which has not been found in this group of cases.
In this study, the consistency between the diagnostic results of CT in seminal duct TB and pathological results was evaluated. The results showed that the diagnostic efficacy of CT in the diagnosis of seminal duct TB: sensitivity = 63.89%), specificity = 80.01%, accuracy = 75.28%, positive predictive value = 51.87%, negative predictive value = 77.19% and kappa = 0.558. The reasons for analysis were as follows: the CT resolution was higher and image overlap and artefacts were less affected, so it could clearly reflect the changes in seminal duct TB and accessories. This means that CT has high sensitivity in the diagnosis of calcification. By comparing the three imaging methods of CT, magnetic resonance imaging and X-ray with histopathology, Qiang et al19 found that CT had the best diagnostic effect.
Conclusion
In summary, CT has high sensitivity and specificity in the diagnosis of seminal duct TB. The classification of seminal duct TB by CT images is of great significance for the diagnosis and treatment of the disease. However, due to the small number of patients included in this study, and the fact that only patients in our hospital were selected as the research participants, there may be bias in the admission rate. In the future, more samples will be included for more in-depth research.
Acknowledgments
We would like to express our gratitude to all those who helped us during the writing of this manuscript.
Funding
Health Research Project of Kunming National Health Commission (2022-09-01-001).
Disclosure
The authors report no conflicts of interest in this work.
References
1. Chakaya J, Khan M, Ntoumi F, et al. Global tuberculosis report 2020 – reflections on the global TB burden, treatment and prevention efforts. Int J Infect Dis. 2021;113(Suppl1):S7–S12. doi:10.1016/j.ijid.2021.02.107
2. Sanches I, Carvalho A, Duarte R. Who are the patients with extrapulmonary tuberculosis? Rev Port Pneumol. 2015;21(2):90–93. doi:10.1016/j.rppnen.2014.06.010
3. Sandgren A, Hollo V, van der Werf MJ. Extrapulmonary tuberculosis in the European Union and European Economic Area, 2002 to 2011. Euro Surveill. 2013;18(12):20431. doi:10.2807/ese.18.12.20431-en
4. Peto HM, Pratt RH, Harrington TA, LoBue PA, Armstrong LR. Epidemiology of extrapulmonary tuberculosis in the United States, 1993–2006. Clin Infect Dis. 2009;49(9):1350–1357. doi:10.1086/605559
5. Sama JN, Chida N, Polan RM, Nuzzo J, Page K, Shah M. High proportion of extrapulmonary tuberculosis in a low prevalence setting: a retrospective cohort study. Public Health. 2016;138:101–107. doi:10.1016/j.puhe.2016.03.033
6. Kang WL, Yu JJ, Du J, et al. The epidemiology of extrapulmonary tuberculosis in China: a large-scale multi-center observational study. PLoS One. 2020;15(8):e237753. doi:10.1371/journal.pone.0237753
7. Lulu BS, Coran AG, Shehadeh N, Shami R, Mogilner JG, Sukhotnik I. Oral insulin stimulates intestinal epithelial cell turnover following massive small bowel resection in a rat and a cell culture model. Pediatr Surg Int. 2012;28(2):179–187. doi:10.1007/s00383-011-2991-4
8. Yadav S, Singh P, Hemal A, Kumar R. Genital tuberculosis: current status of diagnosis and management. Transl Androl Urol. 2017;6(2):222–233. doi:10.21037/tau.2016.12.04
9. Rodriguez-Takeuchi SY, Renjifo ME, Medina FJ. Extrapulmonary tuberculosis: pathophysiology and imaging findings. Radiographics. 2019;39(7):2023–2037. doi:10.1148/rg.2019190109
10. Ramachandran A, Das CJ, Razik A. Male genital tract tuberculosis: a comprehensive review of imaging findings and differential diagnosis. Abdom Radiol. 2021;46(4):1677–1686. doi:10.1007/s00261-020-02811-0
11. Kimura M, Araoka H, Baba H, et al. First case of sexually transmitted asymptomatic female genital tuberculosis from spousal epididymal tuberculosis diagnosed by active screening. Int J Infect Dis. 2018;73:60–62. doi:10.1016/j.ijid.2018.05.021
12. Wenzhi Z, Gaoyi Y, Dali W, Wen BP, Xu JP, Jiang HQ. Ultrasonography findings of tuberculosis of vas deferens. Chin J Ultrasound Med. 2014;30(8):737–739.
13. Kumar R. Reproductive tract tuberculosis and male infertility. Indian J Urol. 2008;24(3):392–395. doi:10.4103/0970-1591.42624
14. Matos MJ, Bacelar MT, Pinto P, Ramos I. Genitourinary tuberculosis. Eur J Radiol. 2005;55(2):181–187. doi:10.1016/j.ejrad.2005.04.016
15. Wu J, Gao F, Huang GQ, Liu CH, Wang XM, Yuan HQ. The comparative study of contrast-enhanced ultrasound and CT in the diagnosis of renal tuberculosis. Chin J Ultrasound Med. 2017;33(09):796–799.
16. Yang DM, Kim HC, Kim SW, et al. Sonographic findings of tuberculous vasitis. J Ultrasound Med. 2014;33(5):913–916. doi:10.7863/ultra.33.5.913
17. Naeem M, Zulfiqar M, Siddiqui MA, et al. Imaging manifestations of genitourinary tuberculosis. Radiographics. 2021;41(4):1123–1143. doi:10.1148/rg.2021200154
18. Mantica G, Ambrosini F, Riccardi N, et al. Genitourinary tuberculosis: a comprehensive review of a neglected manifestation in low-endemic countries. Antibiotics. 2021;10(11):1399. PMID: 34827337; PMCID: PMC8614939. doi:10.3390/antibiotics10111399
19. Qiang L. Comparative Study of Imaging Findings and Histopathology of Spinal Tuberculosis. Ningxia Medical University; 2019.
 © 2023 The Author(s). This work is published and licensed by Dove Medical Press Limited. The
full terms of this license are available at https://www.dovepress.com/terms
and incorporate the Creative Commons Attribution
- Non Commercial (unported, 3.0) License.
By accessing the work you hereby accept the Terms. Non-commercial uses of the work are permitted
without any further permission from Dove Medical Press Limited, provided the work is properly
attributed. For permission for commercial use of this work, please see paragraphs 4.2 and 5 of our Terms.
© 2023 The Author(s). This work is published and licensed by Dove Medical Press Limited. The
full terms of this license are available at https://www.dovepress.com/terms
and incorporate the Creative Commons Attribution
- Non Commercial (unported, 3.0) License.
By accessing the work you hereby accept the Terms. Non-commercial uses of the work are permitted
without any further permission from Dove Medical Press Limited, provided the work is properly
attributed. For permission for commercial use of this work, please see paragraphs 4.2 and 5 of our Terms.