Back to Journals » Diabetes, Metabolic Syndrome and Obesity » Volume 8
The humanistic and economic burden associated with increasing body mass index in the EU5
Authors Gupta S, Richard L, Forsythe A
Received 28 February 2015
Accepted for publication 1 May 2015
Published 22 July 2015 Volume 2015:8 Pages 327—338
DOI https://doi.org/10.2147/DMSO.S83696
Checked for plagiarism Yes
Review by Single anonymous peer review
Peer reviewer comments 3
Editor who approved publication: Professor Ming-Hui Zou
Video abstract presented by S Gupta and A Forsythe
Views: 377
Shaloo Gupta,1 Lance Richard,2 Anna Forsythe3
1Kantar Health, Princeton, NJ, USA; 2Eisai Europe Ltd, Hatfield, UK; 3Eisai Inc., Woodcliff Lake, NJ, USA
Objectives: This study evaluated the association of body mass index (BMI) with health-related quality of life (HRQoL), health utilities, health care resource utilization, productivity, activity impairment, and the associated costs.
Methods: Results were from the 2013 EU5 (France, Germany, Italy, Spain, UK) National Health and Wellness Survey, a nationally representative, online survey of respondents aged ≥18 years. Analyses focused on normal weight (BMI ≥18.5 kg/m2 and BMI <25 kg/m2), overweight (BMI ≥25 kg/m2 and BMI <30 kg/m2), Obese Class (OC) I (BMI ≥30 kg/m2 and BMI <35 kg/m2), OC II (BMI ≥35 kg/m2 and BMI <40 kg/m2), and OC III (BMI <40 kg/m2) respondents. Outcomes included HRQoL (Short Form [SF]-36v2), health utilities (SF-six dimension [6D]), productivity loss (Work Productivity and Activity Impairment questionnaire), and resource utilization (provider visits, emergency room visits, and hospitalizations) in the past 6 months. Direct and indirect costs were estimated from the literature. Generalized linear regression models predicted outcomes as a function of BMI, adjusting for covariates (age, sex, comorbidities).
Results: Among 58,364 respondents, 46.9% were normal weight, 34.5% were overweight, 12.5% were OC I, 4.0% were OC II, and 2.1% were OC III. Metabolic comorbidities increased as BMI increased. After adjustments, all three OC respondents exhibited significantly lower HRQoL than normal weight respondents. Health utilities (normal weight: 0.720; overweight: 0.718; OC I: 0.703; OC II: 0.683; OC III: 0.662) declined with an increase in BMI (all P<0.05 vs normal). Among employed respondents (57.7%), overall work impairment increased as BMI increased. Normal (vs all OCs) had lower activity impairment and fewer provider visits, lower indirect costs (normal weight: €7,974; overweight: €7,825; OC I: €8,465; OC II: €9,394; OC III: €10,437), and lower total direct costs (normal weight: €516; overweight: €553; OC I: €583; OC II: €605; OC III: €717), all P<0.05.
Conclusion: Increased BMI was associated with worse HRQoL, greater comorbidities, higher direct and indirect costs, and worse health utilities. Weight management may improve patient outcomes.
Keywords: obesity, health-related quality of life, health utilities, metabolic comorbidities, Europe, direct and indirect costs
Introduction
Excess weight (obese or overweight status) is increasingly being recognized as one of the primary global health threats of the 21st century. The World Health Organization (WHO) has reported that over 50% of the European adult population is overweight, while a further 20% of the population is obese.1 Even greater numbers of individuals are overweight or obese in other developed countries, most notably the US.2 Excess body weight has been consistently associated with a range of negative physical and psychosocial outcomes. Obesity has been linked with increased risk of morbidity and mortality across a number of large-scale studies,3–5 including increased risk of two of the most common causes of death in the developed world, heart disease and cancer. Excess weight has also been estimated to result in an average of 6–8 years of shortened lifespan.6
It is estimated that 20% of all cancer cases can be attributed to obesity, independent of diet.7 The International Agency for Research on Cancer8 identified a compelling relationship between obesity and a number of cancers, including colon, kidney, and esophageal cancers for both sexes and endometrial and postmenopausal breast cancers for women. A more recent combined report of the World Cancer Research Fund and American Institute for Cancer Research9 confirmed these associations and added pancreatic cancer to the list for both sexes. In addition to increased cancer and cardiovascular risk, obese individuals also possess an increased risk of type II diabetes mellitus, asthma, gallbladder disease, osteoarthritis, and chronic back pain.1,10,11
Excess weight has also been associated with increased symptom burden in the general populous. Research has suggested an association between increasing body mass index (BMI) and greater pain,12–15 as well as joint-related disorders such as osteoarthritis.16 For example, in a large survey study of more than 1 million US residents, increasing BMI was consistently associated with higher self-reported pain, a finding that existed across sexes and age groups.17
In the psychosocial domain, obese individuals have been reported to possess poorer quality of life and an increased risk of certain psychiatric illnesses, most notably depression. A long-term study reported both overweight and obese respondents to have lower health-related quality of life (HRQoL) compared with individuals of a healthy weight.18 A recent meta-analysis by Luppino et al19 further detailed the relationship between obesity and depression and noted the potentially reciprocal nature of this association, with obesity increasing the risk of depression and depression being predictive of gaining significant weight.
Further, researchers have noted that a significant number of those evaluated for bariatric weight-loss surgery meet criteria for an Axis 1 disorder, most frequently depression, in addition to significant rates of personality disorders.20 While such individuals may not be representative of the general population, they nonetheless provide insight into the potential negative outcomes associated with obesity. Stigmatization and weight-based discrimination are also prominent factors that can impact the psychological well-being of obese individuals. Weight-bias or stigma is increasingly recognized as one such barrier to effective care in this population. Weight-bias is pervasive and has been described as the last socially acceptable form of discrimination.21
The costs associated with obesity, obesity-related disorders, and treatment are substantial and continue to grow in line with population weight-gain. A European-based review reported that obesity-related health care costs exceed €10 billion and that obesity is a substantial burden in the majority of the European countries.22 In Germany, obesity was a cause of over €5 million indirect costs, with 60% of cost being due to unpaid work time,23 while Sander and Bergemann estimated a total cost for obesity and related comorbidities to be nearly €6 million per year.24 Similar findings have been reported among other developed countries, most notably the US,25 reinforcing the need for a global response to address this epidemic.
Whereas empirical data support the effectiveness of treatment programs in promoting short-term weight-loss among participants (usually 5%–7% of initial body weight), sustainable weight-loss remains elusive, even within the most intensive programs.26 The majority of individuals will regain some or all of their lost weight over the course of 2 years. The medical community has been charged with enhancing treatment guidelines so that providers can better assist overweight and obese patients to achieve their weight-loss goals.27
Despite the epidemic of obesity currently unfolding throughout the developed world and its widespread burden on health care systems and individuals alike, limited research is available regarding the direct and indirect costs of obesity across different BMI classes in Europe. A recent 2011 review of the economic burden of adult obesity in Europe confirmed substantial costs associated with care and reported preliminary subgroup analyses (eg, higher costs among severe obese individuals of higher economic standing) that may help guide future research and policy development.28
The objectives of the current study were to evaluate the association of BMI with HRQoL, health utilities, health care resource utilization, productivity loss, activity impairment, and direct and indirect costs. This information, based on large-scale survey methodology, will provide critical insight into the potential broad and significant impact of obesity among the European population.
Methods
Sample
The current study includes data from the 2013 EU5 (France, Germany, Italy, Spain, UK) National Health and Wellness Survey (NHWS; N=62,000), a nationally representative, online survey of respondents aged ≥18 years. A random sample, stratified by sex and age, was taken to ensure that the demographic composition of the sample was identical to that of the corresponding adult population in each country as measured from the international database of the United States Census Bureau.
The survey sample was drawn from the general population using the Internet panel maintained by Lightspeed Research (Warren, NJ, USA), which includes members of the USA and EU5 countries who agreed to participate in survey research. Panel members complete in-depth demographic registration profiles that are used to randomly sample panel members for a survey in order to ensure a representative sample. To ensure a representative sample, particularly in the 65+-year-old population, online recruitment was supplemented by computer-assisted web interviews, where respondents were recruited on the telephone and had the choice to complete the interview on the phone or were emailed a link to the survey to complete on their own (France =430, Germany =840, Italy =864, Spain =667 [computer-assisted web interview was not performed in the UK]). Institutional review board (IRB) approval was granted by the Essex IRB (Lebanon, NJ, USA). All respondents took part voluntarily and provided informed consent.
This analysis profiles adult respondents by BMI category. The NHWS asked respondents their height and weight information, from which BMI was calculated. Respondents who did not provide weight information or were categorized as underweight were excluded from this study. The following weight categories were used: normal weight (BMI ≥18.5 kg/m2 to BMI <25 kg/m2), overweight (BMI ≥25 kg/m2 to BMI <30 kg/m2), Obese Class (OC) I (BMI ≥30 kg/m2 to BMI <35 kg/m2), OC II (BMI ≥35 kg/m2 to BMI <40 kg/m2) and OC III (BMI ≥40 kg/m2).29
Measures
Demographics
Survey respondents reported their country, age, sex, marital status, education level, annual household income, and employment status.
Health characteristics
BMI was calculated from self-reported height and weight (with an option to decline to provide their weight), and alcohol consumption, smoking status, and exercise behaviors were also assessed. Self-reported diagnosed comorbidity data were used to calculate an adjusted comorbidity burden score using the Charlson Comorbidity Index (CCI).30 The greater the total index score, the greater the comorbid burden on the respondent.
Comorbidities
A self-reported physician diagnosis (yes/no) of type II diabetes mellitus, hypertension, dyslipidemia, arthritis, and depression and/or anxiety was assessed. Information on regularly experiencing sleep apnea was also collected (“Do you experience sleep apnea [temporary absence of breathing] regularly?”).
HRQoL
HRQoL was assessed using the physical component summary (PCS) and mental component summary (MCS) scores from the Short Form (SF)-36v2 as well as the health utility measure (SF-six dimension [6D]). PCS and MCS scores are normed to the US population (M=50, SD =10), with higher scores indicating greater HRQoL.31 The health utility score is a preference-based single index measure for health using general population values.32 A difference greater than 3 in PCS or MCS was regarded as a minimally important difference (MID),33 and a difference greater than 0.041 on health utilities was identified as a MID.34
Work and activity impairment
The Work Productivity and Activity Impairment questionnaire, General Health version,35 consists of six items measuring absenteeism (the percentage of work time missed because of one’s health in the past 7 days), presenteeism (the percentage of impairment experienced while at work in the past 7 days because of one’s health), overall work productivity loss (an overall impairment estimate that is a combination of absenteeism and presenteeism), and activity impairment (the percentage of impairment in daily activities because of one’s health in the past 7 days). Only employed respondents provided data for the work-related items, but all respondents provided data for activity impairment. Scores can range from 0% to 100%, with higher scores representing greater impairment.
Health care utilization
Resource use was defined by the number of traditional health care provider (eg, general practitioner, internist, cardiologist, diabetologist) visits, the number of emergency room (ER) visits (“how many times have you been to the ER for your own medical condition in the past six months?”), and the number of times hospitalized (“how many times have you been hospitalized for your own medical condition in the past six months?”) in the past 6 months.
Direct costs
Total direct costs constituted of three components, including cost of traditional provider visits, cost of ER visits, and hospitalization cost. For each respondent, the number of each type of visit (in the past 6 months) was multiplied by 2 to project to annual number of visits and then multiplied by its average cost. The daily cost of a hospital stay was multiplied by 3, the median number of days for a hospital stay as found in the 2007 NHWS (the most recent NHWS survey that assessed the number of days per hospitalization). In the EU5, direct costs were estimated by multiplying each patient’s annualized health care use by the average cost of that service reported in the literature,36 and then adjusting for inflation using the Eurostat health-related Harmonized Consumer Price Index to 2013 values.
Indirect costs
Total indirect costs were estimated for each respondent using the human capital method. Wages were multiplied by the percentage of work productivity impairment and then annualized to provide an estimate of the projected annual costs associated with loss in productivity. The Work Productivity and Activity Impairment questionnaire, General Health version,35 was used to calculate the loss in productivity (ie, absenteeism and presenteeism). The median annual income (18 years or older) was obtained for each EU5 country from Eurostat 2012 annual net income figures.37 Hourly wages were estimated by dividing annual income by the typical number of weeks worked per year and hours worked per week. Data on weeks and hours worked in 2012 were obtained from the European Foundation for the Improvement of Living and Working Conditions.38 Also, indirect costs were estimated for all employable respondents by assuming 100% missed work for the unemployed NHWS respondents who were of age to be employable (18–60 years).
Statistical analyses
Differences across the BMI categories were analyzed on demographics, health characteristics, and comorbidities using chi-square tests and/or Cochran-Armitage test for trend for categorical variables and ANOVAs for continuous variables. To isolate the effect of BMI on health outcomes, multivariable regression analyses were performed to predict health status, productivity loss, resource utilization, and direct and indirect costs as a function of BMI category, controlling for age, sex, diagnosed hypertension, and diagnosed depression/anxiety, and experiencing sleep apnea regularly, and CCI scores. Given the normal distribution of the HRQoL metrics, multivariable linear regression modeling was performed. Because of the pronounced skew of the work productivity, activity impairment, resource utilization, and indirect and indirect cost (continuous measures) metrics, generalized linear regression modeling was performed, specifying a negative binomial distribution with a log link function, which provided a robust fit to the data. For all analyses, P<0.05 was considered statistically significant.
Results
Bivariate
Out of the 60,221 respondents who provided weight and height data (including underweight) in the 2013 EU5 NHWS, 33.4% were overweight and 18.1% were obese. Among 58,364 (France =14,190, Germany =14,324, Italy =9,471, Spain =6,762, and UK=13,617) respondents included in the study, 46.9% were of normal weight, 34.5% were overweight, 12.5% were of OC I, 4.0% were of OC II, and 2.1% were of OC III. OC III respondents were more likely to be female, single, of lower household income, unemployed, current smokers, and were likely not to exercise, compared with the other BMI category groups. OC III respondents also reported the highest level of comorbidity burden. Normal weight respondents were younger, college educated, currently employed, non-smokers, exercised, and had the lowest CCI score compared with all obese respondents (Table 1).
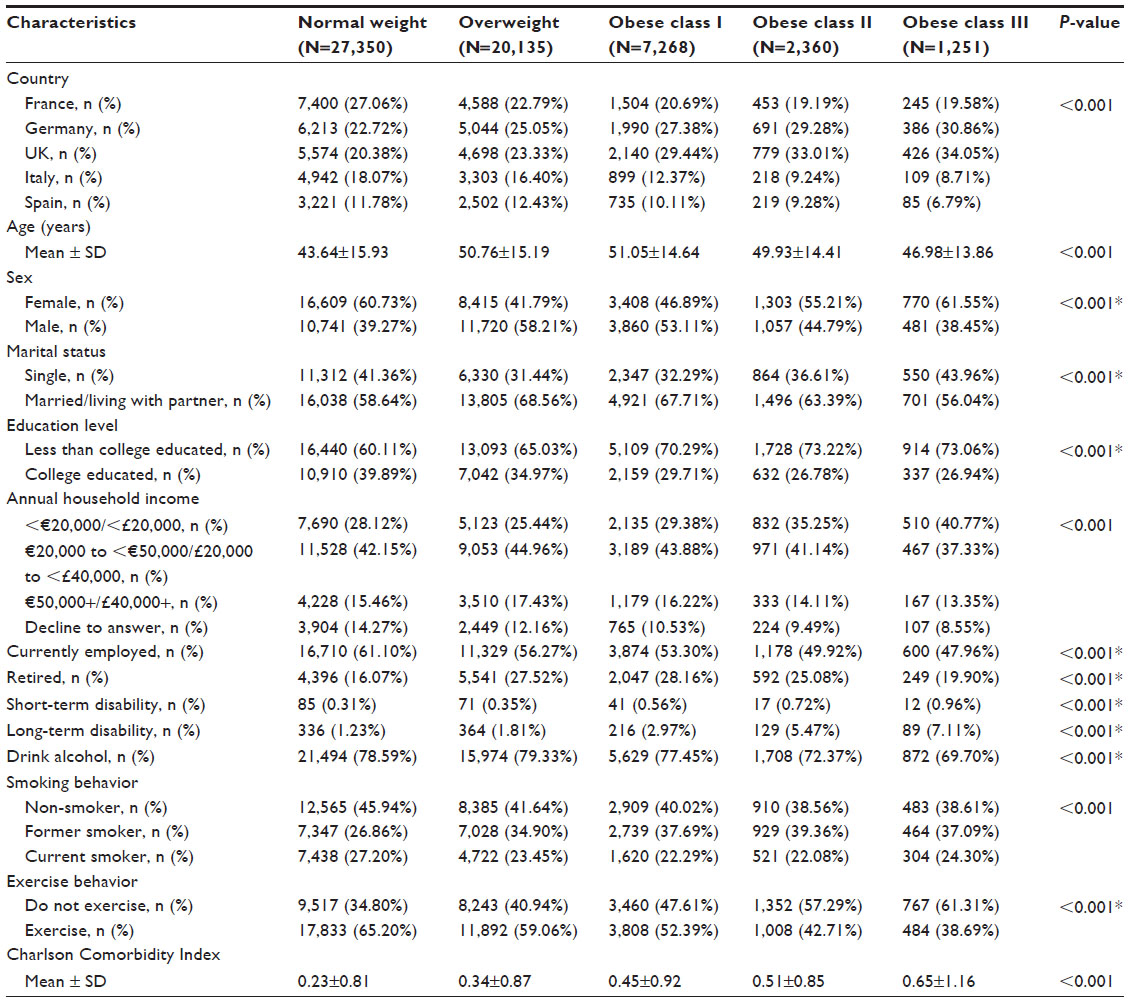 | Table 1 Respondent characteristics by BMI category |
In bivariate analyses, the proportion of diagnosed type II diabetes mellitus (normal weight: 2.1%; overweight: 6.8%; OC I: 12.9%; OC II: 18.3%; OC III: 21.2%), hypertension (normal weight: 10.0%; overweight: 22.8%; OC I: 32.6%; OC II: 40.8%; OC III: 45.1%), dyslipidemia (normal weight: 11.1%; overweight: 19.5%; OC I: 23.3%; OC II: 24.0%; OC III: 23.3%), and arthritis (normal weight: 7.4%; overweight: 11.2%; OC I: 15.8%; OC II: 19.0%; OC III: 20.1%) increased as BMI increased (all P<0.001). Also, diagnosed depression and/or anxiety and regularly experienced sleep apnea increased as BMI increased (Figure 1).
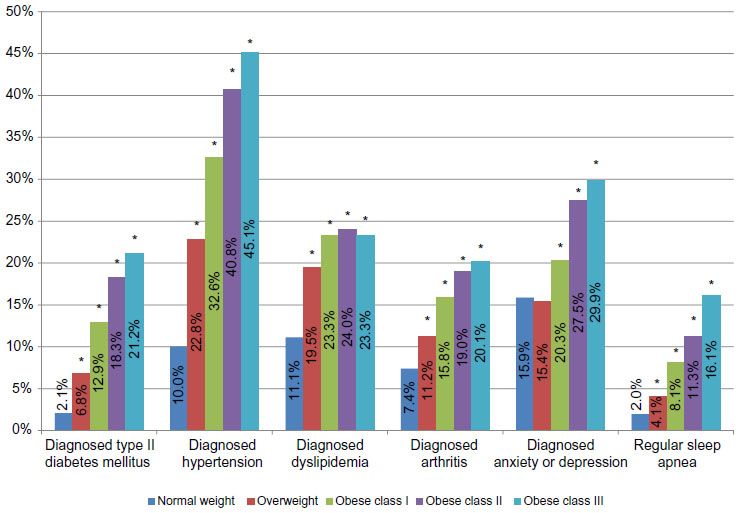 | Figure 1 Prevalence of comorbidities by BMI category. |
In bivariate analyses, MCS (normal weight: 45.9; overweight: 47.4; OC I: 46.3; OC II: 44.4; OC III: 42.8), PCS (normal weight: 52.9; overweight: 51.0; OC I: 48.4; OC II: 45.8; OC III: 42.5), and health utility scores declined with an increase in obesity class (all P<0.001). Among employed respondents, absenteeism, presenteeism, and overall work impairment increased as BMI increased (all P<0.001). Provider visits, ER visits, and hospitalizations also increased as BMI increased (Table 2).
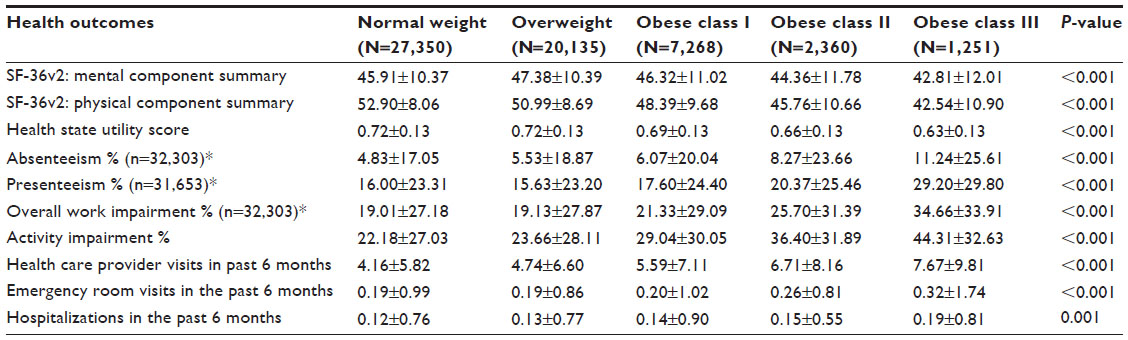 | Table 2 Health outcomes by different BMI categories in the EU5 |
Multivariable
After adjusting for covariates, OC II and OC III class respondents exhibited significantly lower MCS (normal weight: 46.2; overweight: 46.6; OC I: 46.4; OC II: 45.8; OC III: 45.3) scores compared with normal weight respondents, both P<0.05. All three OC respondents exhibited significantly lower PCS (normal weight: 52.2; overweight: 51.3; OC I: 49.5; OC II: 47.4; OC III: 44.6) and health utility (normal weight: 0.720; overweight: 0.718; OC I: 0.703; OC II: 0.683; OC III: 0.662) scores compared with normal weight respondents (all P<0.05 vs normal weight). Difference on PCS exceeds MID for OC II and III respondents compared with normal weight respondents. Also, difference on health utility scores exceeds MID for OC III compared with normal weight respondents (Figure 2).
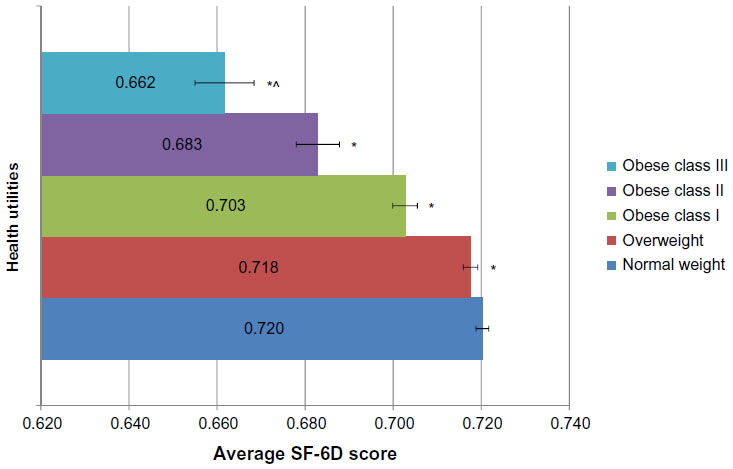 | Figure 2 Health utilities as a function of different BMI categories, controlling for covariates. |
After controlling for confounders, no difference was found between normal weight and OC I respondents on absenteeism (P=0.080), but absenteeism differences were significantly (P<0.05) lower for normal weight vs overweight, OC II, and class III respondents. Among the employed (57.7%), overall work impairment increased as BMI increased (P<0.001 for all OCs vs normal weight respondents). Activity impairment also increased as BMI increased, with normal weight (vs all OCs) respondents reporting significantly less activity impairment (Figure 3).
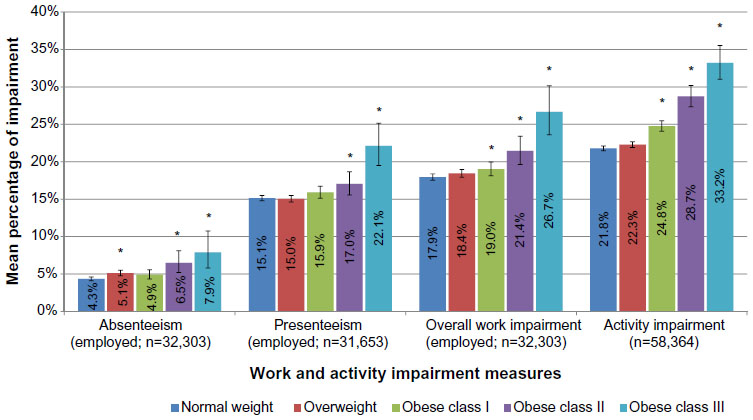 | Figure 3 Work and activity impairment as a function of different BMI categories, controlling for covariates. |
Normal weight respondents reported significantly fewer provider visits as compared with the three OC respondents (23.4% more visits for OC III vs normal weight). Normal weight respondents also reported significantly less ER visits compared with OC III respondents (39.4% more ER visits for OC III vs normal weight). No difference in the number of hospitalizations was found between normal weight respondents vs the three obese category respondents (Figure 4).
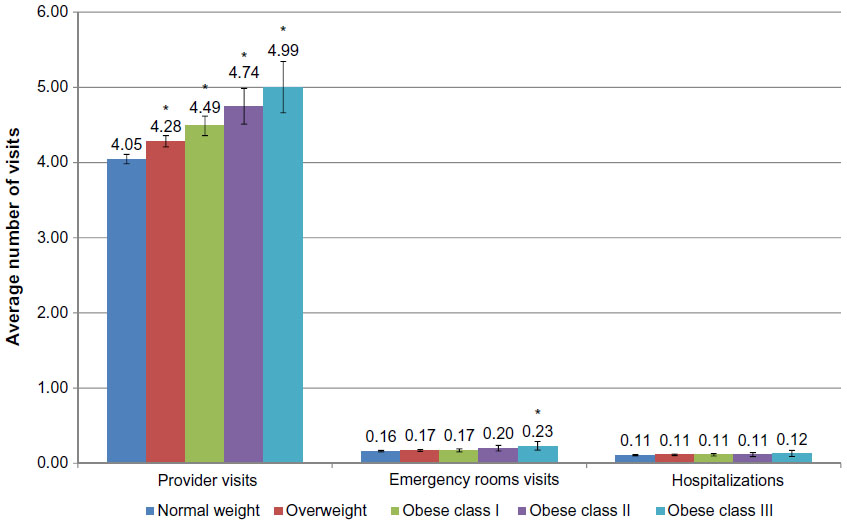 | Figure 4 Resource utilization as a function of different BMI categories, controlling for covariates. |
After adjustments, indirect costs increased as BMI increased. OC II and III respondents were found to have significantly greater absenteeism and presenteeism costs than normal weight respondents. Among the employed, all three OC respondents had significant higher indirect costs than normal weight respondents. Assuming 100% missed work for the unemployed respondents who were employable (18–60 years), an increase in BMI had a significant impact on indirect costs (Figure 5).
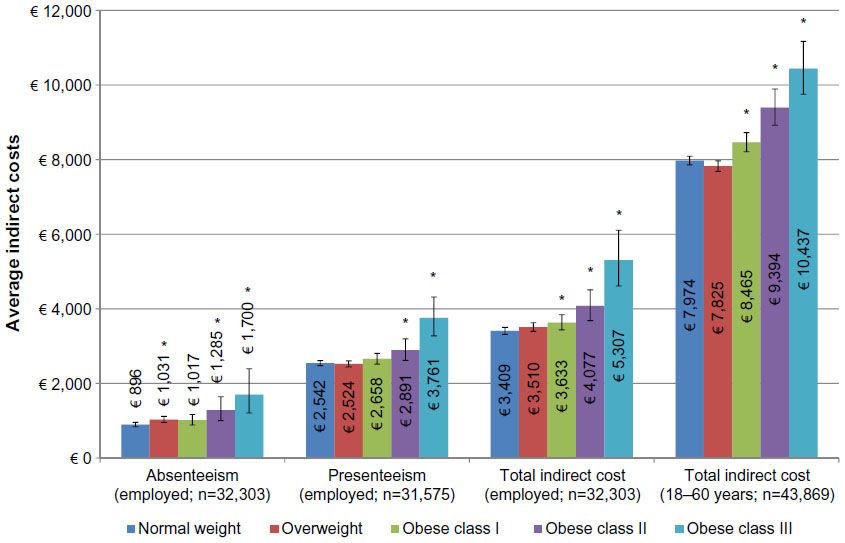 | Figure 5 Indirect costs as a function of different BMI categories, controlling for covariates. |
After adjusting for covariates, total direct costs due to provider visits, ER visits, and hospitalizations increased as BMI increased. Overweight and all three OC respondents had greater provider visit-related costs and total direct costs than normal weight respondents. OC II and III respondents were found to have significantly greater ER visit-related costs than normal weight respondents. No difference was found between normal weight and the hospitalization-related costs of the three OC respondents (Figure 6).
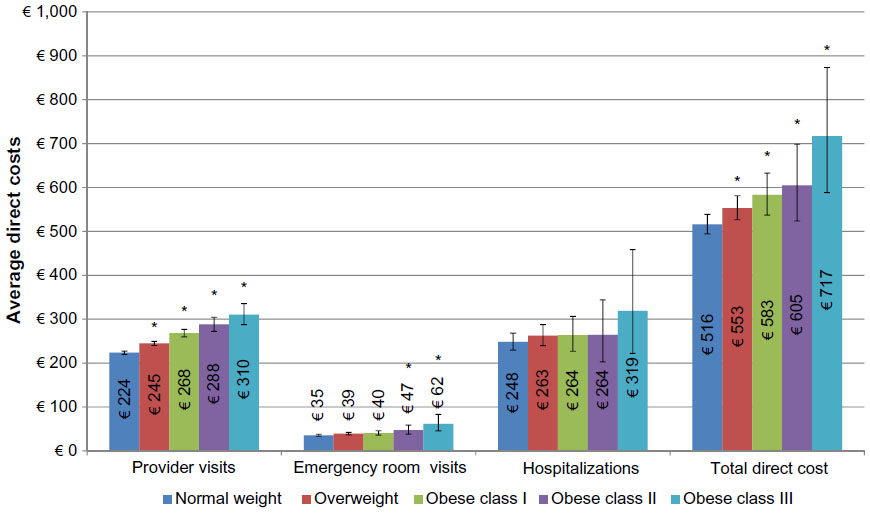 | Figure 6 Direct costs as a function of different BMI categories, controlling for covariates. |
Discussion
Obesity represents a global epidemic that imposes a tremendous burden on health care systems and afflicted individuals. This burden includes increased disease risk, impaired HRQoL, and substantial direct and indirect costs. The current study of 2013 participants found that over 50% of the European population was overweight, in line with estimates by the WHO1 and emphasizing the critical nature of this health threat. Overall, obesity was associated with consistently worse health outcomes across all obese weight classes when compared with normal weight respondents. Participants in heavier weight classes consistently reported greater impairments in HRQoL. Similarly, the prevalence of metabolic comorbidities and psychiatric illness (ie, depression) increased in line with increasing BMI. Most notably, over 45% of OC III respondents reported being diagnosed with hypertension and almost 30% reported being diagnosed with depression and/or anxiety, thus suggesting the significant and multifaceted burden of excess body weight.
The weight-based characteristics of participants in the current study were in line with previous research conducted in Europe, with obesity rates (OCs I, II and III combined) within the range reported for men and women in a European-based systematic review of prevalence rates.39 In a further study of older German adults, there were slightly greater rates of overweight and obese participants compared to the current study sample, possibly due to the older participant sample.40 Similar demographic characteristics and BMI rates were found among other European-based studies, with the majority of participants married, in their mid-50s and a relatively even sex distribution. Minor variations in BMI distribution exist, again possibly due to differences in recruitment age ranges.41,42 The consistent burden reported among overweight and obese individuals, including in this study, reinforces the need for broad far-reaching interventions to address this growing multifaceted health issue.
Similar associations between excess body weight and impaired HRQoL have been reported in studies within specific European countries, including Spain,43 Germany, and the UK. In Germany, a significant association was found between obesity and impaired physical HRQoL (but not mental HRQoL) among nearly 3,000 surveyed respondents,44 while Baumeister and Harter reported a significant association between increasing weight and risk of mental disorders using epidemiological databases.45 In a psychometric analysis of three HRQoL measures (European Quality of Life-5 Dimensions, European Quality of Life-visual analogue scale, SF-6D), researchers in the UK reported, consistent across all three measures, that excess weight was associated with impairment in HRQoL.46
In further UK-based research, Jagielski et al examined the association between weight, mental well-being, and HRQoL among 263 individuals with extreme obesity (BMI ≥40 kg/m2 or BMI ≥35 kg/m2 with weight-related comorbidities).47 The authors reported a significant negative association between increasing weight and impairments in multiple domains of HRQoL, as well as high rates of depression and anxiety. The current study makes an important contribution to this line of investigation through its analysis of multiple outcomes, in addition to HRQoL, among representative samples across five European countries.
Few studies have examined resource use and work productivity among obese individuals throughout Europe. In the current study, resource use and work-related productivity losses were significantly greater among obese participants compared with normal weight respondents in the EU5. In addition, obese respondents reported greater direct and indirect costs. Participants who were among the OC III and employed reported almost €2,000 more indirect costs and €200 more direct costs annually compared with normal weight respondents. A similar high degree of burden was reported in a German study with obese weight status associated with €5 million indirect costs.23 Increasing BMI was associated with significant impairments in health status and greater work and activity-related impairment, even after controlling for comorbid health conditions. It is therefore clear that obesity and excess weight have a substantial impact on the patient and the health care system at large.
These important findings highlight the impact of obesity on health outcomes and reinforce the need for the development and dissemination of effective weight-loss programs, enhanced medical management of obesity, and shifts in public policy regarding the modern food environment. Importantly, even modest weight-loss (approximately 5% of initial weight) has been associated with important improvements in metabolic health and is likely to also be associated with reduced work-related impairment and reduced costs to the health care system and society at large.
Strengths and limitations
The current study possesses many strengths, including providing important insight into the impact of obesity in Europe using standardized research methodology across a large representative sample of the EU5. Further, despite the multifaceted burden imposed by obesity, there exists a paucity of research pertaining to its specific impact on work productivity and health care resource use. The results reported here, coupled with important information on HRQoL and psychosocial well-being among the same representative sample, help to fill this critical gap in the literature.
However, it is important to note the limitations of this approach and to cautiously interpret some of the findings. Whereas Internet-based surveys are cost-effective and able to reach a large number of potential respondents, the results may not be generalizable to all obese adults in the EU5, as the Internet-based study design may have limited representation of some groups. For example, older respondents who were less comfortable with Internet-based surveys or those individuals who were ill or hospitalized during the survey period may be underrepresented in the current study. Further, the data collected were self-reported by respondents, and thus are vulnerable to recall bias and were not able to be independently verified (eg, patient’s height, weight, and diagnosis of comorbidities). Only three measures of resource use and two measures of work-related productivity loss were provided in this study, and they were assessed with respect to respondents’ health condition in general, such that precise reasons for resource use or work-related productivity loss are unknown. Future studies should examine a broader range of measures (eg, prescription use costs) as well as more specific measures sensitive to obesity and weight management.
Finally, the data reported are cross-sectional in nature and do not allow for causal inferences to be made. Further, whereas the BMI classification system possesses important utility in studying population health, it is not without its limitations.48 BMI can be biased when based on self-reported height and weight, with individuals traditionally overestimating their height and underestimating their weight. In addition, BMI classifications can be inaccurate for certain groups (eg, professional athletes or those possessing a high level of muscle mass).
Future research could consider alternative classifications of weight in addition to BMI. For example, the Edmonton Obesity Staging System was developed to provide a more nuanced approach to weight-based classification and greater clarity in clinical decision making.49 This system incorporates information on weight-related comorbidities, functional limitations, psychological well-being, and HRQoL to provide greater insight into the burden of excess weight. Evidence suggests that this system may be a better predictor of mortality risk than traditional measurements such as BMI.50 Further research is needed utilizing the Edmonton Obesity Staging System, and thus, incorporating this classification tool into large-scale population studies, such as the NHWS, is important.
Conclusion
Obesity represents a global epidemic and exerts a tremendous burden on population health. The current study contributes further evidence of the critical issue that excess weight represents in Europe and provides important insight into the burden this condition imposes on those afflicted, health care systems, and society at large. Weight management may help improve patient outcomes.
Acknowledgment
The authors would like to thank Errol J Philip for writing and editorial support.
Disclosure
SG is an employee of Kantar Health, which conducted NHWS and analyzed the data on behalf of, and with funding from, Eisai Inc., including funding for the manuscript publication. LR is an employee of Eisai Europe Ltd, and AF is an employee of Eisai Inc., which funded this study.
References
World Health Organization Regional Office for Europe. The Challenge of Obesity – Quick Statistics; 2014. Available from: http://www.euro.who.int/en/health-topics/noncommunicable-diseases/obesity/data-and-statistics. Accessed April 3, 2014. | |
Ogden CL, Carroll MD, Kit BK, Flegal KM. Prevalence of obesity in the United States, 2009–2010. NCHS Data Brief. 2012;82:1–8. | |
Calle EE, Rodriguez C, Walker-Thurmond K, Thun MJ. Overweight, obesity, and mortality from cancer in a prospectively studied cohort of US adults. N Engl J Med. 2003;348(17):1625–1638. | |
Berrington de Gonzalez A, Hartge P, Cerhan JR, et al. Body-mass index and mortality among 1.46 million white adults. N Engl J Med. 2010;363(23):2211–2219. | |
Guh DP, Zhang W, Bansback N, Amarsi Z, Birmingham CL, Anis AH. The incidence of co-morbidities related to obesity and overweight: a systematic review and meta-analysis. BMC Public Health. 2009;9:88. | |
Fontaine KR, Redden DT, Wang C, Westfall AO, Allison DB. Years of life lost due to obesity. JAMA. 2003;289(2):187–193. | |
Wolin KY, Carson K, Colditz GA. Obesity and cancer. Oncologist. 2010;15(6):556–565. | |
IARC. Weight control and physical activity. In: Vainio H, Bianchini F, editors. IARC Handbooks of Cancer Prevention. Lyon, France. International Agency for Research on Cancer; 2002:1–309. | |
World Cancer Research Fund/American Institute for Cancer Research. Food, Nutrition, Physical Activity, and the Prevention of Cancer: A Global Perspective. Washington, DC: AICR; 2007. | |
Centers for Disease Control and Prevention. Adult Obesity Facts; 2014. Available from: http://www.cdc.gov/obesity/data/adult.html. Accessed March 25, 2014. | |
Yumuk V, Fruhbeck G, Oppert JM, Woodward E, Toplak H. An EASO position statement on multidisciplinary obesity management in adults. Obes Facts. 2014;7(2):96–101. | |
Hitt HC, McMillen RC, Thornton-Neaves T, Koch K, Cosby AG. Comorbidity of obesity and pain in a general population: results from the Southern Pain Prevalence Study. J Pain. 2007;8(5):430–436. | |
Ray L, Lipton RB, Zimmerman ME, Katz MJ, Derby CA. Mechanisms of association between obesity and chronic pain in the elderly. Pain. 2011;152(1):53–59. | |
Urquhart DM, Berry P, Wluka AE, et al. 2011 Young Investigator Award winner: increased fat mass is associated with high levels of low back pain intensity and disability. Spine. 2011;36(16):1320–1325. | |
Wright LJ, Schur E, Noonan C, Ahumada S, Buchwald D, Afari N. Chronic pain, overweight, and obesity: findings from a community-based twin registry. J Pain. 2010;11(7):628–635. | |
Lementowski PW, Zelicof SB. Obesity and osteoarthritis. Am J Orthop (Belle Mead NJ). 2008;37(3):148–151. | |
Stone AA, Broderick JE. Obesity and pain are associated in the United States. Obesity (Silver Spring, Md). 2012;20(7):1491–1495. | |
de Hollander EL, Picavet HS, Milder IE, Verschuren WM, Bemelmans WJ, de Groot LC. The impact of long-term body mass index patterns on health-related quality of life: the Doetinchem Cohort Study. Am J Epidemiol. 2013;178(5):804–812. | |
Luppino FS, de Wit LM, Bouvy PF, et al. Overweight, obesity, and depression: a systematic review and meta-analysis of longitudinal studies. Arch Gen Psychiatry. 2010;67(3):220–229. | |
Sarwer DB, Wadden TA, Fabricatore AN. Psychosocial and behavioral aspects of bariatric surgery. Obes Res. 2005;13(4):639–648. | |
Falkner NH, French SA, Jeffery RW, Neumark-Sztainer D, Sherwood NE, Morton N. Mistreatment due to weight: prevalence and sources of perceived mistreatment in women and men. Obes Res. 1999;7(6):572–576. | |
Muller-Riemenschneider F, Reinhold T, Berghofer A, Willich SN. Health-economic burden of obesity in Europe. Eur J Epidemiol. 2008;23(8):499–509. | |
Konnopka A, Bodemann M, Konig HH. Health burden and costs of obesity and overweight in Germany. Eur J Health Econ. 2011;12(4):345–352. | |
Sander B, Bergemann R. Economic burden of obesity and its complications in Germany. Eur J Health Econ. 2003;4(4):248–253. | |
Cawley J, Meyerhoefer C. The medical care costs of obesity: an instrumental variables approach. J Health Econ. 2012;31(1):219–230. | |
Sarwer DB, von Sydow Green A, Vetter ML, Wadden TA. Behavior therapy for obesity: where are we now? Curr Opin Endocrinol Diabetes Obes. 2009;16(5):347–352. | |
Boylan S, Louie JC, Gill TP. Consumer response to healthy eating, physical activity and weight-related recommendations: a systematic review. Obes Rev. 2012;13(7):606–617. | |
von Lengerke T, Krauth C. Economic costs of adult obesity: a review of recent European studies with a focus on subgroup-specific costs. Maturitas. 2011;69(3):220–229. | |
World Health Organization. BMI Classification; 2015. Available from: http://www.who.int/bmi/index.jsp?introPage=intro_3.html. Accessed April 16, 2015. | |
Charlson ME, Pompei P, Ales KL, MacKenzie CR. A new method of classifying prognostic comorbidity in longitudinal studies: development and validation. J Chronic Dis. 1987;40(5):373–383. | |
Ware JE Jr, Sherbourne CD. The MOS 36-item short-form health survey (SF-36). I Conceptual framework and item selection. Med Care. 1992;30(6):473–483. | |
Brazier J, Roberts J, Deverill M. The estimation of a preference-based measure of health from the SF-36. J Health Econ. 2002;21(2):271–292. | |
Maruish ME. User’s Manual for the SF-36v2 Health Survey. 3rd ed. Lincoln, RI: QualityMetric Incorporated; 2011. | |
Walters SJ, Brazier JE. Comparison of the minimally important difference for two health state utility measures: EQ-5D and SF-6D. Qual Life Res. 2005;14(6):1523–1532. | |
Reilly MC, Zbrozek AS, Dukes EM. The validity and reproducibility of a work productivity and activity impairment instrument. Pharmacoeconomics. 1993;4(5):353–365. | |
Williams AE, Lloyd AC, Watson L, Rabe KF. Cost of scheduled and unscheduled asthma management in seven European Union countries. Eur Respir Rev. 2006;15(98):4–9. | |
Eurostat. Mean and Median Income by Age and Sex; 2013. Available from: http://epp.eurostat.ec.europa.eu/portal/page/portal/product_details/dataset?p_product_code=ILC_DI03. Accessed July 29, 2014. | |
Cabrita J, Galli da Bino C. Developments in Collectively Agreed Working Time 2012. Dublin, Ireland: Eurofound; 2013. | |
Berghofer A, Pischon T, Reinhold T, Apovian CM, Sharma AM, Willich SN. Obesity prevalence from a European perspective: a systematic review. BMC Public Health. 2008;8:200. | |
König HH, Lehnert T, Brenner H, et al. Health service use and costs associated with excess weight in older adults in Germany. Age Ageing. Epub 2015 Mar 31. | |
Martinez JA, Kearney JM, Kafatos A, Paquet S, Martinez-Gonzalez MA. Variables independently associated with self-reported obesity in the European Union. Public Health Nutr. 1999;2(1A):125–133. | |
Gallus S, Odone A, Lugo A, et al. Overweight and obesity prevalence and determinants in Italy: an update to 2010. Eur J Nutr. 2013;52(2):677–685. | |
Oliva-Moreno J, Gil-Lacruz A. Body weight and health-related quality of life in Catalonia, Spain. Eur J Health Econ. 2013;14(1):95–105. | |
Wiczinski E, Doring A, John J, von Lengerke T. Obesity and health-related quality of life: does social support moderate existing associations? Br J Health Psychol. 2009;14(pt 4):717–734. | |
Baumeister H, Harter M. Mental disorders in patients with obesity in comparison with healthy probands. Int J Obes (Lond). 2007;31(7):1155–1164. | |
Sach TH, Barton GR, Doherty M, Muir KR, Jenkinson C, Avery AJ. The relationship between body mass index and health-related quality of life: comparing the EQ-5D, EuroQol VAS and SF-6D. Int J Obes (Lond). 2007;31(1):189–196. | |
Jagielski AC, Brown A, Hosseini-Araghi M, Thomas GN, Taheri S. The association between adiposity, mental well-being, and quality of life in extreme obesity. PLoS One. 2014;9(3):e92859. | |
Connor Gorber S, Tremblay M, Moher D, Gorber B. A comparison of direct vs self-report measures for assessing height, weight and body mass index: a systematic review. Obes Rev. 2007;8(4):307–326. | |
Sharma AM, Kushner RF. A proposed clinical staging system for obesity. Int J Obes (Lond). 2009;33(3):289–295. | |
Padwal RS, Pajewski NM, Allison DB, Sharma AM. Using the Edmonton obesity staging system to predict mortality in a population-representative cohort of people with overweight and obesity. CMAJ. 2011;183(14):E1059–E1066. |
 © 2015 The Author(s). This work is published and licensed by Dove Medical Press Limited. The
full terms of this license are available at https://www.dovepress.com/terms
and incorporate the Creative Commons Attribution
- Non Commercial (unported, 3.0) License.
By accessing the work you hereby accept the Terms. Non-commercial uses of the work are permitted
without any further permission from Dove Medical Press Limited, provided the work is properly
attributed. For permission for commercial use of this work, please see paragraphs 4.2 and 5 of our Terms.
© 2015 The Author(s). This work is published and licensed by Dove Medical Press Limited. The
full terms of this license are available at https://www.dovepress.com/terms
and incorporate the Creative Commons Attribution
- Non Commercial (unported, 3.0) License.
By accessing the work you hereby accept the Terms. Non-commercial uses of the work are permitted
without any further permission from Dove Medical Press Limited, provided the work is properly
attributed. For permission for commercial use of this work, please see paragraphs 4.2 and 5 of our Terms.