Back to Journals » Clinical, Cosmetic and Investigational Dermatology » Volume 16
The Growing Market for Natural Cosmetics in Poland: Consumer Preferences and Industry Trends
Authors Ratajczak P ![]() , Landowska W, Kopciuch D, Paczkowska A
, Landowska W, Kopciuch D, Paczkowska A ![]() , Zaprutko T, Kus K
, Zaprutko T, Kus K
Received 4 March 2023
Accepted for publication 8 July 2023
Published 21 July 2023 Volume 2023:16 Pages 1877—1892
DOI https://doi.org/10.2147/CCID.S411032
Checked for plagiarism Yes
Review by Single anonymous peer review
Peer reviewer comments 3
Editor who approved publication: Dr Jeffrey Weinberg
Piotr Ratajczak, Weronika Landowska, Dorota Kopciuch, Anna Paczkowska, Tomasz Zaprutko, Krzysztof Kus
Department of Pharmacoeconomics and Social Pharmacy, Poznan University of Medical Sciences, Poznan, Poland
Correspondence: Piotr Ratajczak, Department of Pharmacoeconomics and Social Pharmacy, Poznan University of Medical Sciences, Rokietnicka 7 Str, Poznan, 60-806, Poland, Email [email protected]
Introduction: The cosmetics industry is one of the most dynamically developing sectors globally, and Europe has the largest share of that market. In Poland, the cosmetics industry is one of the most significant economic segments. Currently, natural cosmetics remain a strongly developing sector of the cosmetics industry. The increasing self-awareness of consumers and the omnipresent trend of being “eco” influence the increased interest in natural cosmetics. The development of the natural cosmetics market is confirmed by the increasing production and growing willingness of consumers to purchase this type of product.
Purpose: The study analysed the purchase frequency and the type of cosmetic products consumers choose. The most recognised natural cosmetics brands and certificates confirming their naturalness were also analysed. Additionally, the purchase preferences of consumers choosing natural cosmetics and those not in this category were examined. The focus was on factors affecting the choice of different cosmetic products.
Methods: The study was conducted as an anonymous survey of 24 questions (19 single-choice and five multiple-choice questions). Volunteers participated in the study regardless of gender, age, occupation, or income. The survey questionnaires were conducted using Google Forms through a shared link. The study was carried out from October 12, 2021, to January 6, 2022. A total of 807 surveys were collected, and the analysis included 807 completed forms that met the criteria for proper completion. The statistical analysis was performed based on the Pearson Chi2 coefficient with a significance level of p< 0.05.
Results: The results obtained in the study indicate that the natural cosmetics market is intensively developing, mainly because of consumers’ increasing self-awareness and deepening knowledge of cosmetics. Moreover, the demand for natural cosmetics in Poland will continue to develop steadily in the coming years. Currently, the quality of a cosmetic is more important to consumers than its price. Internet sales channels are developing intensively, and Influencers and recommendations of products by friends and family are the most effective way of promotion.
Conclusion: Significant changes in consumer attitudes toward the cosmetics market (after the COVID-19 pandemic outbreak) have been observed. From the manufacturers’ perspective, it is advised to closely follow market trends and adapt to consumers’ changing preferences and requirements. An adequate solution is to popularise and develop the segment of natural cosmetics using various forms of promotion and distribution of products. Further research is recommended to confirm the results regarding the significance of the fast-growing natural cosmetics market in Poland and other countries.
Keywords: natural cosmetics, cosmetics market, Poland cosmetics market, European Union cosmetics market
Introduction
The market for natural cosmetics is becoming increasingly popular. Consumers are paying more attention to conscious care and meeting their own needs. Digitalisation has led to more people becoming aware consumers. Additionally, society’s concern for the environment is causing a trend towards getting closer to nature and increasing interest in this category of cosmetics. Attention is drawn to excessive plastic and microplastics, so changes also affect cosmetics packaging. Natural cosmetics are no longer a niche market. The most prominent cosmetic companies have introduced their products in the last few years. Caring for the natural environment, animal welfare, safety, and users’ health is important. Natural beauty is currently trendy. Consumers are also paying attention to the ingredients of cosmetics, so the more transparent the ingredients, the more attractive the product is to the customer. The “return to nature” trend has also been strengthened by the COVID-19 pandemic, which drew attention to health and ecological values. The answer to these consumer needs can be found in natural and vegan cosmetics. Hence, we observe a continuous development of the natural cosmetics market in Poland and Europe.1
The Covid pandemic has significantly affected the cosmetics market, particularly in sales, exports, and production. In 2020, sales in Europe decreased by 5% compared to the previous year.2 However, the declines varied in different areas, with colour cosmetics being the most affected. In Europe, there was a decrease of 20%, while in Poland, it was 12% compared to the previous year.2 Luxury fragrances also experienced a high decline in sales, with a 14% decrease in Europe and a 16% decrease in Poland.2 Skin and hair care products also experienced a decrease in sales, but not as high as colour cosmetics, with a 5% and 4% decrease in Poland, respectively.2 The only market segment that experienced growth was toiletries, with a 9% increase in Europe and a 6% increase in Poland.2
The pandemic period has increased consumer awareness of hygiene and health. Many cosmetic companies quickly noticed the new needs in the market and changed their production, mainly medium and large companies that increased the production of hand hygiene cosmetics (including alcohol-based liquids and gels) and disinfectants classified as biocidal products and medical devices.3 However, this production change did not last long due to a shortage of raw materials, particularly ethyl alcohol. Overall cosmetic production in Europe decreased by 13% in 2020 compared to 2019.2 The decline did not affect the Polish cosmetics market, which slightly increased thanks to strong exports.2 However, companies had to deal with many problems, including border closures, suspended tourism, and product delivery and transportation restrictions.3 The most significant challenges for producers were disruptions in supply and shortages of raw materials and packaging. Companies focused on maintaining and increasing exports and developing new sales channels by investing in e-commerce.3
The study aimed to answer the experimental key questions (KQ) related to the natural cosmetic products and market:
- KQ1: What is the frequency of purchase and the type of cosmetic products consumers choose?
- KQ2: What is the level of customer knowledge about natural cosmetic brands and certificates?
- KQ3: What type of purchasing preferences regarding natural cosmetics do consumers have, and what factors influence their choice?
The current work aims to characterise the natural cosmetics market, which has undergone significant changes during the COVID-19 pandemic, particularly regarding availability (sales channels) and customer interest. It can serve as a source of knowledge for producers as well as policymakers responsible for the legal regulations of this market.
Material and Methods
Objectives
The study’s objectives were presented as key questions (KQ) in the introduction section of the manuscript. Each of the figures presented in the paper corresponds to a specific question.
KQ1 – Figures 1, 5, 11 and 12
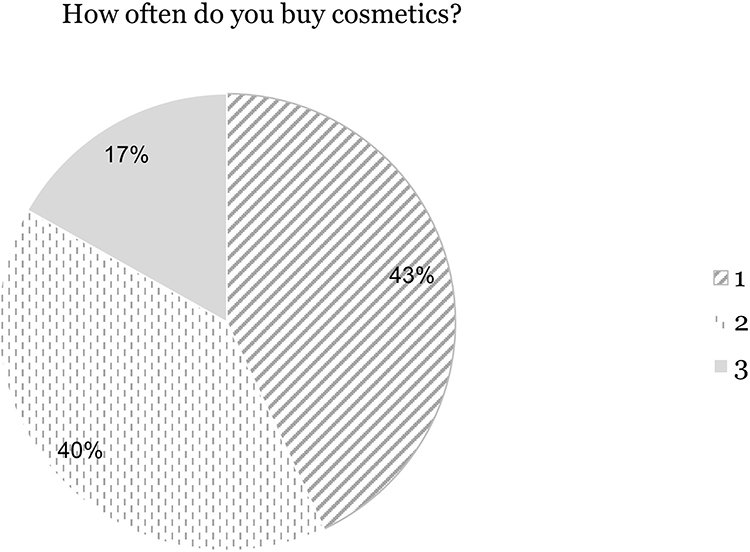 |
Figure 1 Evaluation of the frequency of purchasing cosmetic products. Notes: 1 – Several Times a month; 2 – Once a month; 3 – Several Times a year. |
KQ3 – Figures 2, 3, 4, 6, 8, 9 and 10
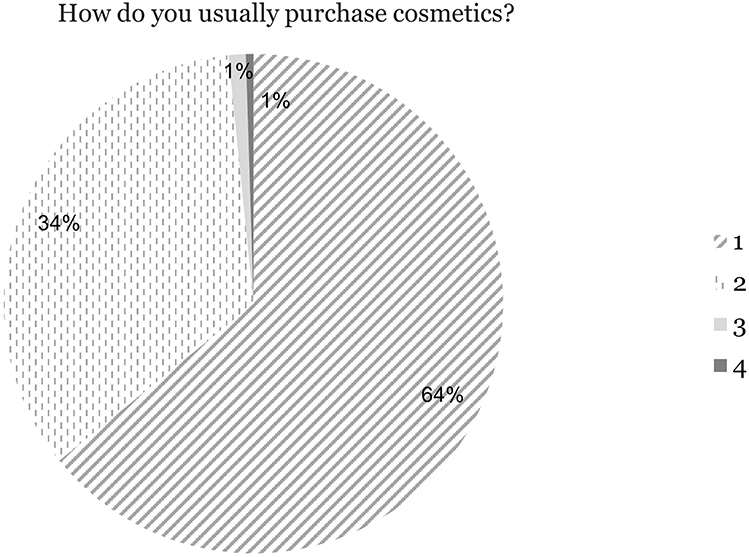 |
Figure 2 Survey on the popularity of cosmetic distribution channels. Notes: 1 – In a drugstore; 2 – Online; 3 – From beauty consultants; 4 – At a pharmacy. |
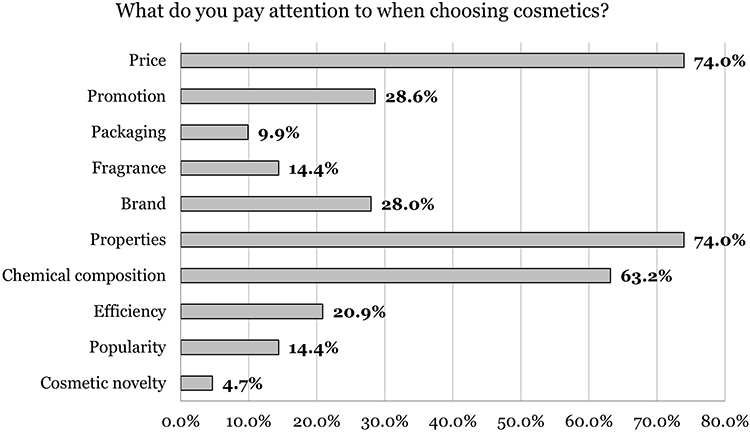 |
Figure 3 Analysis of factors influencing the purchase of cosmetics. |
 |
Figure 4 Factors influencing consumers to purchase cosmetics. Notes: 1 – Advertisements; 2 – Brochures and flyers; 3 – Recommendations from friends/family; 4 – Influencers; 5 - Other. |
Study Design
The authors developed a survey regarding the broadly defined cosmetics market (including natural cosmetics), which included questions related to shopping preferences and factors consumers pay attention to when choosing cosmetic products. Familiarity with natural cosmetics brands and certifications, as well as consumer purchasing declarations, were also analysed. In this publication, we present only selected results.
Sampling and Survey Distribution
The minimal sample size of 385 participants for the Poland population was calculated using Raosoft Calculator (margin of error 5%, confidence level 95%, population size 39 000000, response distribution 50%).4 The survey was conducted from October 12, 2021, to January 6, 2022. A total of 807 surveys were collected, and 807 questionnaires meeting the criteria for correct completion were included in the analysis.
Research Tool
The survey was an anonymous questionnaire consisting of 24 questions (19 single-choice questions and five multiple-choice questions, as well as 1 question with a variant allowing the respondent to add their answer). Volunteers participated in the study regardless of gender, age, profession, or income. The survey was conducted via a shared link via the “Google Forms” Internet platform.
Ethical Approval
The survey obtained approval from the Bioethics Commission of the Poznan University of Medical Sciences on June 9, 2021. All survey participants provided informed consent.
Statistical Analysis
The research results were subjected to statistical analysis using Pearson’s Chi2 test for independent data. TIBCO Statistica 13.3 software was used for the analysis. A statistically significant value of the Pearson Chi2 coefficient was considered to be p<0.05. Responses with a minimum of 11 (n>10) were analysed.
Results
Study Group
The characteristics of the study group were based on a metric included at the beginning of the survey. 807 respondents provided answers. All results obtained in this way are presented in Table 1.
 |
Table 1 Characteristics of the Respondents |
Main Results
In the question “How often do you buy cosmetics?” (Figure 1), the largest group of respondents (43%) answered “Several times a month”, slightly fewer, 40.1% of people chose the answer “Once a month”. The fewest people (16.9%) answered “Several times a year”. The statistical analysis showed that regardless of income, respondents most often make cosmetic purchases once or several times a month (p=0.00005) (Table 1).
In the question “How do you usually purchase cosmetics?” (Figure 2), the vast majority of respondents answered, “In a drugstore” (64.2%), followed by “Online” (34.2%). Two answers received low scores: “From beauty consultants” (1.1%) and “At a pharmacy” (0.5%). Statistical analysis showed a correlation between the age of the respondents and the channel of cosmetics purchasing (p=0.00000). Respondents aged 18–25 most commonly make purchases in a drugstore. Significance was also shown by comparing the purchasing location to the income earned by the respondents (p=0.00001) (Table 1). Non-working individuals and those earning 2000–3000 PLN (~427-641 EUR) most commonly purchase cosmetics at drugstores.
In the question “What do you pay attention to when choosing cosmetics?” (Figure 3), the answers “Price” and “Properties” were equally popular, with a result of 74% (597 responses). The next most popular answer was “Chemical composition” (63.2%, 510 responses). The following answers were in descending order: “Promotion” (28.6%, 231 responses), “Brand” (28%, 226 responses), and “Efficiency” (20.9%, 169 responses). 14.4% of people gave answers “Fragrance” and “Popularity” (116 responses). The lowest result was obtained by the answers “Packaging” (9.9%, 80 responses) and “Cosmetic novelty” (4.7%, 38 responses).
In the question “What most often encourages you to buy specific cosmetics?” (Figure 4), the answer most frequently chosen was “Recommendations from friends/family” (38%), followed by “Other” (35.6%). The answer “Influencers” obtained a result of 16.7%, while “Advertisements (on TV or the Internet)” obtained 5.3% and “Brochures and flyers” 4.3%. Statistical significance (p=0.00007) was shown between the age of respondents (Table 1) and the factor that encourages them to make a purchase. People aged 18–25 are particularly susceptible to suggestions from friends/family and influencers. It was shown that recommendations from friends/family, brochures and flyers are particularly effective in drugstores (Figure 2) (p=0.01820).
In the question “Do you buy natural cosmetics?” (Figure 5), 77.6% of respondents answered “Yes” and 22.4% indicated “No”. Statistical analysis showed that regardless of age (Table 1), respondents buy natural cosmetics (p=0.00379).
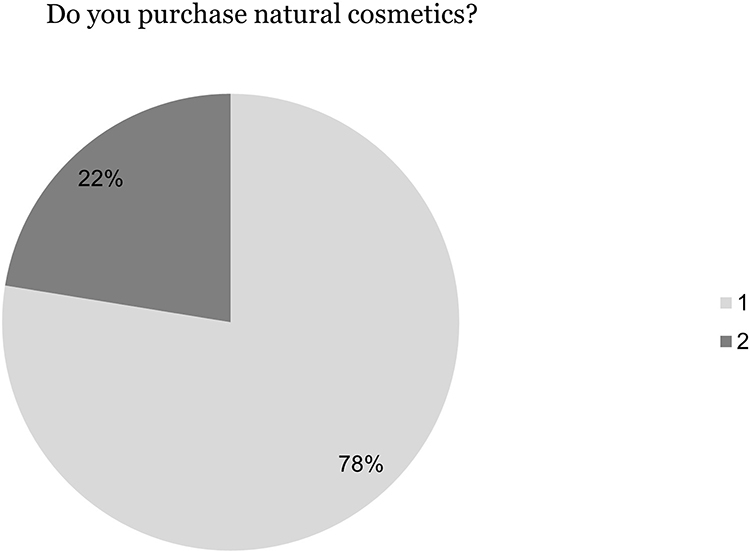 |
Figure 5 Popularity of purchasing natural cosmetics. Notes: 1 – yes; 2 – No. |
The next question, “What is the main reason why you choose natural cosmetics?” (Figure 6) was only available for respondents who indicated that they buy natural cosmetics in the previous question (Figure 5). The majority of respondents answered, “They contain fewer chemical substances” (32.4%). 21.9% of respondents answered, “They do not cause skin irritation and allergies”, 21.1% “They are effective” and 19.8% “They are environmentally friendly”. 4.8% of respondents gave their answers. Among these answers, respondents most often indicated that there is no specific reason for choosing natural cosmetics, they often do it out of curiosity. The responses also included issues such as natural cosmetics being associated with being “eco”, “vegan”, caring for the environment, and not testing cosmetics on animals. Respondents also indicated their personal preferences, such as the absence of silicones, parabens, fewer irritating substances, a milder scent, and plant oils. The better composition of natural cosmetics and the detailed descriptions of the action of active substances that are placed on the packaging were also mentioned. There was also a response that natural cosmetics are chosen due to the respondent’s atopic dermatitis.
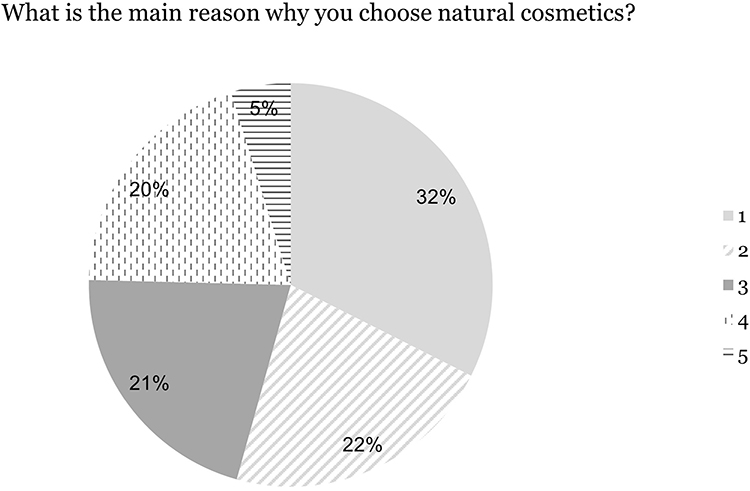 |
Figure 6 Factors influencing the purchase of natural cosmetics. Notes: 1 - They contain fewer chemical substances; 2 - They do not cause skin irritation and allergies; 3 - They are effective; 4 - They are environmentally friendly; 5 – Other. |
The question “Which of the presented natural cosmetics brands do you know?” (Figure 7) was another dependent question displayed only to respondents using natural cosmetics (Figure 5). Most respondents (93.5%) indicated “Bielenda” (585 answers). The next most frequently chosen brands were “OnlyBio” (82.1%, 514 answers) and “Nacomi” (77.8%, 487 answers). The next answer, “Vianek” scored 71.9% (450 answers). Further down the list were the brands “Yope” (62.9%, 394 answers), “Sylveco” (52.4%, 328 answers), “Resibo” (49.5%, 310 answers), “Ecolab” (47.1%, 295 answers), “Make Me Bio” (43.8%, 274 answers), and Mokosh (39.1%, 245 answers). The lowest scores were obtained by two answers, “Hagi” (22.2%, 139 answers) and “Iossi” (16.3%, 102 answers).
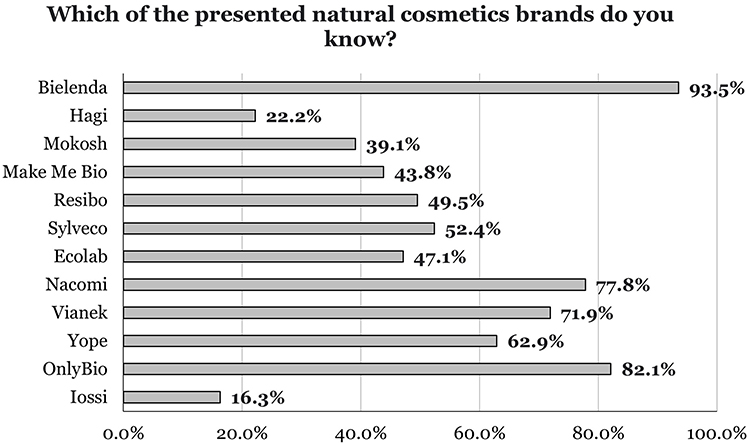 |
Figure 7 Familiarity with selected natural cosmetic brands. |
In the question “Which of the following aspects do you pay particular attention to when choosing cosmetics?” (Figure 8), the highest number of respondents chose the answer “Product not tested on animals” (54.6%, 441 answers). The second most popular answer was “No SLS” (39.8%, 321 answers). Next, three answers received similar results: “Hypoallergenic product” (31.8%, 257 answers), “Environmentally friendly packaging” (30.9%, 249 answers), and “Natural/organic cosmetic certification” (29.9%, 241 answers). The less frequently chosen answers were “Vegan product” (18.1%, 146 answers) and “None of the above” (17.5%, 141 answers). The answer that received the fewest votes was “No GMOs” (10.4%, 84 answers).
 |
Figure 8 Significance of individual certificates and labels present on cosmetics. |
In the question “Are you willing to pay more for a natural cosmetic product?” (Figure 9), a majority of respondents answered “Yes” (61.3%). 38.7% of respondents answered “No”. Statistical analysis (p=0.00000) showed that people who purchase natural cosmetics (Figure 5) are willing to pay more. Similarly, those who do not purchase natural cosmetics are more likely to declare that they are unwilling to pay more for a natural cosmetic product.
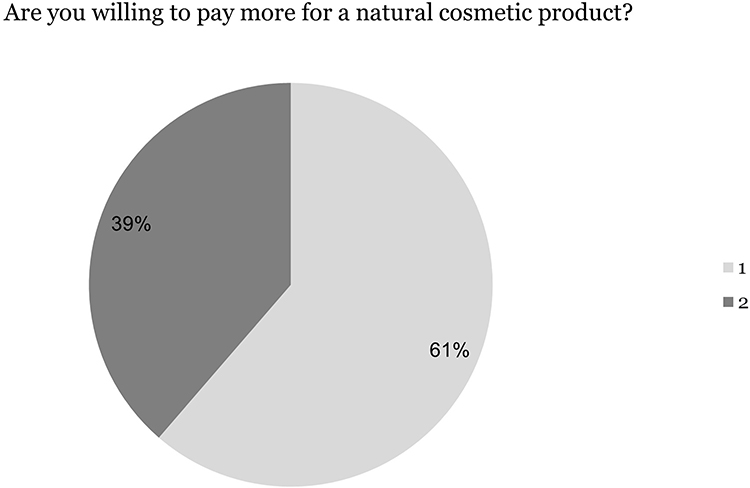 |
Figure 9 Consumer willingness to pay a higher price for natural cosmetics study. Notes: 1 – Yes; 2 – No. |
In the question “Are you willing to pay more for a cosmetic product that is not tested on animals?” (Figure 10), 69.4% of respondents answered “Yes”. Meanwhile, 30.6% of those surveyed answered “No”.
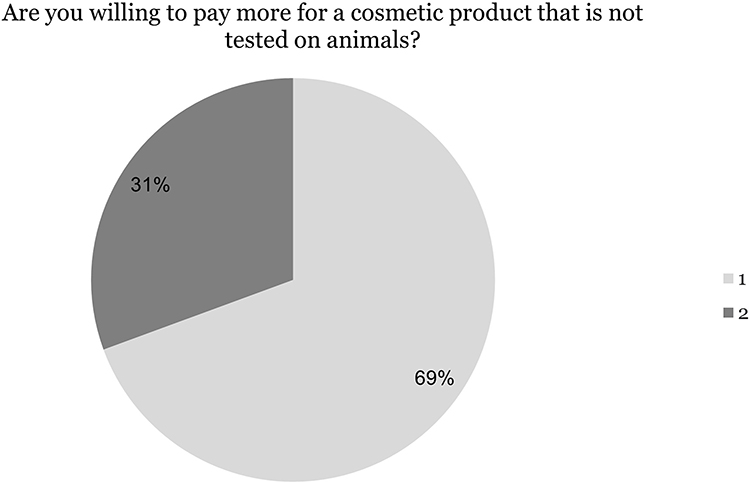 |
Figure 10 Investigation into consumers’ willingness to pay a higher price for cosmetics not tested on animals. Notes: 1 – Yes; 2 – No. |
Similar percentages of responses were obtained in the question “Do you buy cosmetics from local small businesses?” (Figure 11). Slightly more respondents chose the answer “I do not know” (38.9%). 34.9% of respondents chose “No” and 26.1% chose “Yes”. Statistical analysis showed a significant relationship between the age of respondents (Table 1) and the purchase of local cosmetics (p=0.00000). People aged 26–35 most often buy cosmetics from small and local businesses. On the other hand, people aged 18–25 are least likely to do so. The size of the place of residence is also statistically significant (Table 1) (p=0.00028). Residents of the largest cities most often reach for such products, while residents of rural areas are most often unaware of this. Income is also significant (Table 1) (p=0.00001), with non-working individuals not buying or being aware of purchasing products from a local company.
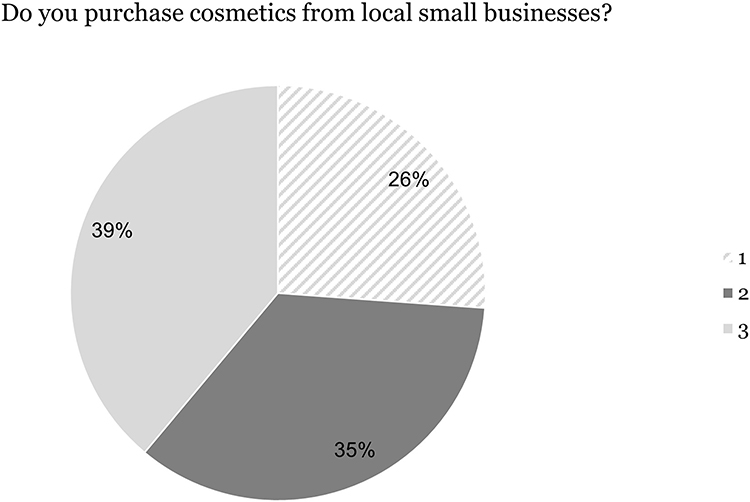 |
Figure 11 Popularity of cosmetics produced by small and local companies. Notes: 1 – Yes; 2 – No; 3 – I do not know. |
In the question “Do you make DIY cosmetics?” (Figure 12), the vast majority of respondents answered “No” (80.3%). 19.7% of respondents answered “Yes”.
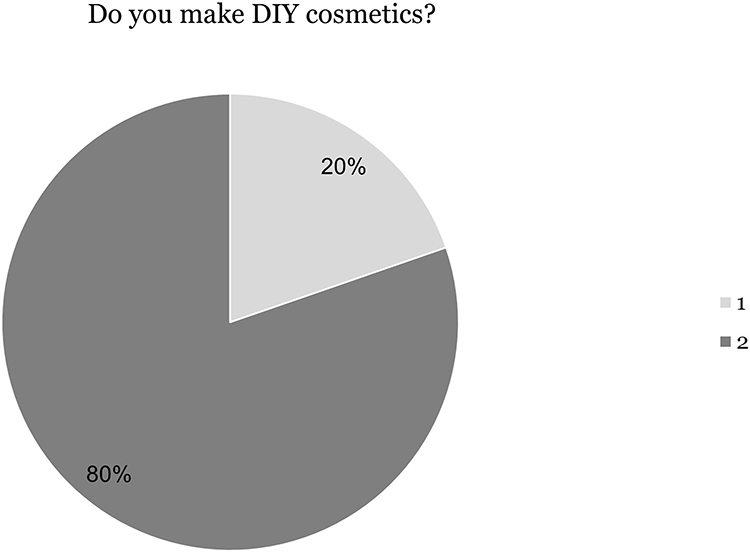 |
Figure 12 Popularity of making DIY cosmetics. Notes: 1 – Yes; 2 – No. |
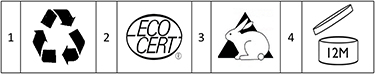
In the question “Which of these symbols is a natural cosmetics certificate?” (Figure 13), the vast majority of respondents gave the correct answer, which was located under number “2” (85.3%) (Symbol: ECOCERT natural certificate). Incorrect answers were given by 14.7% of people, including 6.8% of respondents who chose the answer “3” (Symbol: product not tested on animals), 6.3% answered, “1” (Symbol: recyclable packaging), and 1.6% answered, “4” (Symbol: cosmetics product durability, PAO). Statistical analysis showed that most respondents, regardless of age (Table 1), answered this question correctly (p=0.00237). A similar result was obtained when comparing the question about the natural cosmetics certificate symbol and the respondents’ place of residence (Table 1), where most respondents, regardless of their place of residence, indicated the correct answer (p=0.04437).
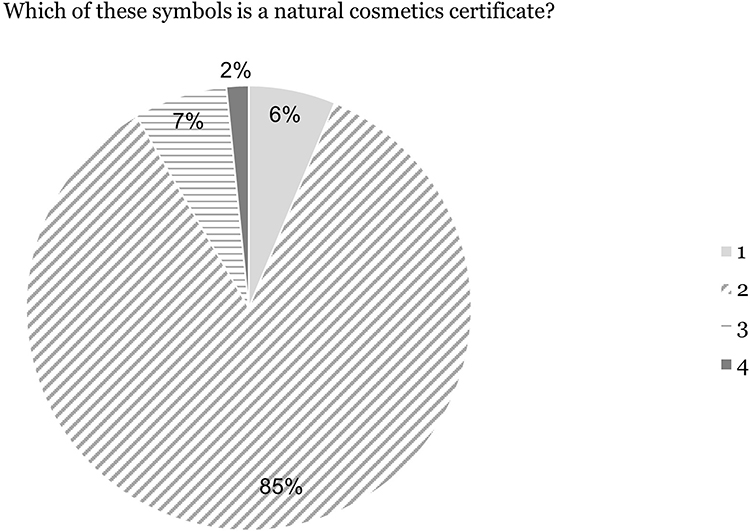 |
Figure 13 Knowledge of natural cosmetics certifications. |
Discussion
Observing the factor of the frequency of cosmetic purchases, we can notice a growing trend. In other study the most commonly given answer regarding the frequency of purchasing cosmetics was “Once a month” (53%).5 However, analysing the results of this study, the most commonly indicated answer was “Several times a month” (43%) (Figure 1). The answer “Once a month” was chosen by 40.1%. Similarly, the study published in 2020 confirms the results observed in the research.6
Still, the most popular distribution channel is drugstores, despite decreased sales during the COVID-19 pandemic.7,8 Currently, we can observe an increasing percentage of people choosing online drugstores (Figure 2). In the statistics maintained since 2017, the percentage of online stores in the overall structure of cosmetics sales is constantly increasing.9 The COVID-19 pandemic significantly influenced the current situation. A significant increase in interest in online shopping in the food and cosmetic-chemical industry has been observed since its outbreak. Manufacturers who focus on e-commerce development have a significant share in increasing online sales.10,11
The most important factors influencing consumers’ decision to purchase a cosmetic product (Figure 3) are its properties and price, followed by the chemical composition. We can observe similarities and changes by analysing studies conducted over the years. In a study from 2009, the brand was the most important factor driving consumers to purchase.12 Over the next 10 years the brand fell to third place and completely disappeared from the most frequently indicated responses in 2019.5,8,13–15 These results show how the value of a brand has decreased for consumers. Other determinants, such as composition and quality, are now more important. In studies from 2009 and 2016,12,14 the composition was ranked third, but in studies from 2011 and 2018,13,15 it did not appear at the top of the rankings. However, since 2019,5 it has been ranked first. In subsequent years, its position has slightly declined, but it is always among the most frequently indicated factors (Figure 3).8 The factor that appeared in 2011,13 as the most frequently given response was properties. Determinants that are semantically similar to properties are effect and quality. Starting in 2018,8,15 these three factors were the most frequently chosen by respondents (except in 2019,5 when quality was ranked second) (Figure 3). This indicates the growing importance that consumers attach to the properties and effects of the products offered. Quality has become more important than the products’ price over the years. Analysing studies from the last 13 years, we can see that price is the only constant factor. Respondents always ranked price second among all the factors that drive them to purchase cosmetics8,12–15 (the exception was in 2019,5 when the price was ranked third). Only once the most popular factor that obtained 74% was personal experience.14 Novelty cosmetics are the least important for consumers and do not encourage them to purchase (Figure 3). Also 53% of respondents answered that new products on the market are unimportant.5 Consumers are reluctant to buy new products. They will most likely choose such a product if their friends have used it.12 Packaging also received low ratings in all studies. The highest score was recorded in the current study, where the packaging was indicated by 9.9% of respondents as a factor driving them to purchase (Figure 3). We observe an increase in the importance of this factor, but it is still negligible. This may be due to the respondents’ perceptions that choosing such a response is superficial on their part. Confirmation of this thesis is provided by the results presented in Figure 8, indicating that eco-friendly packaging is important to 30.9% of respondents. Similar results were obtained in the study,12 where packaging ranked sixth among all factors influencing purchase decisions. However, further discussion with the respondents led to the discovery that packaging is still important to them.12
The impact of advertising on purchasing decisions is decreasing over time. Respondents identified television or Internet advertising as the main factor influencing their purchases (Figure 4). They paid even less attention to newspapers and leaflets (Figure 4). This is also related to the form of the conducted research. Online surveys mainly reach younger people who are more comfortable navigating the virtual world and are moving away from printed newspapers and leaflets. Most of the respondents, as many as 76.5%, were aged 18–25, and no response was obtained from anyone over 65 (Table 1). Despite the results obtained, the role of the Internet in promoting cosmetic products cannot be underestimated. One of the main ways to reach consumers is through social media promotion carried out with the help of influencers (Figure 4). This form of promotion helps build a credible brand image through the trust placed in famous people. Consumers try to avoid advertisements, such as those on television, while influencer marketing allows for a more friendly reception and easier reach of a specific target group. Adding direct links to advertised products by influencers is also of great importance in cooperation, as it increases sales, but even if a potential customer does not decide to purchase the product, it still has a positive impact on the advertiser’s website positioning. According to the IQS report,15 of people who follow at least one influencer, 74% declare that they take specific actions at their urging. One of the most frequently mentioned actions was purchasing products (26%).16 In 2021, only 27% of companies did not cooperate with any influencers.17 Advertisers want to invest in this type of promotion. When asked about the forecasted expenditure of manufacturers for 2021 compared to 2020, the most common response was a planned increase of 20%.17 Influencer marketing is still a relatively cheaper and more effective way of promotion than other advertising forms. However, the best way to reach new customers is through recommendations from acquaintances and family members (38%) (Figure 4). Word-of-mouth marketing is a reliable way to acquire new customers. In the case of this form of promotion, manufacturers must ensure the quality of the offered product and customer satisfaction.18 In particular, attention should be paid to the consistency of the product quality. There cannot be a difference between what the manufacturer presents and the actual state of things. Disappointed customers contribute to spreading negative opinions online and among acquaintances.19 Unsatisfactory product quality significantly discourages consumers from making purchases. Friends and family are the most popular source of information in cosmetics.
Over the past few years, natural cosmetics have gained much popularity.2 It is related to the growing trend of being “eco-friendly”, conscious care, and environmental protection.2 These are products that consumers increasingly choose. A significant majority of respondents, 77.6% of people, buy natural cosmetics (Figure 5). During the COVID-19 pandemic, the cosmetics market experienced a decline in sales, but it did not affect natural cosmetics. The pandemic has led to greater self-awareness and focused consumers’ attention on health issues. It is evidenced by research conducted by Growth from Knowledge (GfK), which noted a year-over-year increase in the value of purchases of “bio”, “eco”, and “vegan” cosmetics by 76%.20 Consumers also declare their willingness to pay more for natural cosmetics (Figure 9).2
The reasons for choosing natural cosmetics are very similar. Similar percentage values were obtained in the question about determinants of choosing natural cosmetics (Figure 6). The main reason was the presence of fewer chemical substances in the products. In addition, customers appreciate natural cosmetics that do not cause irritation and allergies and emphasise their practical action. Many people buy natural cosmetics to care for the environment. In addition, consumers need to be assured that these cosmetics are vegan and not tested on animals. An interesting aspect mentioned in the responses was paying attention to the detailed descriptions of the action of individual product ingredients, often placed on the packaging by the producers. It is a feature that distinguishes natural cosmetics from others. Such practice helps to shape consumer awareness. The ingredients often include plant-based substances that are closer and easier to understand for consumers compared to the convoluted and incomprehensible chemical names found in standard cosmetics. Sometimes, consumers’ choices do not depend on the above factors. They are often made by impulse and curiosity.7
The clear leader in the popularity of natural cosmetics brands in Poland is Bielenda (Figure 7). This result is consistent with the level of development, size, and duration of this company’s presence on the market. Bielenda is also the most popular brand among consumers.21 The brands at the top of consumer opinion are Vianek and Sylveco, followed by Nacomi and Yope.5,6 Comparing the results of these brands to the results obtained in this study, we can see a significant similarity (Figure 7). The same companies achieved the highest results, but they differ in order. Nacomi emerged as the leader, becoming more popular than Vianek. We also observe a similar situation with Yope, which is higher than Sylveco. The high popularity of OnlyBio is a big surprise, as 82.1% of respondents indicated that they recognise this brand. It may be due to the wide range of hair care products this company offers. Hair care is becoming increasingly popular among customers.22 OnlyBio focuses on promotion with the participation of influencers using social media channels. Easy access to the products of this brand, which are present in the most popular stationary drugstores in Poland, such as Rossmann and Hebe, also influences its popularity. The company states that its value has increased from PLN 180 million to PLN 400 million over the year, influenced by sales and marketing activities, investments in the ecological area of business, and favourable market trends.23
When choosing cosmetics, consumers pay attention to various aspects. The most important factor for consumers is that the products are not tested on animals (Figure 8), even though such practices are currently prohibited by law throughout the European Union.24 It is undoubtedly a controversial and often publicised issue. However, the lack of specific information and knowledge of legal regulations means that many consumers are not familiar with the legal standards prohibiting the animal testing of cosmetics. The importance of this issue is emphasised by respondents who declare that they are willing to pay more for a product that is not tested on animals (Figure 10). Consumers often choose products that do not contain Sodium Lauryl Sulfate (SLS) and are hypoallergenic (Figure 8). Following the trend of environmental awareness, more people check whether cosmetics are packaged in biodegradable packaging (Figure 8). Consumers also indicate a willingness to pay more for a product whose packaging is not made of plastic.2 They also declare that the packaging of cosmetic products should be obtained from secondary or biodegradable raw materials.5 The results concerning the importance of having natural certification are worrying. This issue is only ranked fifth in the survey (Figure 8). Having a certification that ensures naturalness is not essential to consumers or is only an additional advantage.8 A large percentage of respondents are indifferent to this issue.5
Consumers ignore whether a cosmetic is produced by small and local companies (Figure 11). Only 26.1% of respondents buy locally produced cosmetics, while 34.9% consciously avoid them, which indicates avoiding cosmetics manufactured by small ones and local companies. The reason may be the limited availability and high prices of such products.
The limited access to beauty services observed during the Covid-19 pandemic influenced the popularity of “Do It Yourself” (DIY) cosmetics, promoted on websites and by individual cosmetics producers. It was particularly noticeable in the sales of hair products. According to Nielsen company research,25 there was an increase in sales of hair colouring products by up to 10% in a short time. However, analysing the results of the survey, we can still conclude that the DIY cosmetics area is not popular, as only 19.7% of people declared that they make such cosmetics (Figure 12). This is not a large number, but compared to the pre-pandemic period, where DIY cosmetics were a niche market, we can see a significant increase.25
Consumers rate their level of knowledge about natural cosmetics very high. In the 2019 study,5 60% of respondents indicated above-average knowledge of natural cosmetics. This opinion is also confirmed by current research where as many as 85.3% of respondents correctly identified the Ecocert symbol, which serves as a natural cosmetics certification (Figure 13). This is a significant increase observed since 2020 when in other study,8 only 25.4% of respondents gave the correct answer to a similar question. In another study,26 an improvement in knowledge of symbols was observed over 5 years (from 2007 to 2012). Relatively many people read the ingredients of cosmetics. In the 2020 study, 26.3% of respondents said they read and analysed the product’s composition carefully, and 53.2% read them superficially.8 The ideal confirmation for these data is that 64.6% of women, based on the given composition of a natural cosmetic, correctly identified it as a face cream.8 Worse results (26.8% correct answers) were obtained in a similar question but referring to a non-natural cosmetic product.8 Natural cosmetics are more accessible for consumers to recognise due to the less complex substances they contain. In the study from 2020,8 the largest group of respondents (39.8%) rated their knowledge of cosmetic ingredient properties as average. Meanwhile, 23.2% of respondents declared a high or very high level of knowledge. An appropriate confirmation of high knowledge in cosmetics is a question regarding the order in which the list of ingredients present in the cosmetic is arranged.8 The correct answer, ie, that the components are arranged in descending order according to mass, was indicated by 69.3% of respondents. Currently, consumers pay much more attention to the cosmetics they choose and are interested in their composition and properties.
Conclusions
In summary, it can be stated that the frequency of purchasing natural cosmetics and customer knowledge about the market is rising. Moreover, the demand for natural cosmetics in Poland will continue to develop steadily in the coming years. Other sources also confirmed this trend for Sweden and Europe (the market expected annual growth for 2023 is 6.27%).27,28 The number of products and brands will increase along with the growing needs of consumers. The increasing number of conscious consumers who care about health and safety will strengthen the position of natural cosmetics. Therefore, the quality of the offered product is becoming increasingly important for consumers rather than its price. As reported in the current as well as Hungary study, the ubiquitous interest in the natural environment and ecology will also be one of the main determinants of market development.29 In addition, with the popularisation of natural cosmetics, consumers’ knowledge about using animals to produce cosmetics or their ingredients will improve.
Data Sharing Statement
All included articles are publicly available. The datasets used and/or analysed during the current study are available from the corresponding author on reasonable request.
Acknowledgments
No acknowledgements to declare.
Author Contributions
All authors made a significant contribution to the work reported, whether that is in the conception, study design, execution, acquisition of data, analysis and interpretation, or in all these areas; took part in drafting, revising or critically reviewing the article; gave final approval of the version to be published; have agreed on the journal to which the article has been submitted; and agree to be accountable for all aspects of the work.
Funding
This research received no specific grant from the public, commercial or not-for-profit funding agencies.
Disclosure
All the authors declare that they have no conflicts of interest for this work.
References
1. Pieńczykowska A. Rynek kosmetyków naturalnych [Natural cosmetics market]. Badische Anilin und Sodafabrik; 2021:3–39. Polish.
2. Mrówczyński K, Tyc T. Dekada sukcesów, pandemia i co dalej? Perspektywy krajowej branży kosmetycznej w postkryzysowej rzeczywistości [A decade of success, a pandemic, and what next? Prospects of the domestic cosmetics industry in the post-crisis reality]. Bank Pekao; 2021:4–52. Polish.
3. Chmurzyńska-Brown B. Branża kosmetyczna vs. COVID-19. Pół roku funkcjonowania w pandemii [Cosmetics industry vs. COVID-19. Half a year of functioning in a pandemic]. Polski Zwiazek Przemyslu Kosmetycznego; 2020:2–20. Polish.
4. Raosoft sample size calculator. Available from: http://www.raosoft.com/samplesize.html.
5. Kantor A, Hubner R. Zachowania kobiet na rynku kosmetyków naturalnych [Women’s behaviour on the market of natural cosmetics]. Zeszyty Naukowe Uniwersytetu Ekonomicznego w Katowicach. 2019;376:73–95. Polish.
6. Firek A, Dziadkowiec JM. Preferencje i zachowania konsumentów na rynku kosmetyków naturalnych [Consumer preferences and behaviors in the natural cosmetics market]. Nauki inzynierskie i technologie. 2020;36:57–69. Polish.
7. Pikuła-Małachowska J. Zachowania konsumentów na rynku kosmetyków w świetle badania własnego [Consumer Behavior on Cosmetics Market in the Light of Own Research]. Problemy Zarzadzania Finansów i Marketingu. 2014;36:125–133. Polish.
8. Bojarczuk D, Smalej O. Identyfikacja oddziaływania informacji zawartych na opakowaniach kosmetyków na decyzje nabywcze młodych konsumentek [Identification of the impact of information contained on cosmetics packaging on purchasing decisions of young female consumers]. Zeszyty Naukowe Uniwersytetu Ekonomicznego w Krakowie. 2020;5(989):101–121. Polish. doi:10.15678/ZNUEK.2020.0989.0506
9. Branża kosmetyczna. Wzrost znaczenia polskich producentów na świecie [Cosmetics industry. Increased importance of Polish producers in the world]. Bank PKO; 2020:2–39. Polish.
10. E-commerce polskich producentów kosmetyków. Marki kosmetyczne coraz mocniej stawiają na e-commerce [E-commerce of Polish cosmetics producers. Cosmetic brands are increasingly betting on e-commerce]. Available from: https://wirtualnekosmetyki.pl/-badania-rynkowe/badanie:-marki-kosmetyczne-coraz-mocniej-stawiaja-na-e-commerce.
11. Nielsen: e-commerce staje się codziennością [Nielsen: e-commerce is becoming commonplace]. Available from: https://wirtualnekosmetyki.pl/-badania-rynkowe/nielsen:-zakupy-e--commerce-staja-sie-codziennoscia.
12. Osuch J. Determinanty zachowań konsumentów produktów kosmetycznych na rynku polskim [Determinants of consumer behavior of cosmetic products on the Polish market]. Uniwersytet Ekonomiczny w Poznaniu; 2009:196–210. Polish.
13. Adamkiewicz K, Ulatowska-Szostak E, Marcinkowski J. Najważniejsze czynniki skłaniające konsumentów do zakupu kosmetyków [The most important factors inducing consumers to buy cosmetics. Hygeia Public Health. 2011;46(4):467–470. Polish.
14. Tobiś K. Negatywny wpływ wybranych składników preparatów kosmetycznych na skórę a świadomość klientek gabinetów kosmetologicznych [The negative impact of selected ingredients of cosmetic preparations on the skin and the awareness of clients of cosmetology salons]. Studenckie Zeszyty Naukowe Kosmetologia. 2016;1(1):47–71. Polish.
15. Anjana SS. A study on factors influencing cosmetic buying behavior of consumers. Int J Pure Appl Math. 2018;118(9):453–459.
16. Influencer marketing rośnie w siłę [Influencer marketing is on the rise]. Available from: https://wirtualnekosmetyki.pl/-raporty-tematyczne/influencer-marketing-rosnie-w-sile.
17. Sosnowski R. Raport: rynek influencerów w Polsce w roku 2021 [Report: influencer market in Poland in 2021]. Reach a Blogger; 2021:2–21. Polish.
18. Linkiewicz A. Ewolucja marketingu szeptanego jako narzędzia komunikacji marketingowej w świetle rozwoju technologii informacyjnych [Evolution of word-of-mouth marketing as a tool of marketing communication in the light if IT development. Prace Naukowe Uniwersytetu Ekonomicznego we Wroclawiu. 2015;406:346–357. Polish.
19. Gawrońska M. Marketing szeptany jako nowoczesna forma promocji zatrudnienia [A word-of-mouth marketing as a modern form of advertising]. Rynek Spoleczenstwo Kultura. 2013;2:30–35. Polish.
20. Growth from Knowledge: polacy coraz częściej sięgają po produkty ekologiczne [Growth from Knowledge: poles are increasingly reaching for organic products]. Available from: https://wirtualnekosmetyki.pl/-badania-rynkowe/gfk:-polacy-coraz-czesciej-siegaja-po-produkty-ekologiczne.
21. Bielenda – o firmie [Bielenda - about the company]. Available from: https://bielendaprofessional.pl/o-firmie.
22. Sipiński D, Czerniak A. Sektory Banku Zachodniego. Branża kosmetyczna [Bank of the West sectors. Cosmetics industry]. WBK; 2017:4–27. Polish.
23. Onlybio.life liderem na krajowym rynku ekologicznych kosmetyków [Onlybio.life is a leader on the domestic market of organic cosmetics]. Available from: https://www.fxmag.pl/artykul/onlybiolife-liderem-na-krajowym-rynku-ekologicznych-kosmetykow.
24. RegulatioR(EC) No 1907/2006 of the European Parliament and of the Council of 18 December 2006 concerning the Registration, Evaluation, Authorisation and Restriction of Chemicals (REACH), establishing a European Chemicals Agency, amending Directive 1999/45/EC and repealing Council Regulation (EEC) No 793/93 and Commission Regulation (EC) No 1488/94 as well as Council Directive 76/769/EEC and Commission Directives 91/155/EEC, 93/67/EEC, 93/105/EC and 2000/21/EC (Text with EEA relevance); 2006.
25. 7 trendów – czyli jak kupujemy kosmetyki w dobie COVID-19 [7 trends - how we buy cosmetics in the era of COVID-19]. Available from: https://businessinsider.com.pl/lifestyle/jak-kupujemy-kosmetyki-w-dobie-covid-19/56p6s00.
26. Wolniak R, Moskaluk-Grochowicz A. Wiedza konsumentek na temat informacji umieszczanych na kosmetykach [The consumers’ knowledge about information placed on cosmetics]. Zeszyty Naukowe Politechniki Slaskiej. 2015;77:279–290. Polish.
27. The Swedish Market. Natural Ingredients for Cosmetics. Open Trade Gate Sweden, National Board of Trade; 2022.
28. Statista. Natural Cosmetics – Europe. Available from: https://www.statista.com/outlook/cmo/beauty-personal-care/cosmetics/natural-cosmetics/europe.
29. Amberg N, Fogarassy C. Green consumer behavior in the cosmetics market. Resources. 2019;8:137. doi:10.3390/resources8030137
 © 2023 The Author(s). This work is published and licensed by Dove Medical Press Limited. The
full terms of this license are available at https://www.dovepress.com/terms
and incorporate the Creative Commons Attribution
- Non Commercial (unported, 3.0) License.
By accessing the work you hereby accept the Terms. Non-commercial uses of the work are permitted
without any further permission from Dove Medical Press Limited, provided the work is properly
attributed. For permission for commercial use of this work, please see paragraphs 4.2 and 5 of our Terms.
© 2023 The Author(s). This work is published and licensed by Dove Medical Press Limited. The
full terms of this license are available at https://www.dovepress.com/terms
and incorporate the Creative Commons Attribution
- Non Commercial (unported, 3.0) License.
By accessing the work you hereby accept the Terms. Non-commercial uses of the work are permitted
without any further permission from Dove Medical Press Limited, provided the work is properly
attributed. For permission for commercial use of this work, please see paragraphs 4.2 and 5 of our Terms.