Back to Journals » Infection and Drug Resistance » Volume 13
The Gap Between Global Tuberculosis Incidence and the First Milestone of the WHO End Tuberculosis Strategy: An Analysis Based on the Global Burden of Disease 2017 Database
Authors Pan Z ![]() , Zhang J
, Zhang J ![]() , Bu Q, He H, Bai L, Yang J, Liu Q, Lyu J
, Bu Q, He H, Bai L, Yang J, Liu Q, Lyu J ![]()
Received 8 February 2020
Accepted for publication 16 April 2020
Published 4 May 2020 Volume 2020:13 Pages 1281—1286
DOI https://doi.org/10.2147/IDR.S248875
Checked for plagiarism Yes
Review by Single anonymous peer review
Peer reviewer comments 2
Editor who approved publication: Professor Suresh Antony
Zhenyu Pan,1– 3 Jun Zhang,1,2,4 Qingting Bu,5 Hairong He,1 Ling Bai,1 Jin Yang,1,2 Qingqing Liu,1,2 Jun Lyu1,2,6
1Clinical Research Center, The First Affiliated Hospital of Xi’an Jiaotong University, Xi’an, Shaanxi, People’s Republic of China; 2School of Public Health, Xi’an Jiaotong University Health Science Center, Xi’an, Shaanxi, People’s Republic of China; 3Department of Pharmacy, Xi’an Children’s Hospital, Xi’an, Shaanxi, People’s Republic of China; 4Department of Orthopaedics, Baoji Municipal Central Hospital, Baoji, Shaanxi, People’s Republic of China; 5Department of Genetics, Northwest Women’s and Children’s Hospital, Xi’an, Shaanxi, People’s Republic of China; 6Department of Clinical Research, The First Affiliated Hospital of Jinan University, Guangzhou, Guangdong, People’s Republic of China
Correspondence: Jun Lyu
Clinical Research Center, The First Affiliated Hospital of Xi’an Jiaotong University, No. 277 Yanta West Road, Xi’an, Shaanxi 710061, People’s Republic of China
Tel +86 29 8532 3614
Fax +86 29 8532 3473
Email [email protected]
Objective: The first milestone (in 2020) of the End Tuberculosis (TB) Strategy of the World Health Organization was a 20% reduction in TB incidence rate compared with the 2015 baseline. This study aimed to determine the incidence rate of TB and how it has changed since 2015 at the global, regional, and country levels.
Methods: This study used the most recent data from the Global Burden of Disease study in 2017 to extract TB incidence rates at the global, regional, and country levels. The annual percentage change in the incidence rate (APCIR) of TB based on 2015 was calculated to evaluate the trend in the changes at various levels, including globally and at the regional and country levels. An APCIR of – 4% from 2015 to 2020 is considered acceptable.
Results: The global APCIR was only – 1.1% from 2015 to 2017. Only 2 of the 21 analyzed regions had APCIRs lower than – 4%: Southern Sub-Saharan Africa and Eastern Europe. Worse still, six regions exhibited increasing TB incidence rates. At the country level, although 143 of 195 countries and territories showed reductions in TB incidence rates, the APCIR was lower than – 4% in only 11 of them.
Conclusion: This study suggests that it will be difficult to achieve the 2020 incidence rate milestone of the End Tuberculosis Strategy. This indicates the need to design and implement suitable strategies to address the current situation in order to achieve the next milestone and targets of the End Tuberculosis Strategy.
Keywords: GBD, tuberculosis, incidence, End Tuberculosis Strategy
Introduction
Tuberculosis (TB) is an infectious disease caused by Mycobacterium tuberculosis that has affected humans for thousands of years.1,2 It is one of the top-ten causes of death worldwide and the leading cause of death from a single source of infection.3,4 The World Health Organization (WHO) estimated that TB caused the deaths of 1.3 million HIV-negative people in 2017, while a further 300,000 of the same population died of TB.5 Millions of people still suffer from TB every year, which prompted the WHO to launch the End Tuberculosis Strategy6 that has the overall goal to end the global TB epidemic by 2035. This strategy has targets in 2030 and 2035 and milestones in 2020 and 2025 for the number of TB cases and death rates needed to achieve this goal. Achieving the first milestone in 2020 is important for achieving the following milestone in 2025 and the targets in 2030 and 2035. For TB cases, the first milestone in 2020 was a 20% reduction in the TB incidence rate compared to that in 2015.7,8 However, despite it now being 2020, no study has systematically analyzed the changes in the incidence of TB since 2015 and the possibility of achieving the first milestone at the global, regional, and country levels.
Over the past 2 decades, the Institute for Health Metrics and Evaluation (IHME; an independent global health research center at the University of Washington) has developed a methodology to quantify the burden of diseases, injuries, and risk factors for informing health program and policy-making.9 The Global Burden of Disease (GBD) database is a systematic and scientific database produced by the IHME that regularly provides comparable estimates of the key indicators of disease burden assessment, including the incidence rate of TB.10,11 The present study utilized the GBD 2017 database to systematically summarize and analyze the incidence rate of TB and its changes since 2015 at the global, regional, and country levels. The aim of the present study was to determine the probability of achieving the first milestone of the WHO End Tuberculosis Strategy, for incidence rate and the associated difficulties and any countermeasures that might be required.
Methods
The case definition included all forms of TB (including pulmonary TB and extrapulmonary TB) that were bacteriologically confirmed or clinically diagnosed. The ICD-10 codes for TB are A10–A19.9, B90–B90.9, K67.3, K93.0, M49.0, and P37.0, while the corresponding ICD-9 codes are 010–019.9, 137–137.9, 138.0, 138.9, 139.9, 320.4, and 730.4–730.6. Data sources for the incidence rate of TB can be explored using an online tool produced by the IHME called the GHDx (Global Health Data Exchange) query tool (http://ghdx.healthdata.org/gbd-results-tool).12
We obtained the annual incidence rates of TB from 2015 to 2017 globally as well as separately for 21 regions and 195 countries and territories. WHO divided the world into six regions for the End Tuberculosis Strategy: Africa, Americas, Eastern Mediterranean, Europe, South-East Asia, and Western Pacific. GBD regions and WHO regions of 195 countries and territories were showed in Table S1. Previous studies have described in detail the general methods used to estimate the incidence of TB for the GBD 2017 study.9 Briefly, data on the TB incidence come from two sources: (1) from notification data for countries with a four- or five-star rating on their cause-of-death data13 as a proxy for the quality of health-related administrative data systems, and (2) estimations for countries with a rating lower than four stars. Incidence estimates for the latter locations were generated using mixed-effects regression analysis (with region random effects). Mortality-to-incidence (MI) ratios (logit transformed) for the causes of death were used as input data for the former locations, with a Healthcare Access and Quality (HAQ) index as a covariate anchoring the lower end of the HAQ index scale with a data point from a cohort study in the 1960s14 that found that 49.2% of 126 untreated new pulmonary TB cases were dead at the end of the 5-year follow-up period; these data were used to predict age- and sex-specific MI ratios for all locations and years. Then, the MI ratios and cause-specific mortality estimates were used to compute the incidence input for the DisMod-MR meta-regression tool (version 2.1) for locations with ratings lower than four stars. In locations where the estimated MI ratios were greater than the notification-based values, the latter was used to compute the incidence. Notification-based MI ratios were computed using notification data and estimated cause-specific mortality rates for 2010. For other years it was assumed that the proportional difference between predicted MI ratios and notifications-based MI ratios was similar to that in 2010, and the 70 predicted MI ratios were adjusted accordingly, which were then used to compute the incidence. Finally, the annual percentage change in the incidence rate (APCIR) of TB based on 2015 was calculated to evaluate the trend in the changes at various levels, including globally and for 21 regions and 195 countries and territories.
Based on a 20% reduction in the TB incidence rate by 2020 compared to 2015, which is the first milestone of the WHO End Tuberculosis Strategy, an APCIR of –4% from 2015 to 2020 is considered acceptable. The statistical analyses were performed using R software (version 3.4.3).
Results
The global APCIR was only –1.1% from 2015 to 2017, which differs markedly from the value of –4% required to fulfill the 2020 milestone of the WHO End Tuberculosis Strategy (Figure 1 and Table 1). This means that achieving the 2020 milestone would require the APCIR to reach –5.94% between 2018 and 2020 (Figure 1 and Table 1).
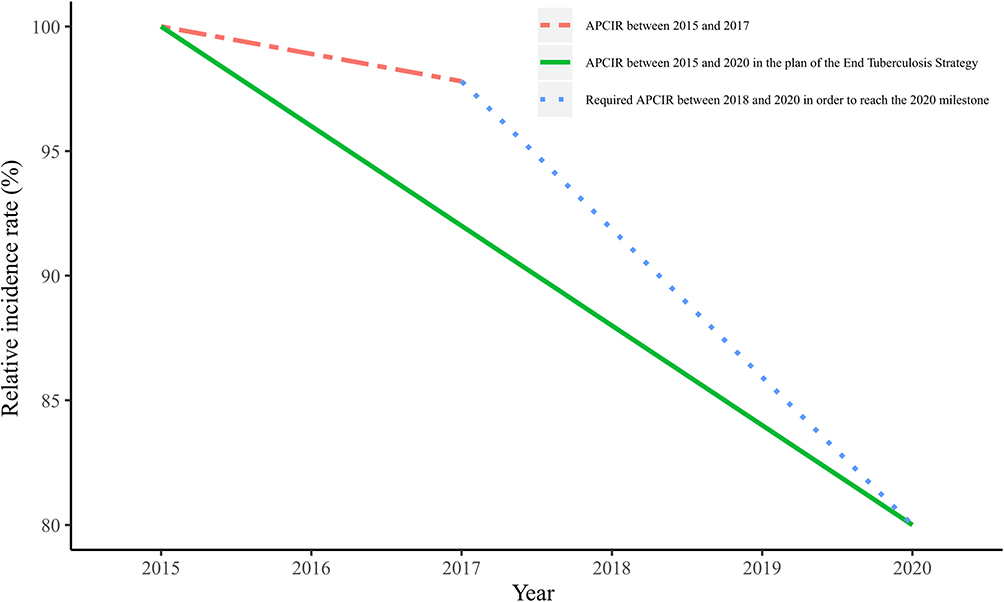 |
Figure 1 Changes in global TB incidence rate. Notes: The green line represents the APCIR between 2015 and 2017; the red line represents the APCIR between 2015 and 2020 in the plan of the WHO End Tuberculosis Strategy; the blue line represents the required APCIR between 2018 and 2020 in order to reach the 2020 milestone of the WHO End Tuberculosis Strategy. Abbreviations: APCIR, annual percentage change in the incidence rate. |
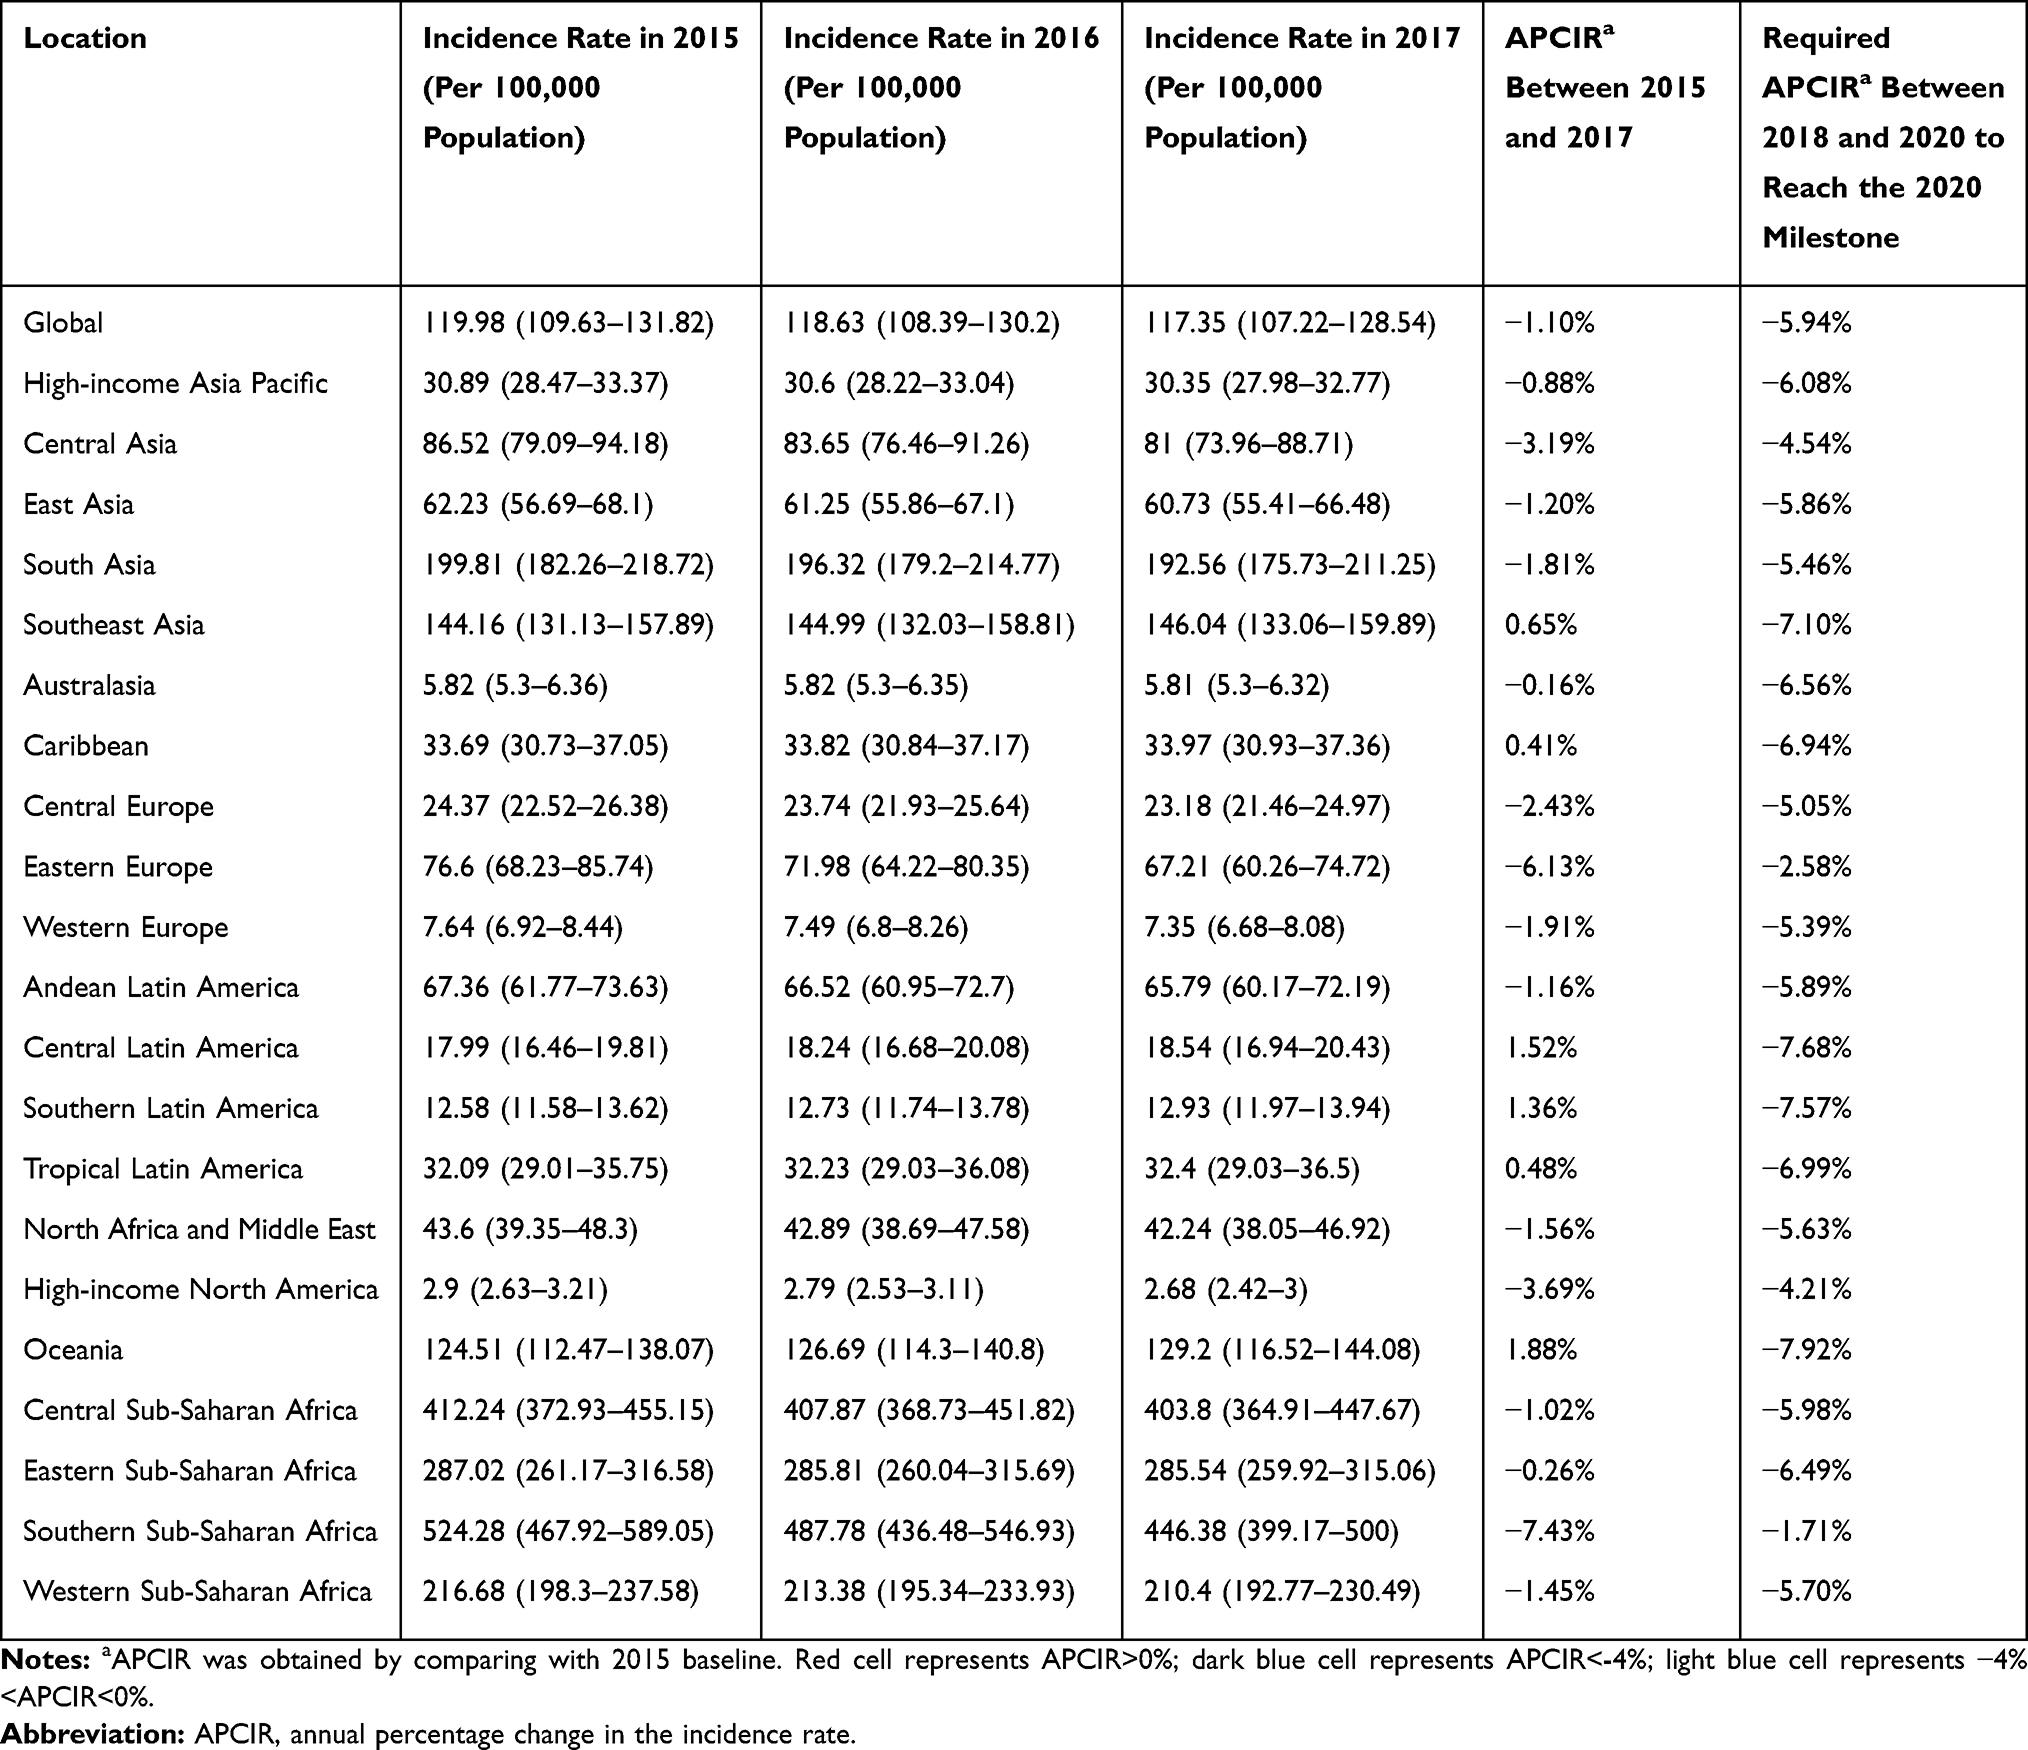 |
Table 1 The Incidence Rates in 2015, 2016 and 2017, The APCIR Between 2015 and 2017, and the Required APCIR Between 2018 and 2020 of Global and 21 Regions |
The TB incidence rate reduced from 2015 to 2017 in 15 of the 21 regions, while it increased in the remaining 6 (Table 1). The APCIR was lower than –4% in only two of the regions, Southern Sub-Saharan Africa (–7.43%) and Eastern Europe (–6.13%) (Table 1). Among the six regions with increasing TB incidence rates, the APCIR was highest in Oceania (1.88%), followed by Central Latin America (1.52%), Southern Latin America (1.36%), Southeast Asia (0.65%), Tropical Latin America (0.48%), and Caribbean (0.41%).
The TB incidence rate decreased in 143 of the 195 countries and territories, but the APCIR was lower than –4% in only 11 of them: Republic of South Africa (–10.01%), Republic of Kazakhstan (–9.62%), the Russian Federation (–7.62%), Republic of Belarus (–6.43%), Hungary (–6.43%), Republic of Armenia (–5.84%), United Kingdom of Great Britain and Northern Ireland (–5.08%), State of Kuwait (–5.06%), Republic of Estonia (–4.80%), Georgia (–4.60%), and United States of America (–4.45%). A particularly worrying finding was that the APCIR was positive in 52 of the 195 countries, with the top-3 countries being Philippines (7.69%), Timor Leste (7.22%), and Germany (6.14%). The APCIRs in the 195 countries and territories are presented in Table S2 and Figure 2.
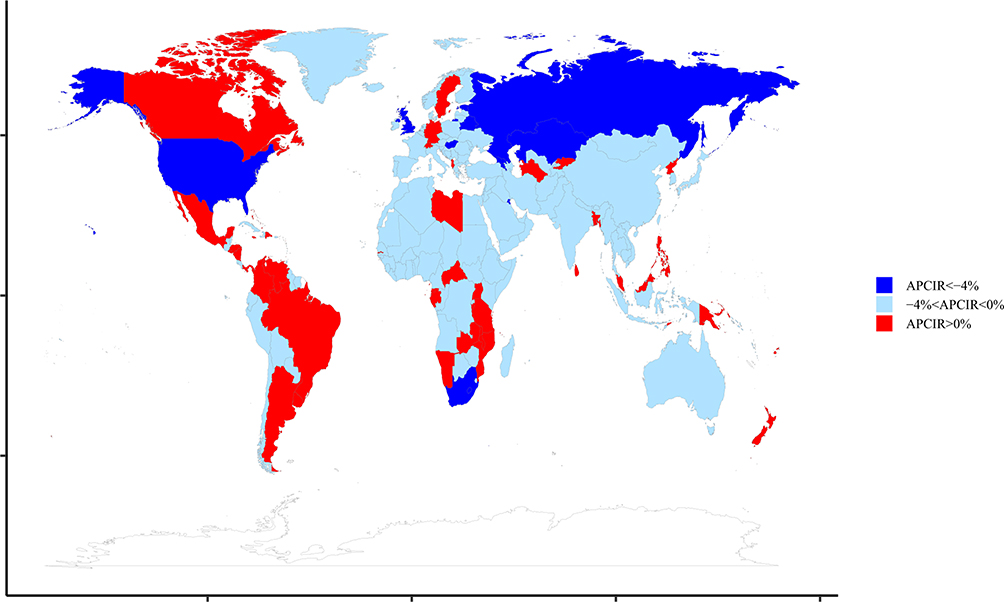 |
Figure 2 The APCIR of TB between 2015 and 2017 in 195 countries and territories. Abbreviation: APCIR, annual percentage change in the incidence rate. |
Discussion
TB is the leading single-agent infectious-disease killer worldwide.15 Analyzing TB incidence compared with 2015 at the global, regional, and country levels can help to quantify the difficulty of achieving the 2020 milestone and formulate new countermeasures to fulfill the End Tuberculosis Strategy.
In this study, we used the data from the GBD database produced by the IHME, which provides rigorous and comparable measurement of the world’s most important health problems and evaluates the strategies used to address them.16 The global TB incidence rates are mainly estimated by WHO and IHME. WHO uses four main methods to estimate the TB incidence: (1) results from TB prevalence surveys, (2) notifications in high-income countries adjusted by a standard factor, (3) results from inventory/capture-recapture studies, and (4) case notification data combined with expert opinions about case detection gaps.17 The IHME estimates the TB incidence based on notification data on the cause of death and a mixed-effects regression using MI ratios on causes of death as input data, with the HAQ index as a covariate anchoring the lower end of the HAQ index scale. Despite some differences between the estimation methods used by the two institutions, their global estimates of TB incidence are similar.18 For example, the best estimate for the TB incidence in 2017 from the IHME (the latest year for which estimates had been published in August 2019) was 10.3 million,12 compared with 10.1 million (range, 9.0–11 million) in 2017 in a WHO report.7
According to the WHO report, WHO European region is on track to achieve the 2020 milestones of the End Tuberculosis Strategy for reductions in the TB incidence, whereas the other five WHO regions and many individual countries are not.7 In the GBD database from the IHME, the world can be divided into 21 regions. This finer zoning is conducive to obtaining a more accurate understanding of the incidence of TB, and the results complement the WHO results. The present study found that only 2 regions (Southern Sub-Saharan Africa and Eastern Europe) and 11 countries are on track to achieve the 2020 milestone for reductions in the TB incidence. The results are consistent with the WHO reporting that it will be difficult for the 2020 milestone of the End Tuberculosis Strategy to be achieved either globally or by most countries. WHO made some constructive suggestions to reduce the incidence rate of tuberculosis, treatment of latent TB infection, prevention of transmission of M. tuberculosis through infection prevention and control, and vaccination of children with the bacille Calmette-Guérin vaccine.5,7 Before breakthrough technologies for TB prevention and treatment, such as more effective vaccines, emerge, we believe that the suggestions remain crucial for reducing the global TB incidence rate. However, in response to these suggestions, different policies and implementation efforts by different countries may affect the decline in TB incidence rate. For example, the rapid decline of TB incidence rate in the Russian Federation is due to the promotion and strengthening of the reduction of TB burden and scrutiny of the progress through the highest political level.5 Therefore, the strengthening of TB prevention and control policy in different countries may be an effective way to accelerate the reduction of TB incidence.
Previous studies have estimated the annual percentage change of the age-standardized incidence rate when investigating global trends in the incidence of TB.19–23 While this metric is a good indicator, it was not applicable to the present study for several reasons: (1) the annual percentage change represents the degree of change compared with the previous year, while the incidence in the 2020 milestone of the WHO End Tuberculosis Strategy is compared with 2015; (2) an annual percentage change estimated using a long period of data (eg, 10+ years) does not represent the trend after 2015; and (3) the 2020 milestone of the WHO End Tuberculosis Strategy is to reduce the incidence rate of TB by 20%, and not the age-standardized incidence rate. We, therefore, chose the annual percentage change in the incidence rate of TB based on 2015 to evaluate the trend of TB incidence rate after 2015 in addressing the purpose of this study.
This study was naturally subject to some limitations. First, our results are based on data obtained from the GBD database produced by the IHME. It would be very meaningful if the reductions of the incidence rates of TB compared with 2015 at the global, regional, and country levels could be estimated using WHO data compared with those obtained by analyzing the GBD database. However, WHO did not report the percentage change in TB incidence at the global, regional, and country levels compared to 2015. Second, only 3 years of data were analyzed in this study. Third, the 20% reduction of the incidence rate of TB is a demand of the 2020 global milestone of the WHO End Tuberculosis Strategy, rather than that of every country. And there are some gaps in the datasets of individual countries. So the categorical assumption, an APCIR of –4% from 2015 to 2020 is considered acceptable, is rough. However, determining whether individual countries are on track to achieve the 2020 milestone will be helpful for future adjustments to both WHO and national policies.
Conclusion
This is the first study to systematically analyze changes in the TB incidence since 2015 and the possibility of achieving the first milestone at the global, regional, and country levels. The obtained findings suggest that it will be difficult to achieve the 2020 milestone of the WHO End Tuberculosis Strategy. The current strategies may have little effect, and so efforts including stronger policies, better execution, and improving the prevention, screening, diagnosis, and treatment for TB may be needed to achieve the subsequent milestone in 2025 and the targets in 2030 and 2035 of the WHO End Tuberculosis Strategy. In addition, different regions and countries need different target values of TB incidence rate because of different situations and current conditions.
Acknowledgments
This study was supported by the National Social Science Foundation of China (No.16BGL183) and the Natural Science Basic Research Program of Shaanxi (No. 2020JQ-929).
Disclosure
The authors report no conflicts of interest in this work.
References
1. Hershkovitz I, Donoghue HD, Minnikin DE, et al. Tuberculosis origin: the neolithic scenario. Tuberculosis. 2015;95(Suppl 1):S122–S126. doi:10.1016/j.tube.2015.02.021
2. Churchyard G, Kim P, Shah NS, et al. What we know about tuberculosis transmission: an overview. J Infect Dis. 2017;216(suppl_6):S629–s635. doi:10.1093/infdis/jix362
3. Gong W, Liang Y, Wu X. The current status, challenges, and future developments of new tuberculosis vaccines. Hum Vaccin Immunother. 2018;14(7):1697–1716. doi:10.1080/21645515.2018.1458806
4. Gebremichael B, Abebaw TA, Moges T, Abaerei AA, Worede N. Predictors of pediatric tuberculosis in public health facilities of Bale Zone, Oromia region, Ethiopia: a case control study. BMC Infect Dis. 2018;18(1):252. doi:10.1186/s12879-018-3163-0
5. Global tuberculosis report 2018. Available from: https://www.who.int/tb/publications/global_report/en/.
6. The end TB strategy; 2014. Available from: https://www.who.int/tb/strategy/End_TB_Strategy.pdf?ua=1.
7. Global tuberculosis report 2019. Available from: https://apps.who.int/iris/bitstream/handle/10665/329368/9789241565714-eng.pdf?ua=1.
8. Lonnroth K, Raviglione M. The who’s new end TB strategy in the post-2015 era of the sustainable development goals. Trans R Soc Trop Med Hyg. 2016;110(3):148–150. doi:10.1093/trstmh/trv108
9. GBD 2017 Disease and Injury Incidence and Prevalence Collaborators. Global, regional, and national incidence, prevalence, and years lived with disability for 354 diseases and injuries for 195 countries and territories, 1990–2017: a systematic analysis for the global burden of disease study 2017. Lancet. 2018;392(10159):1789–1858.
10. Murray CJ, Lopez AD. Alternative projections of mortality and disability by cause 1990–2020: global burden of disease study. Lancet. 1997;349(9064):1498–1504. doi:10.1016/S0140-6736(96)07492-2
11. Murray CJL, Lopez AD. Measuring global health: motivation and evolution of the global burden of disease study. Lancet. 2017;390(10100):1460–1464. doi:10.1016/S0140-6736(17)32367-X
12. Global Burden of Disease Collaborative Network. Global burden of disease study 2017 (GBD 2017) results. institute for health metrics and evaluation (IHME); 2018. Available from: http://ghdx.healthdata.org/gbd-results-tool.
13. GBD 2016 Causes of Death Collaborators. Global, regional, and national age-sex specific mortality for 264 causes of death, 1980–2016: a systematic analysis for the global burden of disease study 2016. Lancet. 2017;390(10100):1151–1210. doi:10.1016/S0140-6736(17)32152-9
14. National Tuberculosis Institute. Tuberculosis in a rural population of South India: a five-year epidemiological study. Bull World Heal Organ. 1974;51(5):473–488.
15. Szkwarko D, Bouton TC, Rybak NR, Carter EJ, Chiang SS. Tuberculosis: an epidemic perpetuated by health inequalities. Rhode Island Med j. 2019;102(7):47–50.
16. Tichenor M, Sridhar D. Metric partnerships: global burden of disease estimates within the World Bank, the World Health Organisation and the Institute for Health Metrics and Evaluation. Wellcome Open Res. 2019;4:35. doi:10.12688/wellcomeopenres.15011.1
17. Methods used by WHO to estimate the global burden of TB disease. 2019. Available from: https://www.who.int/tb/publications/global_report/tb19_technical_appendix.pdf?ua=1.
18. Floyd K, Glaziou P, Zumla A, Raviglione M. The global tuberculosis epidemic and progress in care, prevention, and research: an overview in year 3 of the end TB era. Lancet Res Med. 2018;6(4):299–314. doi:10.1016/S2213-2600(18)30057-2
19. GBD Tuberculosis Collaborators. The global burden of tuberculosis: results from the global burden of disease study 2015. Lancet Infect Dis. 2018;18(3):261–284. doi:10.1016/S1473-3099(17)30703-X
20. GBD Tuberculosis Collaborators. Global, regional, and national burden of tuberculosis, 1990–2016: results from the global burden of diseases, injuries, and risk factors 2016 study. Lancet Infect Dis. 2018;18(12):1329–1349. doi:10.1016/S1473-3099(18)30625-X
21. Gomes MG, Barreto ML, Glaziou P, et al. End TB strategy: the need to reduce risk inequalities. BMC Infect Dis. 2016;16:132. doi:10.1186/s12879-016-1464-8
22. Ogbo FA, Ogeleka P, Okoro A, et al. Tuberculosis disease burden and attributable risk factors in Nigeria, 1990–2016. Trop Med Health. 2018;46:34. doi:10.1186/s41182-018-0114-9
23. Uplekar M, Weil D, Lonnroth K, et al. WHO’s new end TB strategy. Lancet. 2015;385(9979):1799–1801. doi:10.1016/S0140-6736(15)60570-0
 © 2020 The Author(s). This work is published and licensed by Dove Medical Press Limited. The
full terms of this license are available at https://www.dovepress.com/terms
and incorporate the Creative Commons Attribution
- Non Commercial (unported, 3.0) License.
By accessing the work you hereby accept the Terms. Non-commercial uses of the work are permitted
without any further permission from Dove Medical Press Limited, provided the work is properly
attributed. For permission for commercial use of this work, please see paragraphs 4.2 and 5 of our Terms.
© 2020 The Author(s). This work is published and licensed by Dove Medical Press Limited. The
full terms of this license are available at https://www.dovepress.com/terms
and incorporate the Creative Commons Attribution
- Non Commercial (unported, 3.0) License.
By accessing the work you hereby accept the Terms. Non-commercial uses of the work are permitted
without any further permission from Dove Medical Press Limited, provided the work is properly
attributed. For permission for commercial use of this work, please see paragraphs 4.2 and 5 of our Terms.