
Back to Journals » Diabetes, Metabolic Syndrome and Obesity » Volume 18
The Effects of Specific Gut Microbiota on Hyperuricemia — A Mendelian Randomization Analysis and Clinical Validation
Authors Aikepa D, He Y, Chen W, Liang M, Du Y, Chen X, Du M, Zhu Y, Wang J, Sun Y 
Received 20 December 2024
Accepted for publication 21 May 2025
Published 10 June 2025 Volume 2025:18 Pages 1891—1902
DOI https://doi.org/10.2147/DMSO.S510384
Checked for plagiarism Yes
Review by Single anonymous peer review
Peer reviewer comments 2
Editor who approved publication: Professor Jae Woong Sull
Dilinuer Aikepa,1,* Yi He,2,* Wujin Chen,3,* Meiting Liang,4 Yongkun Du,5 Xiaoyu Chen,1 Manxi Du,1 Yuqiu Zhu,1 Jianping Wang,6 Yuping Sun1,7,8
1Department of Microbiology, Xinjiang Medical University, Urumqi, People’s Republic of China; 2Department of Cell Biology and Genetics, Xinjiang Second Medical College, Karamay, People’s Republic of China; 3Department of Morphological Center, Xinjiang Medical University, Urumqi, People’s Republic of China; 4Department of Pathology, Xinjiang Second Medical College, Karamay, People’s Republic of China; 5Department of Critical Care Medicine, China-Japan Union Hospital of Jilin University, Changchun, People’s Republic of China; 6Department of Cardiology, The Fourth Affiliated Hospital of Xinjiang Medical University, Urumqi, People’s Republic of China; 7Key Laboratory of Xinjiang Uygur Autonomous Region, Laboratory of Molecular Biology of Endemic Diseases, Urumqi, People’s Republic of China; 8State Key Laboratory of Pathogenesis, Prevention, and Treatment of High Incidence Diseases in Central Asia, Urumqi, People’s Republic of China
*These authors contributed equally to this work
Correspondence: Yuping Sun, Department of Microbiology, Xinjiang Medical University, No. 567 Shangde North Road, Shuimogou District, Urumqi, Xinjiang, 830017, People’s Republic of China, Email [email protected]
Background: Hyperuricemia (HUA) is a metabolic disorder caused by an imbalance between uric acid (UA) production and excretion. It is closely associated with various diseases, including gout and kidney disease. The intestines play a significant role in UA excretion, and emerging evidence suggests that gut microbiota modulate UA excretion and degradation. However, the specific functional microbial biomarkers and their roles in HUA remain underexplored.
Methods: Based on this, we hypothesize that the Mendelian randomization (MR) analysis method can be used to identify and define microbial biomarkers associated with HUA. Accordingly, we conducted an MR study using gut microbiota data from 18,340 participants across 24 distinct cohorts, including 129 HUA patients and 352,232 controls, to investigate the causal relationship.
Results: We found that the genus Ruminococcus was linked to a lower risk of HUA, while the family Clostridiaceae was associated with a higher risk of HUA. Clinical validation showed that high Clostridiaceae and low Ruminococcus abundance could distinguish HUA patients from healthy individuals, and the predictive diagnostic efficacy of Clostridiaceae was better. The combined model further enhanced diagnostic accuracy.
Conclusion: Our findings provide important information on the micro-biome features of HUA and novel insights into the further determination of the roles of the involved microorganisms, providing a reference for disease diagnosis and the development of microbial therapies.
Keywords: gut microbiome, hyperuricemia, Mendelian randomization, diagnostic model
Introduction
Hyperuricemia (HUA) is a metabolic disorder resulting from an imbalance between uric acid (UA) production and excretion. If not treated promptly, HUA can lead to severe health consequences, including gout and kidney disease.1 The prevalence of HUA varies geographically, with reported rates of 16.4% in China,2 21% in the United States,3 and 26.6% in South Korea.4 Factors such as high-purine diets, alcohol consumption, hypertension, hypothyroidism, and obesity contribute to the rising incidence of HUA, making it a significant public health concern worldwide.5
The key to treating HUA is reducing UA production and accelerating its excretion. UA is primarily eliminated through renal and intestinal pathways, with the latter accounting for approximately one-third of total UA excretion. For patients with HUA and renal insufficiency, intestinal excretion becomes particularly important.6 Studies found that the gut microbiome is vital in regulating UA excretion and degradation.7–9 Metabolites such as short-chain fatty acids produced by gut microbiota stimulate intestinal motility, thereby promoting the excretion of intestinal UA.10–12 Moreover, specific enzymes secreted by gut microbiota have been implicated in UA degradation.13,14 Despite these advances, the precise identity of key microbial players and their mechanistic roles in HUA pathogenesis remain to be fully elucidated. While preliminary studies have documented gut microbiome differences between HUA patients and healthy individuals,15 large-scale cohort studies are essential to validate these findings and to pinpoint the specific microorganisms involved in UA metabolism.
Considering the growing recognition of the gut microbiome’s role in HUA, we conducted a two-sample Mendelian randomization (MR) analysis using 16S rRNA gene sequencing data from gut microbiomes. Our analysis included a population of 352,232 healthy and 129 HUA patients, aiming to identify microbial biomarkers that distinguish HUA patients from healthy controls. Through this approach, we sought to validate our findings using clinical sample data. Our results revealed that microbial taxa of the family Clostridiaceae are enriched in HUA patients, while the genus Ruminococcus exhibits significantly higher abundance in healthy individuals. Our findings offer novel perspectives for identifying microbial groups that play a pivotal role in intestinal uric acid metabolism, providing valuable insights for the prevention and diagnosis of hyperuricemia through gut microbial biomarkers, and highlighting potential targets for the development of microbial-based therapeutics.
Materials and Methods
Study Design
This study employed Genome-Wide association studies (GWAS) data on intestinal microbiota from the Mibiogen consortium and the GWAS data on HUA from the FinnGen research project to conduct a two-sample MR analysis to explore the causal relationship between the abundance of 211 gut microbial taxa and HUA.16 Then, a reverse MR analysis was performed to avoid the potential effects of reverse causality. Notably, we followed the STROBE-MR statement strictly in this analysis.17 Finally, clinical samples were used to authenticate the MR findings, with the results depicted through an ROC curve (Figure 1).
 |
Figure 1 Flowchart of the study design. (A) Data sources for outcome. (B) Quality control. (C) Two-sample MR analysis and reverse MR analysis. (D) Clinical validation. |
Data Sources
The MiBioGen consortium is an extensive repository, meticulously compiling and analyzing genome-wide genotype and 16S fecal microbiome data. This information-rich dataset encompasses 18,340 participants from 24 distinct cohorts,18,19 all from European populations.20 HUA data were collected from the FinnGen database. We identified Instrumental variables (IVs) linked to HUA from the most recent release of the FinnGen research, which included R10 data from 129 cases and 352,232 controls.21 FinnGen is a significant database containing biological samples that have been genotyped from 500,000 individuals of Finnish descent.22
Instrumental Variables
This study collected 211 bacterial features at five biological levels to analyze 211 bacterial taxonomic units and elucidate the bidirectional causal link between HUA and the intestinal microbiota.
To guarantee the accuracy and validity of the findings on the causal association between the gut microbiome and HUA, the criteria used in the selection of IVs were: (1) Based on prior MR investigations of the gut microbiota, SNPs correlated with each specific gut microbiome were detected using the genome-wide significance threshold (P < 1×10⁻⁵).23 (2) To fulfill the criteria for MR analysis, we conducted a linkage disequilibrium (LD) examination utilizing data from the European Thousand Genome Project, which requires an R2 < 0.001 for IVs and LD = 10,000 kb. (3) We analyzed the reliability of the IVs by calculating the F-statistic, which quantifies the strength of the genetic variant. IVs with F-statistics ≤ 10 were deemed weak instrumental variables recommended for exclusion.24 When performing reverse MR analysis, the Wald ratio method was employed for MR analysis when only a single SNP IV was available.
MR Analysis
To assess if the gut microbiota and HUA are causally related, we conducted a two-sample MR analysis using summary statistics from the MiBioGen and FinnGen consortia. All of the analyses were carried out via two-sample MR analysis using R (version 4.3.1) and the R package for MR (version 0.5.7).25 The R2 was calculated as follows:

When evaluating how strongly IVs and exposure relate to one another, we computed the F-statistic using the formula:
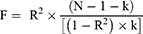
where R2 is the proportion of phenotypic variation described by SNPs and k is the number of SNPs included in the instrument.26 When the F-statistic’s threshold was more than 10, it was deemed statistically significant, meaning that weak instrumental bias had no impact on the causal relationship.27
Using the inverse variance weighted (IVW) method, we computed the MR estimate based on multiple IVs, with significance determined by the magnitude of the P value.28 Then we utilized MR-Egger, the Weighted median (WM), and MR-PRESSO to verify the stability of the IVW results.29
Subsequently, sensitivity analyses were conducted to ensure the robustness of our results. Heterogeneity was examined using Cochran’s Q-test (considered significant at P < 0.05).30
Pleiotropy refers to a scenario where one genetic locus influences multiple phenotypes. MR-Egger evaluates whether genetic variation exhibits pleiotropic influences on outcomes divergent from zero on average (directional pleiotropy) and offers reliable estimates of causal impacts under the weaker InSIDE assumption.31 The WM method provides precise estimates of causality. Outliers were detected and corrected after removing abnormal IVs using the MR-PRESSO test.31 The outcomes from MR sensitivity analysis methods demonstrated robust concordance with the IVW approach (P < 0.05). Finally, a reverse magnetic resonance study examined the causative relationship between the intestinal microbiota and HUA.
Clinical Validation
Study Population
In this study, participants aged between 20 and 60 were recruited from Balikun County Hospital in Xinjiang Province, China, between September 2019 and July 2021. After the baseline demographic indicators were recorded, the patients were categorized into a control group (n = 57) and an HUA group (men > 7 mg/dL; women ≥ 6 mg/dL; n = 50) based on their serum UA level.
To ensure comparability between groups, we excluded patients who had renal insufficiency, liver damage, gastrointestinal disease, neoplasia, or hematologic disease or who received antibiotics or microbial agents during the month before the study. The Medical Ethics Committee of the First Affiliated Hospital of Xinjiang Medical University approved this study. All procedures were performed according to the established rules of the ethics committee. All participants received a thorough explanation before being included in the study and informed written consent was obtained from them.
Sample Collection, DNA Extraction, and Sequencing
In this research, following defecation, fecal samples were promptly collected in a centrifuge tube that had been sterilized and stored at −80°C for subsequent analysis. For every sample, a bead-beating technique was used to extract bacterial DNA. DNA quality was assessed through electrophoresis on a 0.8% agarose gel.32 The V3-V4 region of the bacterial 16S rDNA genes was then amplified using the extracted DNA as a template. Finally, Shanghai Pisenno Biotech Co. performed the Illumina NovaSeq sequencing proc and the DNA extraction. After obtaining the raw sequencing data, we obtained ASVs from the denoised reads using DADA233 and then mapped against the Greengenes database (13.8v) by using the QIIME2 platform.34 OTUs were classified with a 97% similarity threshold using Vsearch. The sequences with the highest abundance were defined as representative sequences, which were subsequently annotated and blasted against the SILVA database (release 123) employing the RDP classifier. Ultimately, an OUT table was made for subsequent analysis.
Statistical Analysis
Initially, all datasets were assessed to ensure adherence to the normal distribution and variance homogeneity. Upon meeting these criteria, group distinctions were evaluated using a paired t-test.35 To compare various groups, we utilized a one-way analysis of variance (ANOVA).36 When the variables deviated from a normal distribution, either the Wilcoxon rank-sum test37 or the Kruskal–Wallis Rank test38 was used. This statistical methodology guarantees a thorough, precise, and refined data evaluation. The chi-square test was employed for statistical data analysis and comparison.39 The discriminative capacity of the biomarkers was assessed by calculating the area under the ROC curve (AUC).40 Statistical analyses were performed using R version 4.2.0, with significance defined as P < 0.05.
Results
IV Selection
Following quality control procedures, 2818 SNPs linked to 211 bacterial species were chosen as IVs. The F-statistic, ranging from 14.58 to 88.42 with an average value of 21.69, was used to assess the variability of the human intestinal microbiota. All values exceeded the threshold of 10, indicating a decreased probability of bias occurrence.
Two-Sample MR
MR. Influence of the Gut Microbiota on HUA
We identified seven bacterial taxa that may have a potential causal relationship with HUA based on results from three IVW analysis methods (Figure 2). According to the IVW results, the order Rhodospirillales (OR. 0.34, 95% CI. 0.14–0.81, P = 0.02), order Enterobacteriales (OR. 0.14, 95% CI. 0.02–0.87, P = 0.04), order Bacillales (OR. 0.44, 95% CI. 0.21–0.93, P = 0.03), family Enterobacteriaceae (OR. 0.14, 95% CI. 0.02–0.87, P = 0.04), genus unclassified (id_2755) (OR. 0.29, 95% CI. 0.12–0.7, P = 0.01) and genus Ruminococcus (OR. 0.16, 95% CI. 0.04–0.62, P = 0.01) were correlated with a lower risk of HUA. Conversely, the family Clostridiaceae (OR: 5.66, 95% CI: 1.47–21.77, P = 0.01) was associated with a high risk of HUA.
 |
Figure 2 Investigating the causal relationship between specific gut microbiota and HUA. (A) Overview of IVW findings for gut microbiota and HUA. (B) IVW results highlighting the causal connection between gut microbiota and HUA. Abbreviation: IVW, inverse-variance weighted. |
The WM method revealed that genus unclassified (id_2755) (OR. 0.31, 95% CI. 0.10–0.94, P = 0.04) and genus Ruminococcus (OR. 0.17, 95% CI. 0.03–0.93, P = 0.04) were linked to a lower risk of HUA, and the family Clostridiaceae (OR. 8.61, 95% CI. 1.49–49.60, P =0.02) were associated with a greater risk of HUA (Table S1). The Weight mode method, MR-EGGER, MR-PRESSO test (Table S2), and scatter plot (Figure S1) indicated a lack of horizontal pleiotropy or outliers, with a P value exceeding 0.05. Cochrane’s Q test (Table S2) revealed the absence of significant heterogeneity among the chosen SNPs, with P values exceeding 0.05. However, the leave-one-out strategy (Figure S2) showed that the outcomes were not significantly changed by eliminating any individual SNPs from the IVs.
Reverse MR Influence of HUA on the Gut Microbiota
The findings from the reverse MR analysis are presented in Figure S3, revealing no reverse causal relationship between HUA and the seven specific intestinal microbiota taxa investigated (P > 0.05) (Table S3).
Clinical Validation
Patient Demographics and Clinical Characteristics
Subsequently, a retrospective clinical analysis was performed to investigate the relationship between HUA and the intestinal flora. The study included 107 patients, as outlined in Table 1. Among them, 50 patients were allocated to the HUA group, while 57 patients were assigned to the control group. Statistically significant differences were not observed in age, BMI, SBP, DBP, AST, ALT, TC, LDL-C, or Cre between patients with and without HUA. However, in the group with higher UA, the TG, HDL-C, BUN, UA, and GLU levels were greater.
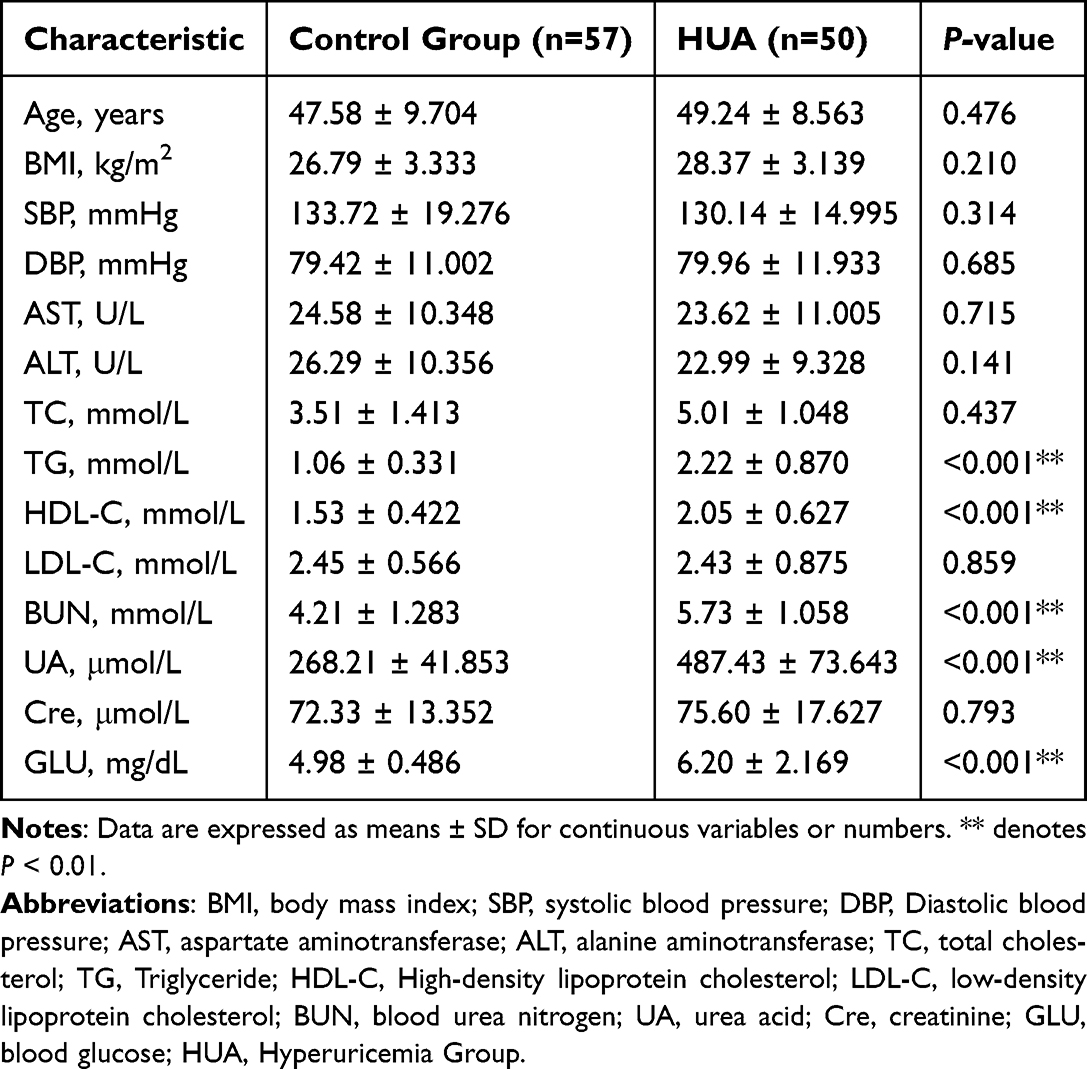 |
Table 1 Baseline Characteristics of the Included Participants |
HUA Altered the Diversity and Composition of the Intestinal Bacterial Community
The species accumulation curves shown in Figure 3A and the dilution curve illustrated in Figure 3B indicate that the sample size was sufficient and that the sequencing depth met the required criteria. The alpha diversity indices, including the Chao1 index, Shannon index, and Simpson index, confirmed notable differences in gut microbial diversity between the HUA and control groups (based on ANOVA or Kruskal–Wallis tests, Chao1 index, P = 0.00021; Shannon’s index, P = 0.0049; Simpson’s index, P = 0.00094; Figure 3C). To better understand the differences in richness among the HUA and control groups, a Venn diagram was generated to illustrate the overlap between groups (Figure 3D). We found that the control group had 1226 OTUs, and the HUA group had 2938 OTUs, with 1653 overlapping OTUs. The findings indicated differences in gut microbiota composition between the HUA and control groups.
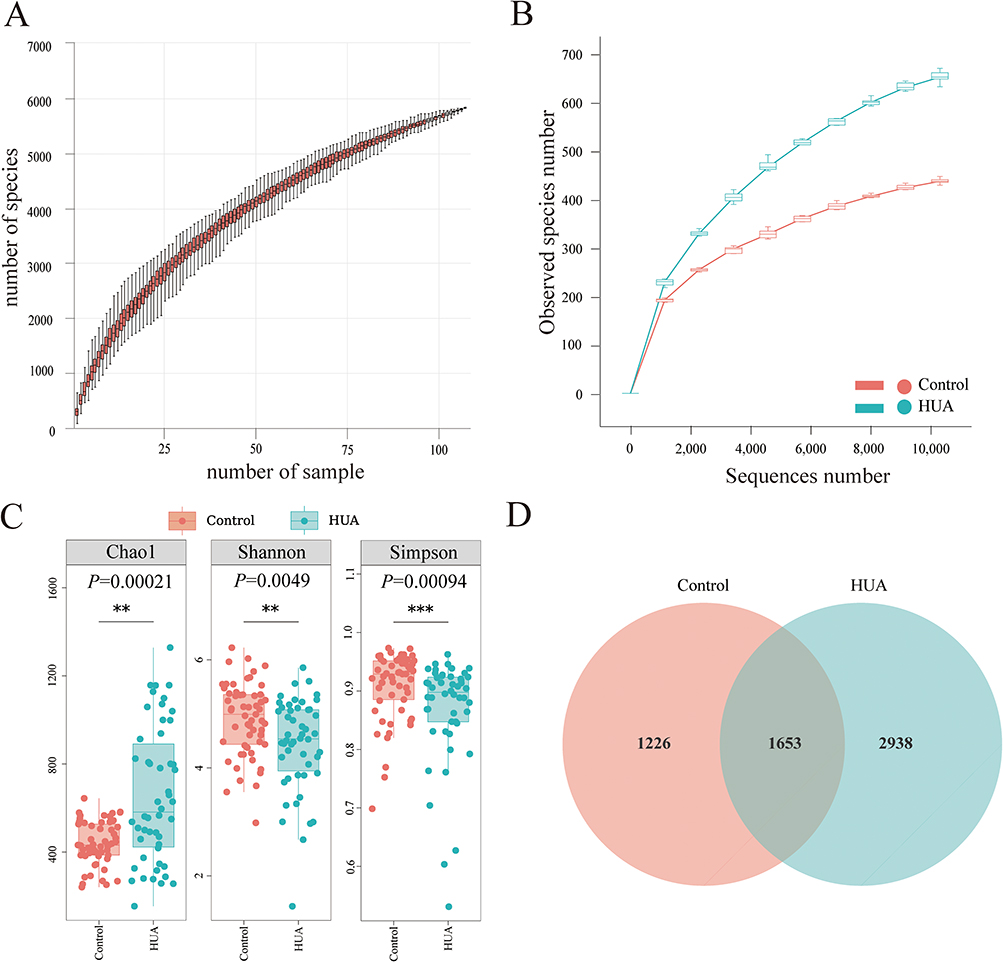 |
Figure 3 Analysis of alpha diversity among distinct groups. (A) The species accumulation curve was constructed by assigning the sample number to the x-axis and the quantity of observed species to the y-axis. These curves illustrate the progression of species counts with increasing sample size. (B) The rarefaction curve is plotted with the number of sequences along the x-axis and the count of observed species on the y-axis. This curve depicts the associations among the observed species and sequences. The curve’s “plateaued” configuration signifies that a sufficient number of samples/sequences have been acquired to encompass the majority of species. (C) The alpha diversity indices included the Chao1, Shannon, and Simpson indices. (D) Each circle within the Venn diagram symbolizes a group identified by the corresponding color-coded name. The figures within the overlapping regions denote the number of OTUs shared among their respective groups, while the figures within each distinct area indicate the number of OTUs specific to the corresponding group. ** denotes P < 0.01; *** denotes P < 0.001. |
Subsequently, to reinforce the evidence of variations in species diversity among the samples, PCoA, PCA, and NMDS analyses were employed (Figure 4). The findings demonstrated a notable difference in the structure of the intestinal microbiota between the HUA group and the control group. Overall, our findings suggest a considerable shift in the composition of the intestinal microbial population within the HUA group.
 |
Figure 4 Analysis of microbial beta diversity. (A and B) weighted UniFrac PCoA and unweighted UniFrac PCoA. On the x- and y-axes, PC1 and PC2 represent the two principal discrepancy components between groups, with the percentage in brackets indicating the contribution of each component to the discrepancies. The dots on the plot represent individual samples. Samples within the same group are color-coded identically. (C) PCA. (D) NMDS analysis. |
Microbial Biomarker Detection in HUA Patients and Controls
Violin plots were constructed to compare the relative abundance of Clostridiaceae and Ruminococcus in the two groups, and the HUA group exhibited a significantly elevated relative abundance of Clostridiaceae (Figure 5A). In contrast, Ruminococcus exhibited a decreased presence within the same group (Figure 5B). Given the above results, ROC analysis was employed to evaluate Clostridiaceae and Ruminococcus to discriminate between HUA patients and healthy controls. The analysis revealed that Clostridiaceae attained an area under the ROC curve of 0.879 (95% CI 0.815 to 0.944), while Ruminococcus achieved an area under the ROC curve of 0.635 (95% CI = 0.528 to 0.743). Additionally, the combined model incorporating both Clostridiaceae and Ruminococcus demonstrated an AUC of 0.881 (95% CI 0.817 to 0.946) (Figure 5C), revealing that both individual algorithms exhibited consistent stability, with Clostridiaceae leading to superior prediction results compared to Ruminococcus, while the combined model further enhanced diagnostic accuracy, underscoring its potential as a noninvasive diagnostic tool for HUA.
 |
Figure 5 (A) Differences in Clostridiaceae abundance between HUA patients and healthy controls; (B) Differences in Ruminococcus abundance among HUA patients and controls; (C) ROC curve analysis for Clostridiaceae and Ruminococcus (compared with healthy controls). * denotes P < 0.05; *** denotes P < 0.001. |
Discussion
In this study, we identified seven gut microbial taxa associated with HUA using GWAS summary statistics from FinnGen and MiBioGen. Notably, the genetically defined abundance of Ruminococcus was found to be causally protective against HUA (OR 0.16, 95% CI. 0.04–0.62, P = 0.01), while a genetically predicted increase in Clostridiaceae abundance was associated with a causal risk effect (OR 5.66, 95% CI. 1.47–21.77, P = 0.01). Our results showed no significant heterogeneity or horizontal pleiotropy, indicating a high degree of stability and reliability. Clinical sample validation demonstrated that an elevated Clostridiaceae and a decreased prevalence of Ruminococcus could distinguish HUA patients from healthy individuals, and the predictive diagnostic efficacy of Clostridiaceae was better. Furthermore, the combined diagnostic model incorporating both Clostridiaceae and Ruminococcus exhibited an AUC of 0.881 (95% CI 0.817–0.946), further enhancing diagnostic accuracy. Our results highlight a significant relationship between specific bacterial and HUA, highlighting the potential of integrating gut microbiota into diagnostic strategies and mechanistic studies of HUA. While serum UA levels remain the standard for HUA diagnosis in clinical practice, accurately predicting the onset and progression of HUA remains challenging. Our study established a diagnostic model for HUA utilizing gut microbial biomarkers, which may assist clinicians in achieving more efficient and accurate diagnoses.
Accumulating evidence links specific dysbiosis of intestinal microbiota to aberrant purine metabolism in HUA.41 Recent advances highlight that gut microbiota can affect urate homeostasis through enzymatic breakdown of urate,42 regulation of intestinal barrier integrity,43 and modulation of renal urate transporters.44 For instance, gut microbiota-derived SCFAs modulate renal URAT1 expression, thereby influencing urate reabsorption.45 Additionally, recent studies have identified a significant link between gut barrier dysfunction and elevated serum uric acid levels, highlighting the role of gut microbiota in promoting systemic inflammation and contributing to urate accumulation.46 In this study, we observed lower abundance of Ruminococcus in HUA patients. Previous studies have reported that members of this genus produce SCFAs, which play a crucial role in maintaining intestinal health and regulating inflammation.47 SCFAs, such as butyrate, are known to enhance colonic mucin synthesis through histone deacetylase inhibition,48 thereby reducing intestinal bacterial absorption of urate. These mechanisms highlight the protective function of Ruminococcus in HUA by modulating both intestinal and renal urate metabolism. Additionally, we observed higher abundance of Clostridiaceae in HUA patients. Research has shown that Clostridium acidurici, a member of this family, can utilize purines like uric acid as carbon, nitrogen, and energy sources.49 This process involves enzymes such as xanthine dehydrogenase and glycine cleavage systems.49 Another study showed that Clostridiaceae encode a conserved gene cluster to metabolize uric acid into short-chain fatty acids, highlighting their role in uric acid metabolism.50 Our findings provide novel genetic evidence indicating a causal relationship between Clostridiaceae and HUA, which has not been confirmed in previous studies. Our findings suggest that the elevated presence of Clostridiaceae could function as a noninvasive diagnostic biomarker for HUA, presenting a promising avenue for therapeutic strategies. Further research is required to confirm and elucidate the underlying mechanisms involved.
This study has a few drawbacks. First and foremost, the results for Clostridiaceae were only achieved at the family level and not at the genus or species level, which may be because the data used in the current study is only based on amplicon sequencing. Therefore, in further studies, high-quality and in-depth metagenomic sequencing data are needed to obtain more precise results. Second, although we found specific microbiota that could be associated with HUA, the correlation between gut microbes and UA metabolism is intricate and varied. It is important to further investigate how these bacteria contribute to the development of HUA. With the development of gut microbiome sequencing technology, further genetic association and clinical studies are needed for in-depth elucidation and validation of the functions of specific relevant gut microbes using their culture representatives.
Conclusion
In this study, we employed MR analysis to investigate the causal relationship between specific gut microbial taxa and HUA. Our results identified seven bacterial species associated with HUA risk, with Clostridiaceae showing a significant positive association and Ruminococcus demonstrating a protective effect. Clinical validation via ROC analysis confirmed that high Clostridiaceae abundance and low Ruminococcus abundance could effectively distinguish HUA patients from healthy individuals. The combined model incorporating both taxa showed an AUC of 0.881, further enhancing diagnostic accuracy. These findings highlight the potential of gut microbial biomarkers as non-invasive diagnostic tools for HUA, offering a novel perspective on disease pathogenesis and management. Furthermore, the identified microbial signatures may serve as therapeutic targets for microbiota-based interventions. However, the mechanistic underpinnings of these associations require further exploration. Future large-scale cohort studies are warranted to validate the clinical utility of these biomarkers and to investigate their potential role in personalized medicine approaches for HUA.
Abbreviations
HUA, Hyperuricemia; UA, uric acid; MR, Mendelian randomization; LD, linkage disequilibrium; WM, Weighted median; SNP, single nucleotide polymorphism; IVW, inverse variance weighted; GWAS, genome-wide association studies; IVs, instrumental variables; ANOVA, a one-way analysis of variance; AUC, area under the curve; ROC, Receiver Operating Characteristic curve.
Data Sharing Statement
Data on gut microbiota can be obtained through www.mibiogen.org, and the HUA dataset can be found at https://www.finngen.fi/. The 16S sequencing data on gut microbiomes are publicly available and can be found here: NCBI repository, accession number PRJNA1199342.
Ethics Approval and Consent to Participate
The authors are accountable for all aspects of the work in ensuring that questions related to the accuracy or integrity of any part of the work are appropriately investigated and resolved. This study was approved by the Xinjiang Medical University First Affiliated Hospital Medical Ethics Committee (No. K202105-09) and followed the guidelines of the Declaration of Helsinki (as revised in 2013). All procedures were performed according to the established rules of the ethics committee. All participants received a thorough explanation before being included in the study, and informed written consent was obtained from them.
Acknowledgments
Dilinuer Aikepa, Yi He and Wujin Chen are co-first authors for this study. The authors appreciate the participants and investigators involved in all GWAS included in this study. The authors also express gratitude to the MiBioGen Consortium and the FinnGen research project for providing access to the summary data.
Author Contributions
All authors made a significant contribution to the work reported, whether that is in the conception, study design, execution, acquisition of data, analysis and interpretation, or in all these areas; took part in drafting, revising or critically reviewing the article; gave final approval of the version to be published; have agreed on the journal to which the article has been submitted; and agree to be accountable for all aspects of the work.
Funding
Funds from the National Natural Science Foundation of China (82260182), Xinjiang Uygur Autonomous Region Postgraduate Research Innovation Project (XJ2024G174), the Science and Technology Plan Project in Xinjiang Karamay City (20232023hjcxrc0084), the Xinjiang Uygur Autonomous Region Key Laboratory Open Project (2020D04024), and the Institute of Medical Sciences of Xinjiang Medical University Open Project (YXYJ20230204) were used to support this work. The authors thank the State Key Laboratory of Pathogenesis, Prevention, and Treatment of High-Incidence Diseases in Central Asia and the Laboratory of Molecular Biology of Endemic Diseases, Xinjiang Medical University, for providing all necessary equipment.
Disclosure
The authors declare that the research was conducted in the absence of any commercial or financial relationships that could be construed as a potential conflict of interest.
References
1. Du L, Zong Y, Li H, et al. Hyperuricemia and its related diseases: mechanisms and advances in therapy. Signal Transduct Target Ther. 2024;9(1):212. doi:10.1038/s41392-024-01916-y
2. Chen J, Xu L, Jiang L, et al. Sonneratia apetala seed oil attenuates potassium oxonate/hypoxanthine-induced hyperuricemia and renal injury in mice. Food Funct. 2021;12(19):9416–9431. doi:10.1039/d1fo01830b
3. Singh G, Lingala B, Mithal A. Gout and hyperuricaemia in the USA: prevalence and trends. Rheumatology. 2019;58(12):2177–2180. doi:10.1093/rheumatology/kez196
4. Koo BS, Jeong HJ, Son CN, et al. Distribution of serum uric acid levels and prevalence of hyper- and hypouricemia in a Korean general population of 172,970. Korean J Intern Med. 2021;36(Suppl 1):S264–s272. doi:10.3904/kjim.2020.116
5. Li L, Zhang Y, Zeng C. Update on the epidemiology, genetics, and therapeutic options of hyperuricemia. Am J Transl Res. 2020;12(7):3167–3181.
6. Su HY, Yang C, Liang D, et al. Research advances in the mechanisms of hyperuricemia-induced renal injury. Biomed Res Int. 2020;2020:5817348. doi:10.1155/2020/5817348
7. Xie WR, Yang XY, Deng ZH, et al. Effects of washed microbiota transplantation on serum uric acid levels, symptoms, and intestinal barrier function in patients with acute and recurrent gout: a pilot study. Dig Dis. 2022;40(5):684–690. doi:10.1159/000521273
8. Kasahara K, Kerby RL, Zhang Q, et al. Gut bacterial metabolism contributes to host global purine homeostasis. Cell Host Microbe. 2023;31(6):1038–1053.e1010. doi:10.1016/j.chom.2023.05.011
9. Cao J, Wang T, Liu Y, et al. Lactobacillus fermentum F40-4 ameliorates hyperuricemia by modulating the gut microbiota and alleviating inflammation in mice. Food Funct. 2023;14(7):3259–3268. doi:10.1039/d2fo03701g
10. Park H-K, Lee SJ. Treatment of gouty arthritis is associated with restoring the gut microbiota and promoting the production of short-chain fatty acids. Arthritis Res Therapy. 2022;24(1):51. doi:10.1186/s13075-022-02742-9
11. Martínez-Nava GA, Méndez-Salazar EO, Vázquez-Mellado J, et al. The impact of short-chain fatty acid–producing bacteria of the gut microbiota in hyperuricemia and gout diagnosis. Clin Rheumatol. 2023;42(1):203–214. doi:10.1007/s10067-022-06392-9
12. Méndez-Salazar EO, Martínez-Nava GA. Uric acid extrarenal excretion: the gut microbiome as an evident yet understated factor in gout development. Rheumatol Int. 2022;42(3):403–412. doi:10.1007/s00296-021-05007-x
13. Meng Y, Hu Y, Wei M, et al. Amelioration of hyperuricemia by Lactobacillus acidophilus F02 with uric acid-lowering ability via modulation of NLRP3 inflammasome and gut microbiota homeostasis. J Funct Foods. 2023;111:105903. doi:10.1016/j.jff.2023.105903
14. Yamada N, Saito-Iwamoto C, Nakamura M, et al. Lactobacillus gasseri PA-3 uses the purines IMP, inosine and hypoxanthine and reduces their absorption in rats. Microorganisms. 2017;5(1):10. doi:10.3390/microorganisms5010010
15. Chu Y, Sun S, Huang Y, et al. Metagenomic analysis revealed the potential role of gut microbiome in gout. NPJ Biofilms Microbiomes. 2021;7(1):66. doi:10.1038/s41522-021-00235-2
16. Davey Smith G, Hemani G. Mendelian randomization: genetic anchors for causal inference in epidemiological studies. Hum Mol Genet. 2014;23(R1):R89–98. doi:10.1093/hmg/ddu328
17. Skrivankova VW, Richmond RC, Woolf BAR, et al. Strengthening the reporting of observational studies in epidemiology using Mendelian randomization: the STROBE-MR statement. JAMA. 2021;326(16):1614–1621. doi:10.1001/jama.2021.18236
18. Wang J, Kurilshikov A, Radjabzadeh D, et al. Meta-analysis of human genome-microbiome association studies: the MiBioGen consortium initiative. Microbiome. 2018;6(1):101. doi:10.1186/s40168-018-0479-3
19. Kurilshikov A, Medina-Gomez C, Bacigalupe R, et al. Large-scale association analyses identify host factors influencing human gut microbiome composition. Nat Genet. 2021;53(2):156–165. doi:10.1038/s41588-020-00763-1
20. Li Y, Liang X, Lyu Y, et al. Association between the gut microbiota and nonalcoholic fatty liver disease: a two-sample Mendelian randomization study. Dig Liver Dis. 2023;55(11):1464–1471. doi:10.1016/j.dld.2023.07.014
21. Liu K, Zou J, Fan H, et al. Causal effects of gut microbiota on diabetic retinopathy: a Mendelian randomization study. Front Immunol. 2022;13:930318. doi:10.3389/fimmu.2022.930318
22. Kurki MI, Karjalainen J, Palta P, et al. FinnGen provides genetic insights from a well-phenotyped isolated population. Nature. 2023;613(7944):508–518. doi:10.1038/s41586-022-05473-8
23. Cheng Q, Yang Y, Shi X, et al. MR-LDP: a two-sample Mendelian randomization for GWAS summary statistics accounting for linkage disequilibrium and horizontal pleiotropy. NAR Genom Bioinform. 2020;2(2):lqaa028. doi:10.1093/nargab/lqaa028
24. Burgess S, Small DS, Thompson SG. A review of instrumental variable estimators for Mendelian randomization. Stat Methods Med Res. 2017;26(5):2333–2355. doi:10.1177/0962280215597579
25. Mounier N, Kutalik Z. Bias correction for inverse variance weighting Mendelian randomization. Genet Epidemiol. 2023;47(4):314–331. doi:10.1002/gepi.22522
26. Palmer TM, Lawlor DA, Harbord RM, et al. Using multiple genetic variants as instrumental variables for modifiable risk factors. Stat Methods Med Res. 2012;21(3):223–242. doi:10.1177/0962280210394459
27. Zuber V, Colijn JM, Klaver C, et al. Selecting likely causal risk factors from high-throughput experiments using multivariable Mendelian randomization. Nat Commun. 2020;11(1):29. doi:10.1038/s41467-019-13870-3
28. Brion MJ, Shakhbazov K, Visscher PM. Calculating statistical power in Mendelian randomization studies. Int J Epidemiol. 2013;42(5):1497–1501. doi:10.1093/ije/dyt179
29. Burgess S, Bowden J, Fall T, et al. Sensitivity analyses for robust causal inference from Mendelian randomization analyses with multiple genetic variants. Epidemiology. 2017;28(1):30–42. doi:10.1097/ede.0000000000000559
30. Aslam M. Cochran’s Q test for analyzing categorical data under uncertainty. J Big Data. 2023;10(1). doi:10.1186/s40537-023-00823-3
31. Burgess S, Thompson SG. Interpreting findings from Mendelian randomization using the MR-Egger method. Eur J Epidemiol. 2017;32(5):377–389. doi:10.1007/s10654-017-0255-x
32. O’connor LJ, Price AL. Distinguishing genetic correlation from causation across 52 diseases and complex traits. Nat Genet. 2018;50(12):1728–1734. doi:10.1038/s41588-018-0255-0
33. Callahan BJ, Mcmurdie PJ, Rosen MJ, et al. DADA2: high-resolution sample inference from Illumina amplicon data. Nat Methods. 2016;13(7):581–583. doi:10.1038/nmeth.3869
34. Ponzo V, Ferrocino I, Goitre I, et al. Non-celiac gluten/wheat sensitivity: clinical characteristics and microbiota and mycobiota composition by response to the gluten challenge test. Nutrients. 2021;13(4):1260. doi:10.3390/nu13041260
35. Xu M, Fralick D, Zheng JZ, et al. The differences and similarities between two-sample T-test and paired T-test. Shanghai Arch Psychiatry. 2017;29(3):184–188. doi:10.11919/j.issn.1002-0829.217070
36. Chatzi A, Doody O. The one-way ANOVA test explained. Nurse Res. 2023;31(3):8–14. doi:10.7748/nr.2023.e1885
37. Datta S, Satten GA. Rank-sum tests for clustered data. J Am Stat Assoc. 2005;100(471):908–915. doi:10.1198/016214504000001583
38. Mckight PE, Najab J. Kruskal-Wallis Test. Corsini Encyclop Psychol. 2010;2010:1.
39. Rana RK, Singhal R. Chi-square test and its application in hypothesis testing. J Pract Cardiovasc Sci. 2015;1:169–171. doi:10.1002/9781119454205.ch9
40. Marius OU. Comparison of two or more correlated AUCs in paired sample design. J Nat Sci Res. 2019;9:43–56.
41. Brunkwall L, Orho-Melander M. The gut microbiome as a target for prevention and treatment of hyperglycaemia in type 2 diabetes: from current human evidence to future possibilities. Diabetologia. 2017;60(6):943–951. doi:10.1007/s00125-017-4278-3
42. Lin A, Sun Z, Xu X, et al. Self-cascade uricase/catalase mimics alleviate acute gout. Nano Lett. 2022;22(1):508–516. doi:10.1021/acs.nanolett.1c04454
43. Jing Y, Wang Q, Bai F, et al. Age-related alterations in gut homeostasis are microbiota dependent. NPJ Biofilms Microbiomes. 2025;11(1):51. doi:10.1038/s41522-025-00677-y
44. Xue M, Du R, Zhou Y, et al. Fucoidan supplementation relieved kidney injury and modulated intestinal homeostasis in hyperuricemia mice. J Agric Food Chem. 2024;72(49):27187–27202. doi:10.1021/acs.jafc.4c07209
45. Li Y, Li L, Tian J, et al. Insoluble fiber in barley leaf attenuates hyperuricemic nephropathy by modulating gut microbiota and short-chain fatty acids. Foods. 2022;11(21):3482. doi:10.3390/foods11213482
46. Yang X, Liu D, Zhao X, et al. Hyperuricemia drives intestinal barrier dysfunction by regulating gut microbiota. Heliyon. 2024;10(16):e36024. doi:10.1016/j.heliyon.2024.e36024
47. Kawasaki K, Wada K, Sato A, et al. Effects of dietary bamboo (Phyllostachys pubescens Mazel) culm powder on blood properties and intestinal environment of rabbits. Anim Sci J. 2022;93(1):e13774. doi:10.1111/asj.13774
48. Hatayama H, Iwashita J, Kuwajima A, et al. The short chain fatty acid, butyrate, stimulates MUC2 mucin production in the human colon cancer cell line, LS174T. Biochem Biophys Res Commun. 2007;356(3):599–603. doi:10.1016/j.bbrc.2007.03.025
49. Hartwich K, Poehlein A, Daniel R. The purine-utilizing bacterium Clostridium acidurici 9a: a genome-guided metabolic reconsideration. PLoS One. 2012;7(12):e51662. doi:10.1371/journal.pone.0051662
50. Liu Y, Jarman JB, Low YS, et al. A widely distributed gene cluster compensates for uricase loss in hominids. Cell. 2023;186(20):4472–4473. doi:10.1016/j.cell.2023.08.036
 © 2025 The Author(s). This work is published and licensed by Dove Medical Press Limited. The
full terms of this license are available at https://www.dovepress.com/terms
and incorporate the Creative Commons Attribution
- Non Commercial (unported, 4.0) License.
By accessing the work you hereby accept the Terms. Non-commercial uses of the work are permitted
without any further permission from Dove Medical Press Limited, provided the work is properly
attributed. For permission for commercial use of this work, please see paragraphs 4.2 and 5 of our Terms.
© 2025 The Author(s). This work is published and licensed by Dove Medical Press Limited. The
full terms of this license are available at https://www.dovepress.com/terms
and incorporate the Creative Commons Attribution
- Non Commercial (unported, 4.0) License.
By accessing the work you hereby accept the Terms. Non-commercial uses of the work are permitted
without any further permission from Dove Medical Press Limited, provided the work is properly
attributed. For permission for commercial use of this work, please see paragraphs 4.2 and 5 of our Terms.