Back to Journals » Clinical Interventions in Aging » Volume 15
The Effect of Sociodemographics, Physical Function, and Mood on Dementia Screening in a Multicultural Cohort
Authors Tolea MI, Chrisphonte S, Galvin JE
Received 11 April 2020
Accepted for publication 28 October 2020
Published 2 December 2020 Volume 2020:15 Pages 2249—2263
DOI https://doi.org/10.2147/CIA.S257809
Checked for plagiarism Yes
Review by Single anonymous peer review
Peer reviewer comments 2
Editor who approved publication: Dr Richard Walker
Magdalena I Tolea, Stephanie Chrisphonte, James E Galvin
Comprehensive Center for Brain Health, Department of Neurology, University of Miami Miller School of Medicine, Miami, FL, USA
Correspondence: Magdalena I Tolea
Comprehensive Center for Brain Health, Department of Neurology, University of Miami Miller School of Medicine, 1120 NW 14th Street, Miami, FL 33136, USA
Tel +1 305-243-6732
Email [email protected]
Purpose: To assess age, sex, race and ethnicity disparities in cognitive function in community-dwelling older adults and identify factors that contribute to these disparities.
Patients and Methods: Cognitive performance (global and domain-specific) and self-reported cognitive function were compared among Black (N=57), Hispanic (N=139), and White (N=108) older adults. The impact of socioeconomic status (SES), physical functionality, and mood indicators was assessed with a combination of hierarchical general linear models and mediation analysis.
Results: Poorer cognitive performance and higher levels of impairment were found in older adults from racial and ethnic backgrounds. The contribution of lower SES to the observed racial and ethnic disparities in objective cognitive performance was 33% in Hispanics and about 20% in Blacks, while poorer physical functionality explained over half of the differences between Black and White participants. Higher self-reported cognitive impairment in minorities was explained by lower SES and higher depressive symptoms in Hispanics but not in Blacks.
Conclusion: Performance on objective memory testing and self-reported cognition are greatly influenced by relevant biological, sociodemographic and medical variables. Dementia screening programs should be tailored to individual sociodemographic groups based on contributors that are specific to each group.
Keywords: cognitive performance, subjective cognitive function, racial and ethnic disparities in cognition, age disparities in cognition, socioeconomic status and cognition, lower extremity function, cognition
Introduction
While advances have been made in the management of common age-related chronic conditions including cardiovascular disease and diabetes, leading to declining death rates from these conditions in recent years, dementia prevalence rates are expected to continue to rise. Factors contributing to these increasing prevalence trends include population aging coupled with increases in the burden of cardiovascular and metabolic risk factors, all significant contributors to cognitive decline and dementia.1,2 According to the National Center for Health Statistics, Alzheimer’s disease (AD), the most common form of dementia, is among the top 10 leading causes of death in the US accounting for 93,541 deaths or 4% of all-cause deaths in the year 2014.3 It is currently the fifth leading cause of death in adults aged 65y+, the subpopulation who makes up most of the 5+ million Americans living with AD.
Although age, sex, and racial disparities in AD have been well documented, only recently has the need to better understand the contribution of these factors to cognitive health and disease been identified and has been the focus of a number of funding opportunities through NIH. Older adults from racial and ethnic minority groups tend to underperform compared to similarly aged Whites in cognitive testing and to have a higher risk of cognitive impairment and dementia.4,5 An increased risk of dementia is also observed with increasing age, the strongest risk factor for dementia, and among women, although the later disparities are not consistent across cognitive domains. For example, while women outperform men on verbal abilities including verbal memory and fluency, they underperform them on spatial tasks such as mental rotation of objects particularly 3D objects.6–10 Similarly, although visuospatial and language abilities tend to remain stable over time, more complex cognitive skills such as executive function and memory tend to decline with age due to declines in sensory perception, psychomotor speed, and attention.11 These age-related cognitive changes are correlated to declines in gray matter volume and white matter integrity, cytoskeletal structure (dendritic, axonal and synaptic loss), and functional connectivity and are commonly observed in the brain areas that are important to these cognitive functions (eg hippocampus).12–15
Several modifiable risk factors for cognitive impairment and dementia have been identified including lower education, reduced physical function, and depressive symptoms, all of whom also vary as a function of age, sex, race, and ethnicity. Among older adults, those with low education perform poorer on global and specific measures of cognition such as reasoning and working memory and have an increased risk of dementia.16–19 These findings are supported by neuroimaging studies reporting greater levels of brain atrophy with decreasing education in older adults.20 According to the US Census Bureau, educational attainment varies by age, sex, and race and Hispanic ethnicity, suggesting that education may help explain the observed differences in cognitive function and risk of dementia.21 Depressive symptoms, another potential risk factor for dementia, are more prevalent in minority older adults (11.4%, 9.0%, 6.8% in Hispanics, Blacks, and Whites, respectively), in women (lifetime risk is 21.3% vs 12.7% in men) and with increasing age.22–25 Similarly, physical impairment and disability increase with age are more prevalent in women and minorities, and are found to precipitate cognitive decline and increase the risk of developing AD.26–30
Despite evidence of these socio-demographic disparities in cognition and owing to a lack of clear understanding of why they occur, recommendations for how best to detect cognitive impairment are not currently designed to account for them. However, the accuracy of dementia screening instruments and programs may be significantly improved by tailoring them to individual socio-demographic groups by including group-specific risk factors. This aligns with the call for research to evaluate the impact, accuracy, and harms attributed to dementia screening put out by the US Preventative Service Task.31 The current study was designed to address this call to improve the accuracy of dementia screening efforts by identifying the specific factors that are predictive of cognitive performance in sociodemographic groups categorized based on race, ethnicity, age, and sex.
Patients and Methods
Study participants were community-dwelling adults aged 55+ years enrolled in cognitive aging studies at NYU Langone Medical Center (NYULMC) between May 2012 and March 2015. A more detailed description of the sample is provided elsewhere; however, briefly, these studies were focused on the use of dementia screening tools and the identification of biomarkers of cognitive decline in the community and used few exclusion criteria so as to more closely represent a “real world” population.32 A total number of 348 participants were recruited through a combination of community outreach methods and word of mouth, and were invited to come into our research lab for a clinic visit or have their clinic visit at the facility at which they were initially recruited at (eg senior center, church). Standardized culturally sensitive assessment instruments (English or Spanish language) were used and socio-demographic data collected for all participants. Participants aged 55 years and older, who were fluent in either English or Spanish, and with valid data on performance-based cognitive assessments were included in this analysis.
A total of 304 participants were identified based on these inclusion criteria of whom 108 (35.5%) were non-Hispanic White (hereafter named White), 57 (18.8%) were non-Hispanic Black (hereafter named Black), and 139 (45.7%) were Hispanic. Of the 139 Hispanic participants, 102 (73.5%) are White, 20 (14.5%) are Black, and 17 (12%) are of other races (mostly American Indian/Alaskan). Participants included in this analysis did not differ from those excluded on the basis of sex (71.3% vs 57.1%, p=0.119), race (37.2% vs 23.5% White, p=0.100) or SES (mean ± SE: 1.13 ± 0.04 vs 0.90 ± 0.13, p=0.084) although they were older (mean age ± SE: 70.8y ±0.5 vs 57.0 ± 2.6, p<0.001). Virtually all participants had complete data on self-reported cognitive function and the vast majority (97%) on the performance-based cognitive outcomes of interest in the current study. The study protocol was approved by the NYULMC institutional review board and a written informed consent was provided by all participants prior to the initiation of any assessment.
Predictor Variables
Race and ethnicity were measured as a three-level variable: Non-Hispanic White, Non-Hispanic Black, and Hispanic. Hispanic ethnicity triggered a Hispanic categorization regardless of reported race. Twelve individuals reported American Indian as their race but also listed Hispanic as ethnicity and were therefore included in the Hispanic group. Non-Hispanic subjects who reported a race other than White and Black were excluded due to their low numbers. Sex was measured as a dichotomous variable (1=Male, 2=Female). Age was used in data analysis as both a continuous variable and as an ordinal-level variable with cut-points defined by tertiles (<67; 67–74; ≥74 years).
Outcome Measures
Several measures of cognitive function were assessed in this study. The Montreal Cognitive Assessment (MoCA) Scale consists of 13 items tapping into the following six cognitive domains including memory, language, visuospatial skills, executive function, attention/concentration, and orientation.33 A total score summing up sub-scores of these domains was used to measure global cognitive function, with an additional point allowed for ≤12 years of formal education, to account for differences in education.33 Total scores range from 0 to 30 with higher scores suggestive of better cognitive performance. A score of <26 is generally considered indicative of cognitive impairment.33
Domain scores were calculated according to the National Alzheimer’s Coordinating Center (NACC) Uniform Data Set (UDS) instructions as follows: executive function (trails, clock, digits, letter sequence, serial 7s, phonemic verbal fluency for a total of 13), language (naming, sentence repetition, and phonemic verbal fluency for a total of 6), visuospatial skills (figure copy, clock, and naming for a total of 7) and orientation for a total of 6. Memory and attention domains were scored based on un-cued recall (total of 5) for the former and digits, letter sequence, serial 7s, and sentence repetition (total of 8) for the latter. Scoring for these last two domains differed from NACC’s scoring scheme due to a lack of data on registration and cued recall in the study. The MoCA may be more sensitive in detecting subtle changes consistent with a mild cognitive impairment state compared to the Mini Mental State Examination and was therefore selected as our performance-based cognitive measure of choice.34,35 Two additional performance measures were also assessed: Trail Making A to assess psychomotor processing speed; and animal naming to assess semantic verbal fluency.36,37
Lastly, we measured subjective cognitive impairment with the AD8, an eight-item assessment tool designed to identify early cognitive changes as reported by the subjects.38,39 The AD8 items represent statements of change in abilities related to memory and thinking with responses measured on a 3-point scale: 0=No, no change; 1=Yes, a change; and 3=N/A or Do not Know. The total score is calculated by summing the “Yes, a change” responses (range: 0–8) with higher values being indicative of greater subjective cognitive complaints and a ≥2 cut-off used to define impaired cognition. The AD8 has been reported to be highly correlated with AD spinal fluid and neuroimaging biomarkers and has been validated across racial and ethnic groups.40–43
Mediators
Based on their reported relationships with both predictors and outcomes, SES, comorbidities, physical functionality, and depressive symptoms were assessed as potential mediators of the race-cognition association. SES was measured using the Hollingshead two-factor index of social position.44 The total score is obtained by summing weighted scores for the head of the household’s occupation and the subject’s educational attainment, both measured on 7-point scales with lower scores indicating better standing on the respective scale. For example, a score of 1 on the occupational scale captures occupations at the rank of higher executives, proprietors of large business, and major professionals while a score of 7 is used for unskilled employees. Similarly, scores on the educational scale range from 1 for graduate professional training to 7 for less than 7 years of school. Therefore, the lower the total score, the higher the social position is. A scoring algorithm is used that weights the occupational scale more than the educational scale and their sum is then used to create a 5-level social class variable (I: 11–17; II 18–27; III 28–43; IV 44–60; and V 61–70). Low SES was measured in this study as a social class of V, while social classes of III–IV were considered middle SES, and social classes of I–II as high SES. Comorbidities were measured with the Charlson Index in which the presence of several chronic conditions weighted to reflect their impact on mortality risk is summed up.45 Higher scores on the Charlson Index indicate greater comorbidity.
Physical functionality was measured with the Mini Physical Performance Test (mini-PPT), a brief 4-task tool that requires little time to complete and minimal resources (ie an armless chair).46 During the test, subjects are asked to bend over, pick up a penny from the floor, and then straighten back up at their normal pace. The time to completion is recorded in seconds. Time to walk over a 25-feet course at a normal pace and then return to the starting point is also recorded as is the time to complete a series of 5 chair raises (ie subjects start from a seated position with hands crossed over chest and proceed to stand and sit 5 times as fast as possible). Finally, a progressive Romberg balance test is performed in which balance is tested in a side-by-side, a semi-tandem, and a full tandem foot stance with subsequent stances attempted upon successful completion of previous stances. All tasks are scored on a 5-point Likert scale (score range: 0–4) with higher numbers indicating better function. For example, a ≤ 2 seconds time on the picking up a penny test triggers a score of 4 while inability to bend over, a score of 0 on this task. The total mini-PPT score is derived by adding the 4 sub-scores for a maximum of 16. A score of <12 is generally used to indicate poor physical function and increased risk of falling. The mini-PPT represents a shorter and modified version of the 9-item PPT test and was validated for use in both non-demented and mildly demented older adults.46,47
Depressive symptoms were measured with the depression subscale of the Hospital Anxiety and Depression Scale (HADS), which consists of seven items rated on a 4-point Likert-type scale (range: 0–3).48 The depressive symptoms score is computed by adding the scores for the individual items and ranges between 0 and 21, with higher scores indicating greater symptom severity. The scale is self-administered and was designed as a mood screen in the general non-psychiatric medical outpatient population.
Data Analysis
Demographics, cognitive and physical function, and depressive symptomatology were assessed in the overall sample and subgroups defined by race, sex, and age with chi-square and analysis of variance depending on whether the characteristic being investigated was categorical or continuous, respectively. Next, a series of hierarchical general linear regression models were run to assess racial/ethnic, age, and sex differences in cognitive performance (global and domains) and determine the impact of several factors hypothesized to be correlated with cognitive function. These investigated covariates included SES, physical functionality, and depression. Their contribution to the observed racial, ethnic, age, and sex disparities in cognitive function were assessed adding each of these significant covariates to an initial model including all predictors (ie race, ethnicity, age, and sex). A fully adjusted model was then run to determine the independent effect of SES, physical functionality, and depressive symptoms on demographic disparities in cognition. The effect of each covariate hypothesized to potentially mediate the observed demographic cognitive disparities was measured by comparing the adjusted regression coefficients for each predictor in the initial and extended models. A reduction of 20% in these coefficients was interpreted as being suggestive of mediational effects.
More formal mediation analyses were carried out with the Baron and Kenny approach using a series of multiple regression models to estimate the indirect effect of a predictor (eg race, ethnicity) on an outcome (eg MoCA) with consideration of the contribution of individual mediators. In the process, the total effect and the direct effect of the predictor were estimated as were the relationships between the predictor and the mediator under investigation (ie SES, physical functionality, depressive symptoms) and the relationship between the mediator and the outcome. The Sobel test was used to estimate the 95% confidence interval around the indirect effect using a free online calculator of the variance around the indirect effect based on regression coefficients and standard errors of associations tested with the Baron and Kenny mediation analysis. This free online calculator is available at http://www.quantpsy.org/sobel/sobel.htm.
Results
Sample Characteristics
Participants were on average 71.0 years old (±0.5SE), more than 2/3 were female, and about 20% were disadvantaged economically. Minorities were overrepresented in terms of the latter, with Blacks being more than three times and Hispanic more than 10 times more likely than Whites to be characterized as low SES (p<0.001). Blacks were also more likely to have impaired physical functionality (p<0.001), Hispanics endorsed more depressive symptoms (p=0.024) and more likely to self-report cognitive dysfunction (p=0.017), and both minority groups performed worse on cognitive testing (ie MoCA, p<0.001) than Whites. There were no significant differences between racial and ethnic groups in terms of average age (p=0.185) and the number of comorbidities (p=0.216) (Table 1). To further evaluate the potential impact of individual comorbidities likely to affect cognition, we compared racial and ethnic groups on self-reported diagnoses of thyroid disease and diabetes that were evaluated in the study. There were no differences by thyroid disease status (19.6% vs 12.1%, vs 15.3% in Whites, Blacks, and Hispanics, respectively, p=0.390), so thyroid disease was not included in further analyses. Although we found variation by diabetes between the groups (8.0%, vs 26.5%, vs 18.2% in Whites, Blacks, and Hispanics, respectively, p=0.004), diabetes status was not associated with cognitive performance or subjective cognitive impairment (βMoCA=−1.27±0.836, p=0.128; βAnimal naming=−1.873±1.016, p=0.067; βTMA=7.47±5.808, p=0.200; and βAD8=−0.09±0.301, p=0.757), and was also not included in further analyses.
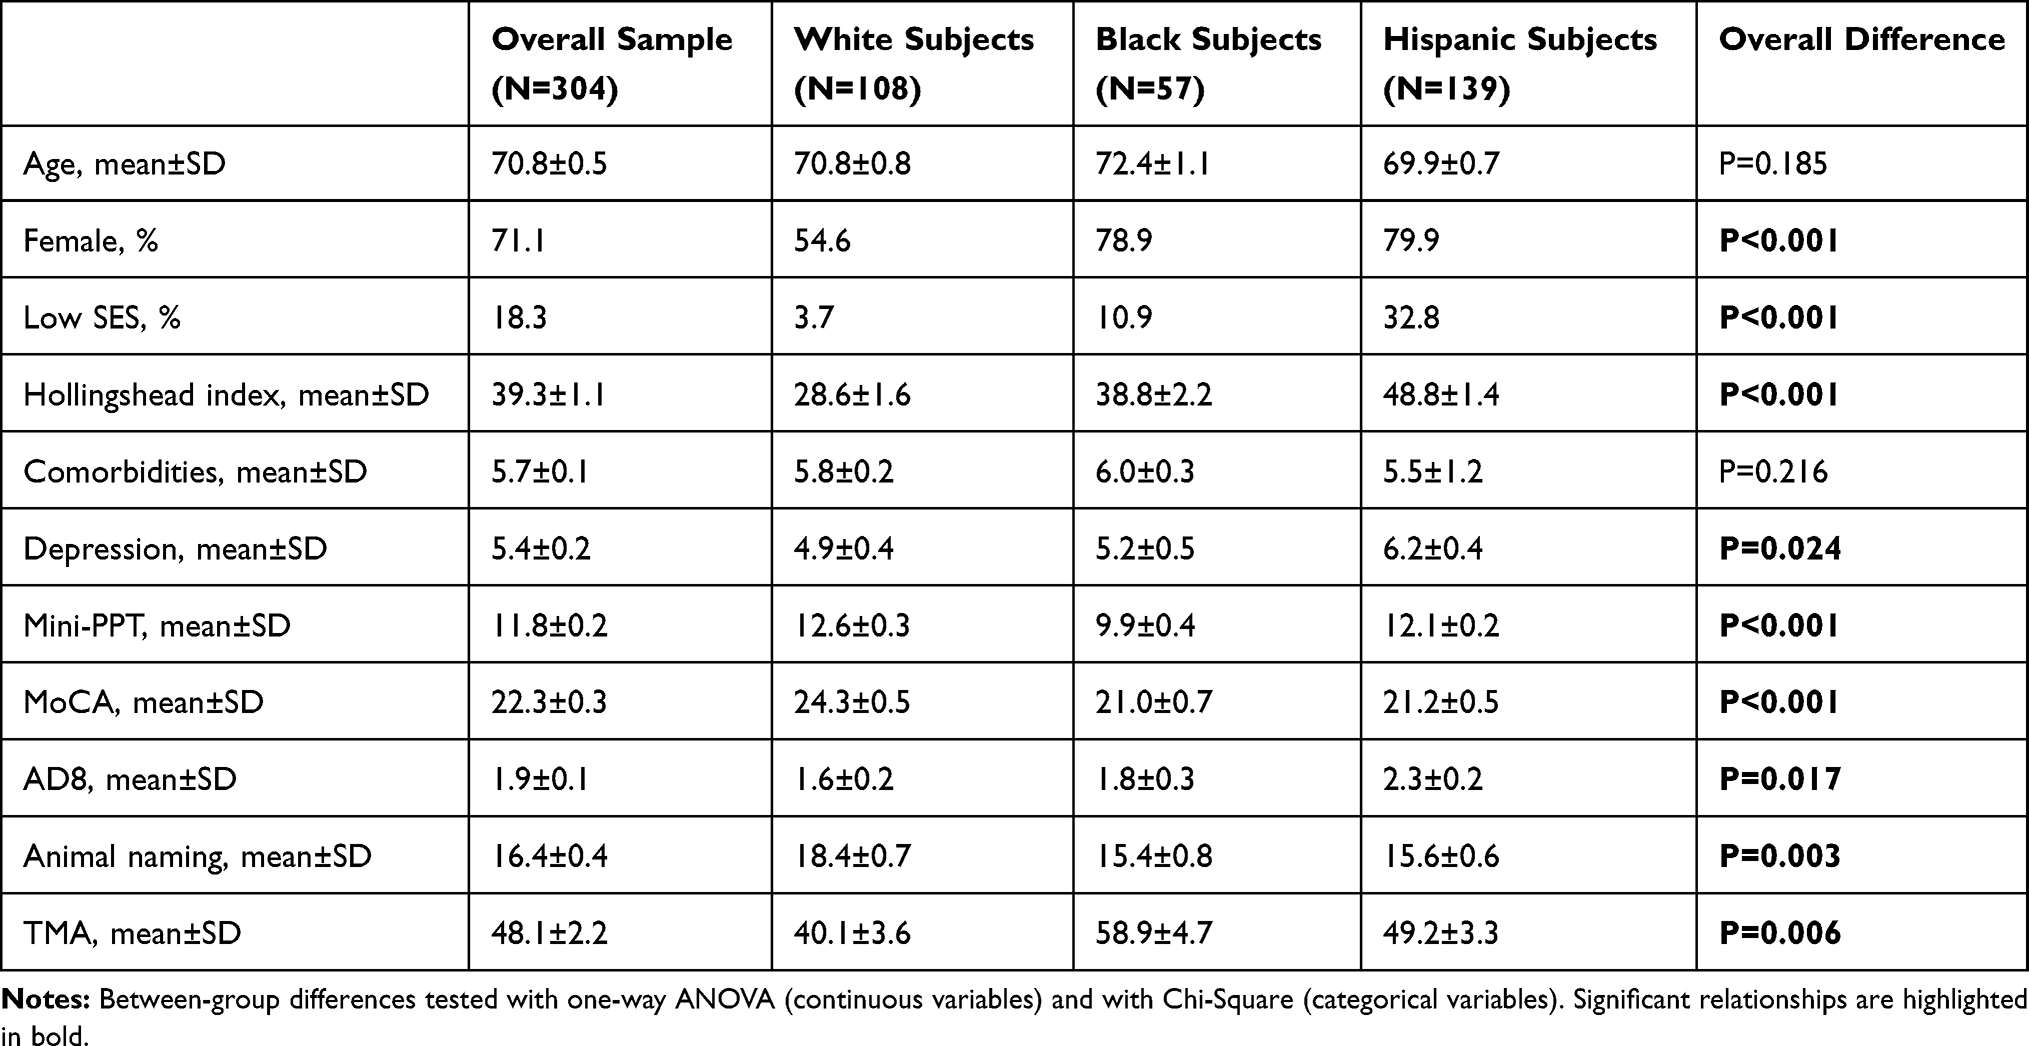 |
Table 1 Sample Characteristics According to Race/Ethnicity |
Race, Ethnicity, Age and Sex Differences in Objective Cognitive Performance
GLM analysis revealed race, ethnicity, age, and sex differences in global cognitive performance (Table 2, Model 1). Black subjects performed worse than White subjects (Estimate=−3.67±0.86, p<0.001) and Hispanics performed the worst (Estimate=−3.74±0.69, p<0.001) on the global test of cognitive function. Women outperformed men on MoCA (Estimate=1.74±0.67, p=0.010) and memory domain (Estimate=0.80±0.22, p<0.001). We also found a significant age effect. While those aged 67–74 years performed similarly, the oldest old subjects performed significantly worse than the youngest participants (age <67years). Similar results were found for all the cognitive domains analysed (see supplemental Tables S1, S3, S5, S7, and S9).
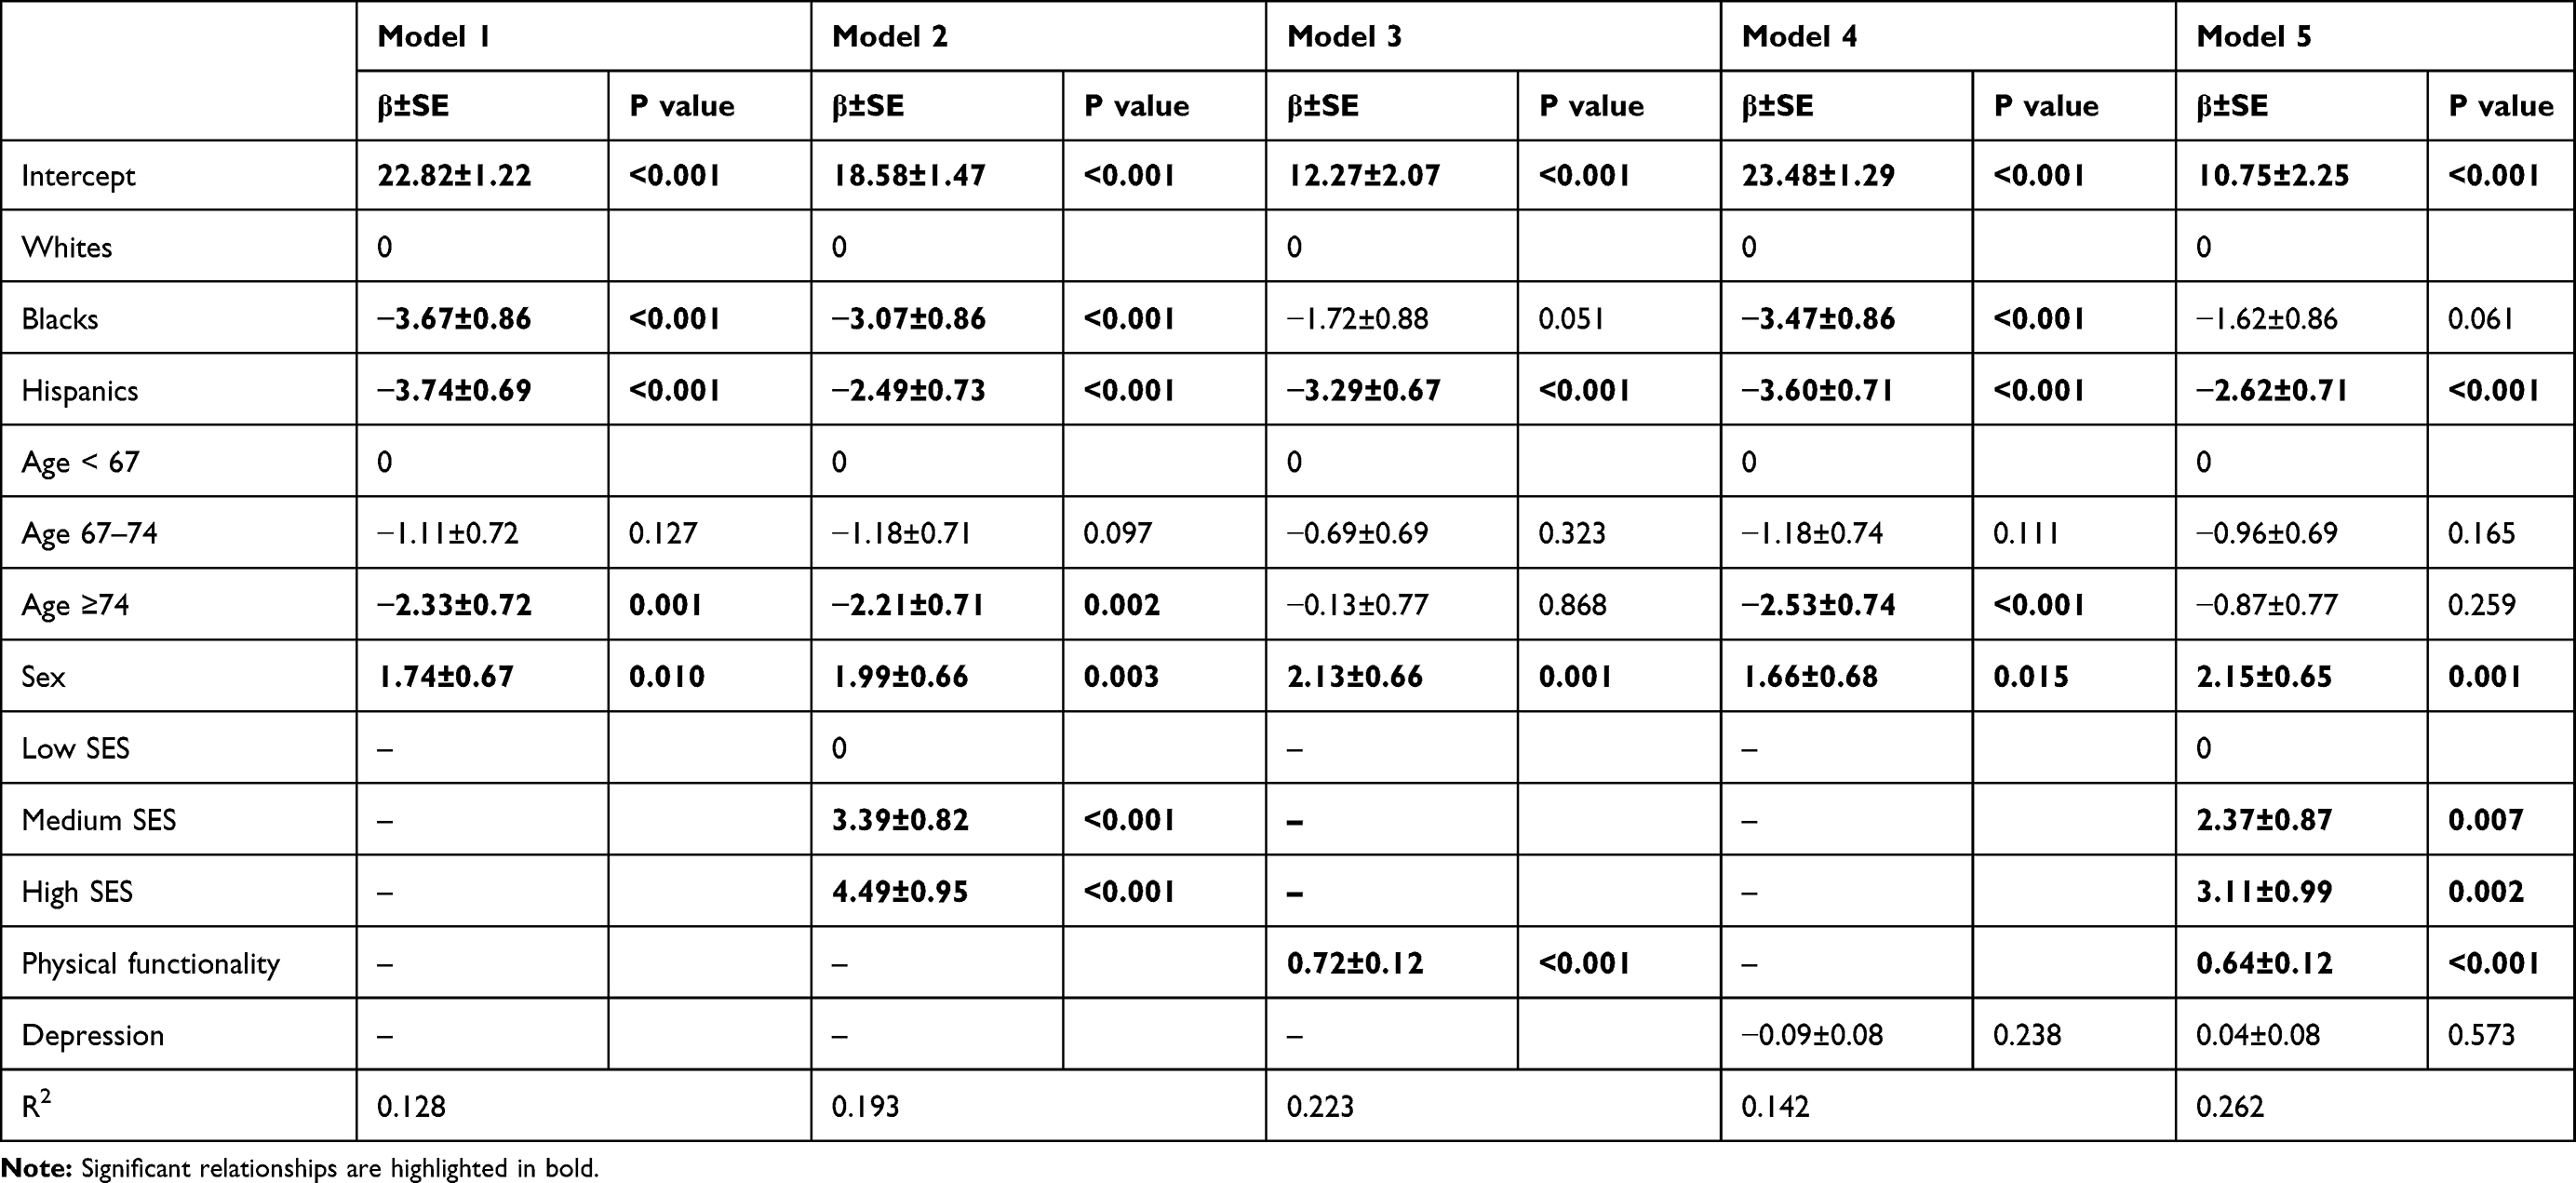 |
Table 2 Factors Contributing to Global Cognitive Performance Disparities Based on Race/Ethnicity, Age, and Sex |
Race, Ethnicity, Age and Sex Differences in Subjective Cognitive Complaints
GLM analyses demonstrated race and ethnic differences in subjective cognitive complaints (Table 3, Model 1). No differences in rates of self-reported cognitive complaints were found based on age or sex, but Hispanic subjects were more likely to report cognitive changes than their White counterparts (Estimate=0.78±0.26, p=0.003).
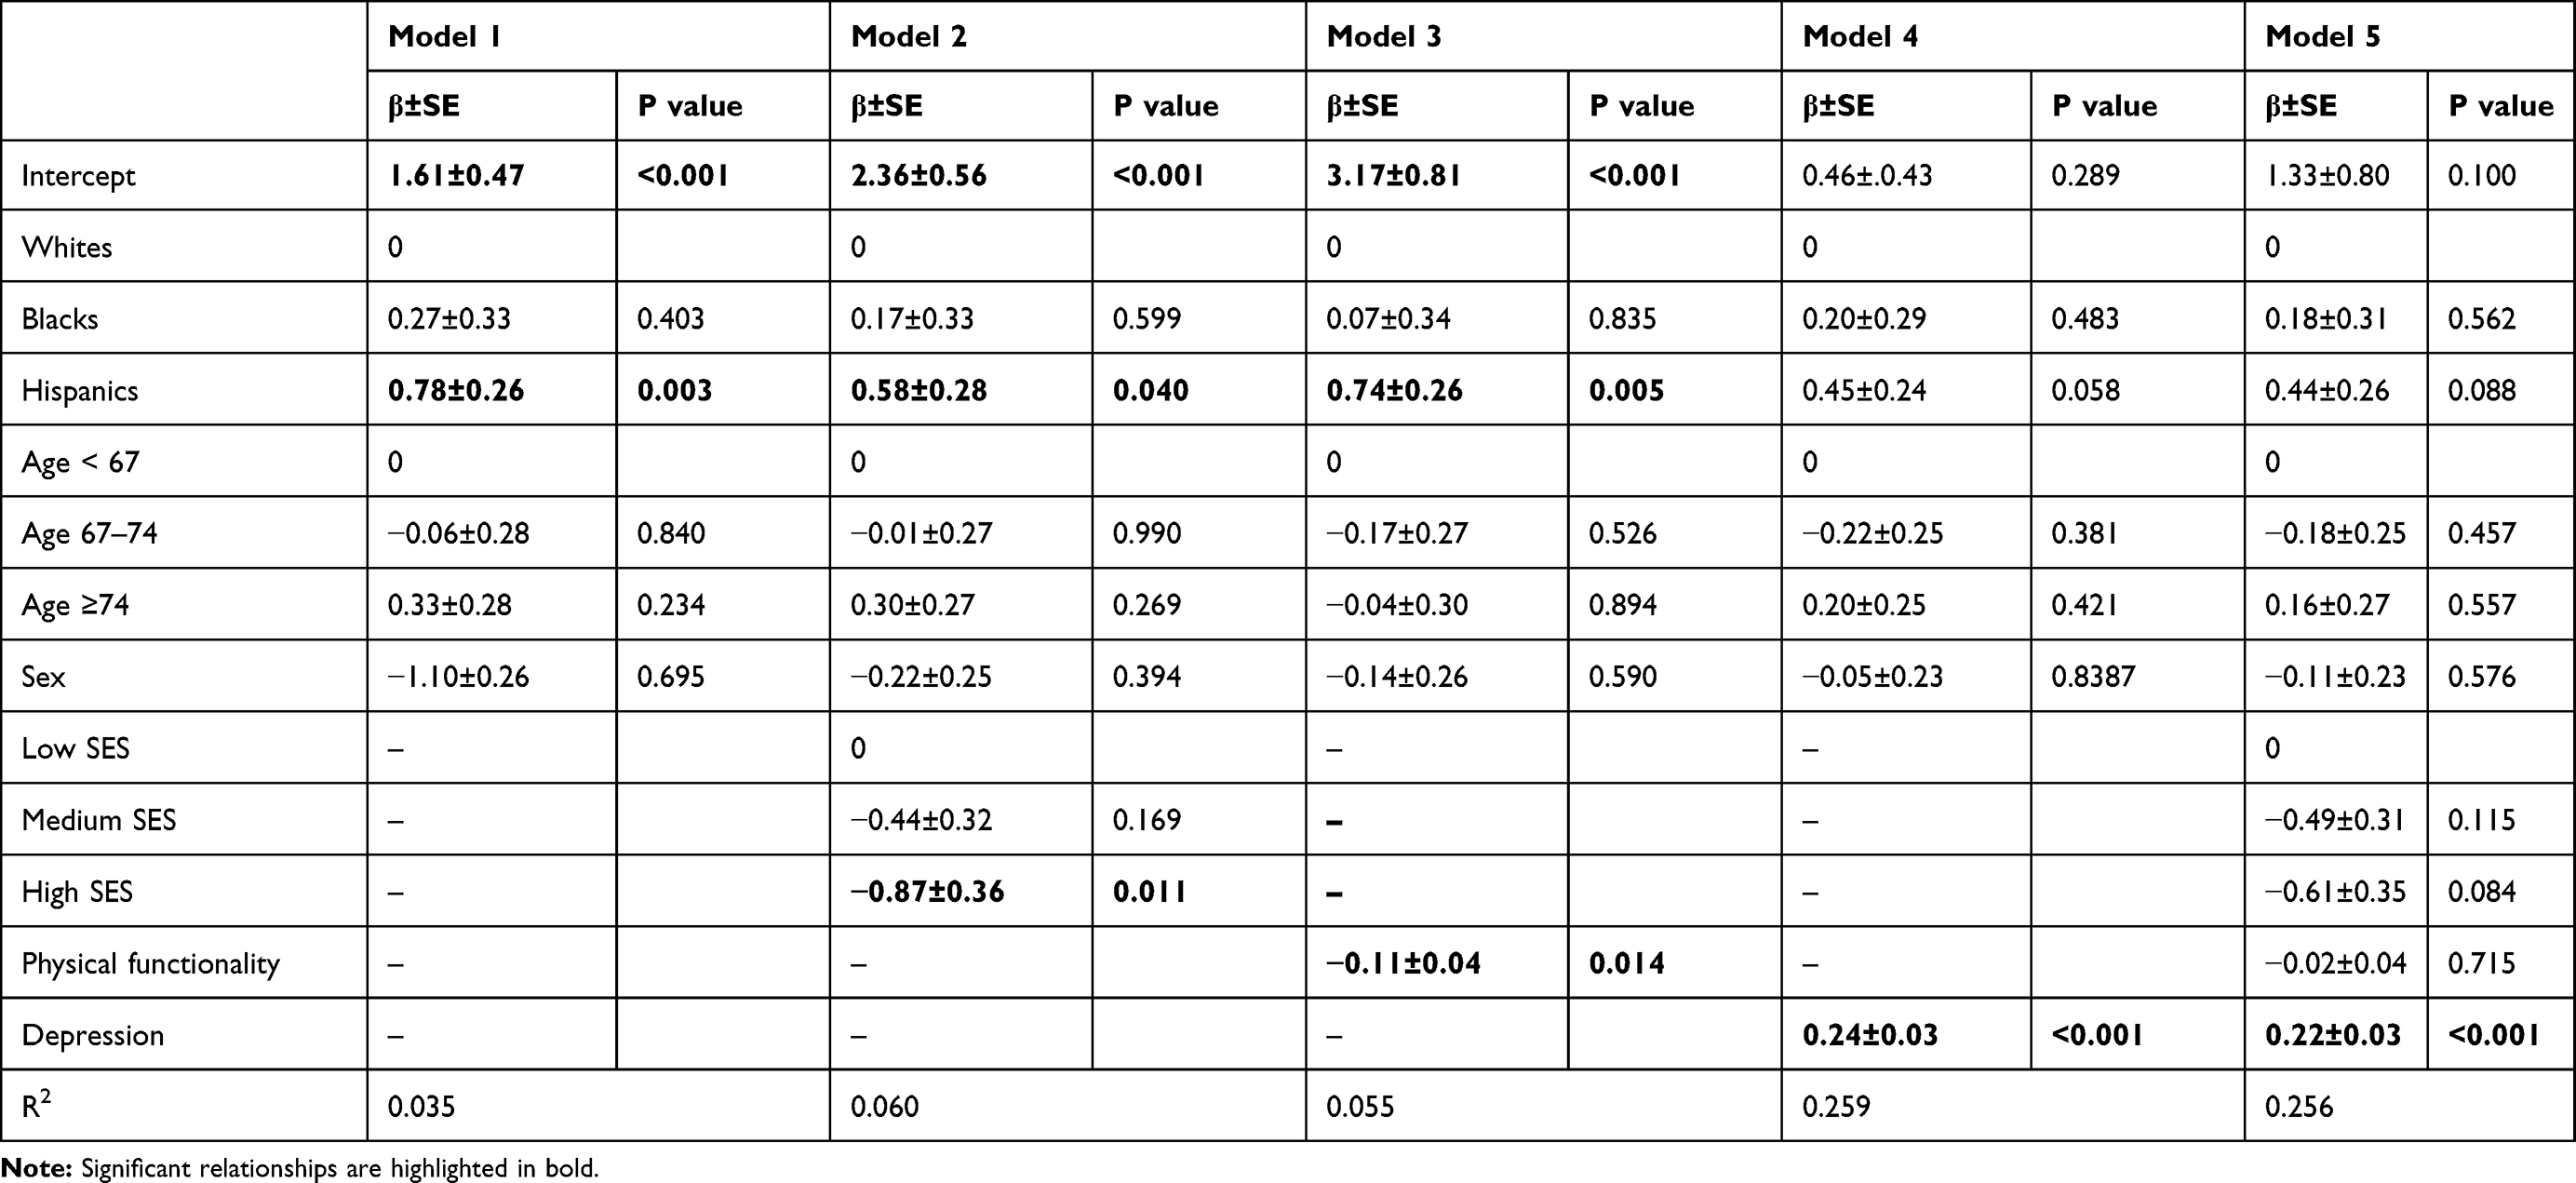 |
Table 3 Factors Contributing to Subjective Cognitive Complaints Disparities Based on Race/Ethnicity, Age, and Sex |
Role of SES, Physical Functionality, and Depressive Symptoms on Cognition
Hierarchical modelling indicates a significant role for SES in explaining the poorer performance observed in Hispanics (33% decline in the effect of race from model 1 to model 2, Table 2). The decrease was only 16% in the case of Blacks. Physical functionality was found to reduce the observed MoCA differences in Blacks in half and render them insignificant (p=0.051). Similar reductions in these effects were found for executive function, memory, attention, processing speed, and semantic fluency (Figure 1 and Tables S1, S3, S5, S7, and S9). In addition, physical functionality helped explain the observed age differences in global cognitive performance (p=0.868), executive function (Table S1), memory (Table S3), processing speed (Table S7), and semantic fluency (Table S9). None of the factors we assessed as potential mediators seems to play an important role in explaining the sex differences in global cognition or memory.
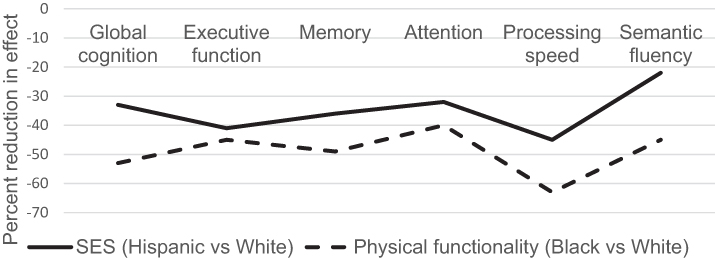 |
Figure 1 Percent reduction in impact of race/ethnicity on cognitive performance due to SES and lower extremity function. |
Differences in subjective cognitive function between Hispanics and Whites were explained in a large part by their lower SES status (26% reduction in effect) and higher rates of depressive symptoms (42% reduction from model 1 to models 2 and 4, Table 3).
The more formal Baron and Kenny mediation analysis method provides further support for the mediatory role of SES in explaining racial differences in cognitive performance (Figure 2, Panel A and Tables S2, S4, S6, S8 and S10) and subjective cognitive function (Figure 3); physical functionality in explaining race, ethnic and age disparities in MoCA (Figure 2A and B); and depressive symptoms in explaining racial/ethnic differences in AD8 (Figure 3).
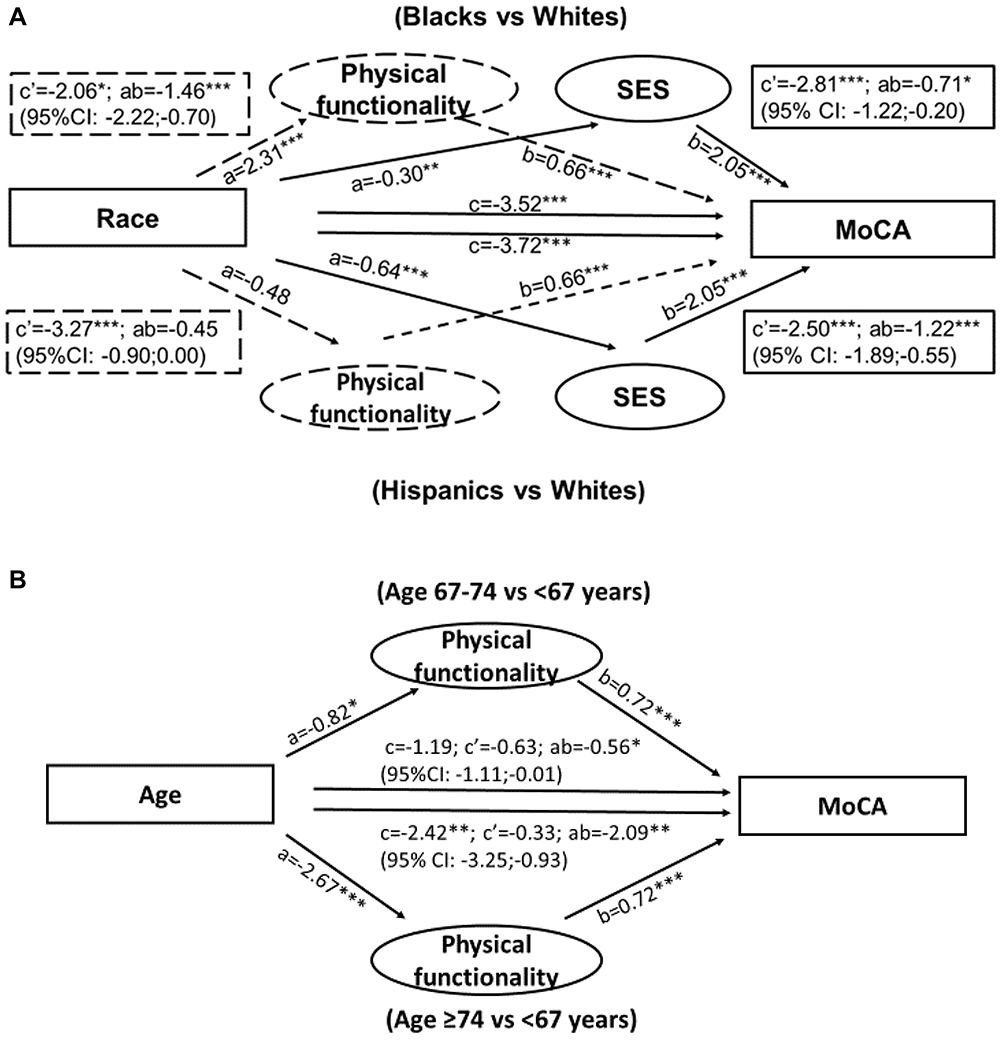 |
Figure 2 Mediation of race/ethnic (A) and age (B) differences in global cognitive performance by SES and lower extremity function. Estimates obtained with Barron and Kenny mediation analysis. |
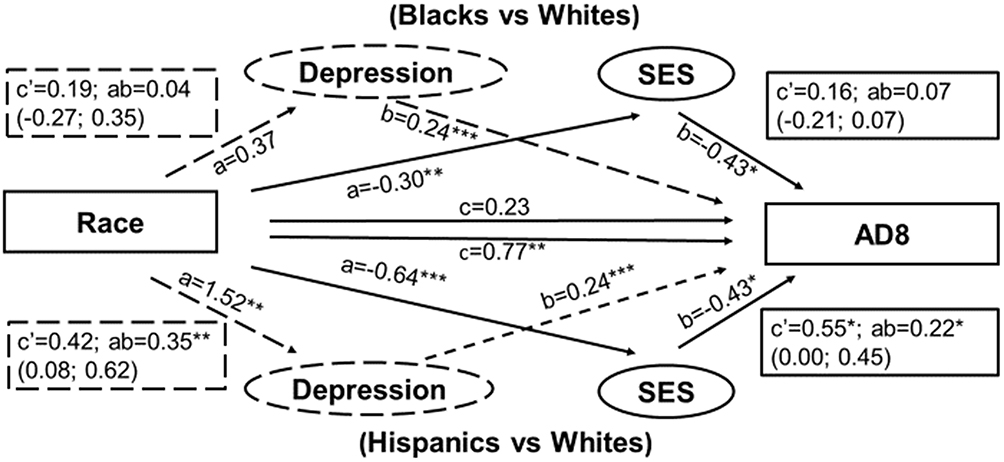 |
Figure 3 Mediation of race/ethnic differences in subjective cognitive complaints by SES and depressive symptoms. Estimates obtained with Barron and Kenny mediation analysis. |
Discussion
In this analysis of cross-sectional data from 304 diverse older adults residing in New York City, we found supportive evidence of a significant link between being from a racial or ethnic minority group and older age, on the one hand, and lower cognitive performance and subjective cognitive function, on the other hand, and identified factors that may help explain these race, ethnicity, and age differentials. Compared to White older adults, Black and Hispanic older adults perform poorer on standardized cognitive testing and are more likely to report changes in their cognitive function, which supports an increased risk of developing dementia in these racial and ethnic groups. Using an analytic approach that allowed mediation testing, we were able to quantify the contribution of SES, physical functionality, and depressive symptoms in explaining racial and ethnic differences in cognitive function in later life. Our findings support prior work on racial and ethnic disparities in cognition, provide compelling evidence that these disparities are not limited to global cognitive performance but rather extend across most cognitive domains affected in AD and to subjective cognitive dysfunction, and identify modifiable minority group-specific targets for intervention.
There is growing evidence that dementia does not affect racial/ethnic groups equally. According to the Alzheimer’s Association, the prevalence of AD and other dementia is 1.5 times higher in Hispanics and 2 times higher in Blacks than White adults aged 65 years and older.5 Our results support the general trends of lower cognitive performance and higher self-perceived cognitive impairment among minorities, but interestingly the highest rates of dysfunction were observed in the Hispanic group. This difference may be in part due to this group’s particular ethnic makeup in the sample. Our Hispanic subjects were mostly of reported Puerto Rican, Central and South American, and Dominican heritage, ethnic groups who may have lower levels of educational achievement and greater economic hardship compared to other Hispanic groups including Cubans, who were under-represented in our sample.49 The vast majority of our Hispanic subjects (78%) did not graduate from high school and held skilled or semi-skilled manual jobs. Although we were unable to determine the specific cause of cognitive impairment due to the screening nature of the study, the lower rate of depression along with higher SES in our non-Hispanic Black (as compared to Hispanic) participants could provide another explanation for their observed intermediate rather than the highest rate of cognitive dysfunction as reported in the studies that informed the Alzheimer’s Association estimates.50,51
In line with previous reports, we found that socioeconomic status helped explain a large part of the observed racial/ethnic disparities in cognitive performance, especially in Hispanics. In a multivariate hierarchical regression, analysis of correlates of racial disparities in overall cognition using data from the 2010 Health and Retirement Study, the addition of education to the model reduced the age and sex-adjusted effect of race and ethnicity by 50% and 20% for Hispanics and Blacks, respectively.4 The lifelong impact of education on cognition and its contribution in explaining racial disparities in cognition was highlighted by data from the Health and Retirement Study showing a mediatory effect of education on the relationship between race/ethnicity and cognition as early as midlife, especially in Hispanics.
The somewhat smaller reduction (33%) in the effect of Hispanic ethnicity on global cognitive performance in our study is likely related to the difference in the measure of socioeconomic status being used. In addition to the subject’s level of education, the Hollingshead Index of Social Position – a measure of SES – considers the head of the household’s occupation, which can attenuate the impact of years of education. For example, someone with a high school education who marries another person with a high-level occupation will likely benefit from the advantages conferred by the higher income and social standing of the head of the household. This will minimize the impact that their own low level of education may have had on their cognitive health. However, as reported in a large prospective study, the impact of education may offset the effect of adult occupation on dementia, at least in women, providing support for the cognitive reserve hypothesis and the contribution education may have, especially if the education is also of quality.52,53
Moreover, the moderate impact of SES indicates and the significant race and ethnicity differences that remained after SES was accounted for indicate other potential contributors including physical functionality and factors not assessed in this study. This unexplained effect of race and ethnicity on cognition is in line with evidence of an independent influence of SES on other health outcomes.54 Although using the cut-off of 20% reduction in effect would lead us to conclude that SES was not an important explanatory factor among Blacks, the consistently high reduction factor (>15% across global cognition and most of the assessed cognitive domains) along with the results of the Baron and Kenny mediation analysis suggest a potential role for SES in explaining the lower cognitive function observed in the Blacks in our sample. While smaller than in Hispanics, when quantified, the impact of SES in Blacks was similar to that reported in the Diaz-Venegas study in which SES helped explain approximately 20% of the variation in cognitive performance in this group.4
The results also suggest that SES may help explain the racial and ethnic differential in self-reported cognitive function observed in our sample. The higher rates of subjective cognitive dysfunction reported by Hispanics were due in a large part to their lower levels of SES. We found no evidence of significant differences in subjective cognitive function between Blacks and their White counterparts. This is in line with recent reports of similar rates of subjective cognitive concerns among Black older adults despite significantly lower performance on cognitive testing and may be the result of qualitative cultural differences in how cognitive concerns are endorsed.55 The impact of education vs other measures of SES on differences in cognition between minorities and Whites should be further examined to ensure that proper adjustment is used when modelling racial/ethnic difference in cognitive function. Moreover, a better understanding of the specific mechanisms through which SES affects cognition may help inform dementia screening programs and dementia interventions designed to reduce these racial/ethnic disparities.
Impaired physical functionality leading to subsequent disability and difficulties performing activities of daily living is strongly related to the development of cognitive impairment. While the most supported hypothesis posits that physical disabilities result from the pathological changes that take place in the brain over time, an increased risk of developing cognitive impairment was reported in older adults free of dementia suggesting that the two processes may, in fact, dynamically influence each other.29,56–59 In a cross-sectional aging study of community-dwelling older adults (N=327), we have previously shown that the physical functionality-cognitive performance association follows a dose–response pattern in which the likelihood of cognitive impairment increased with the progression of physical dysfunction and mediation analyses suggested that the relationship likely operates in both directions.58 Therefore, declines in physical functionality can be hypothesized both as a consequence of cognitive decline, and a contributor to the development of dementia.
With this in mind and in light of the evidence of higher rates of impaired mobility among minorities, we tested the mediatory role of physical functionality and found that it plays a similarly important role in explaining the racial, but not ethnic differences in cognitive performance.60 Hispanics were similar to Whites in terms of physical functionality as measured by the mini PPT, making mobility and other physical impairments an unlikely explanation for their lower levels of cognitive performance. In the previous work, Blacks were more likely to report severe disability than Whites, a difference that was largely explained by SES variation.61 This along with our mediation results suggests that the lower cognitive performance observed in Blacks is explained in a large part by their reduced physical functionality, which acts independently of but also possibly through the negative impact that low SES has on cognition.
In our sample, 67–74yr olds performed similarly on cognitive testing to those aged <67 years with cognitive differences becoming noticeable after age 74. These differences were largely explained by the older group’s poorer physical functionality. This finding is supported by evidence of mediation of age-related cognitive decline by lifestyle-related behaviors such as engagement in physical activity, which tends to decline with aging and is reflected in the higher levels of physical limitations observed in the oldest old.62,63 These associations were robust and consistent across various cognitive domains, which provides further support for SES and physical functionality as mediators of the race and ethnicity-cognitive performance relationship. However, the notion that SES and physical functionality serve as mediators of race and ethnicity and age-related cognitive disparities needs to be further investigated in the context of longitudinal studies.
The higher rates of cognitive dysfunction self-reported by the Hispanic vs non-Hispanic White participants in our study were additionally explained by their higher levels of depressive symptomatology. These observed rates of depressive symptoms among Hispanics are in line with reports from large epidemiologic studies such as the Aging, Demographics and Memory Study, which found Black race to be associated with a lower risk of depressive symptoms compared to both non-Hispanic White and Hispanic ethnicity, with the latter group displaying slightly higher levels than the former.64 Interestingly, non-Hispanic Black participants in our study reported levels of depressive symptoms that were similar to those of Whites despite lower education and SES – known risk factors for depression. Perhaps the detrimental effect of these factors was offset by the similar levels of comorbidities and cardiovascular risk factors between Blacks and Whites in our study. The impact of depressive symptoms on cognition was limited to subjective measures of cognition supporting other previous work and was slightly higher than that of SES, explaining 42% of the ethnic disparities in cognition found in our study.65
The higher rates of depressive symptoms and cognitive dysfunction observed in Hispanic older participants in our study do not support the Hispanic epidemiologic paradox which stipulates that despite the lower levels of education and socioeconomic status, older Hispanics fair similarly or even better than US Whites on many health outcomes. Our findings suggest that the mortality advantage reported in Hispanics and particularly in foreign-born Hispanics (the vast majority of our Hispanic subjects were born abroad) does not appear to be due to better mental health in old age.66 Similar results have recently been reported in other epidemiologic aging studies.4 Continued research effort on deciphering the “Hispanic Paradox” will offer a better understanding of the protective factors that confer the advantage of reduced mortality in older Hispanics.67
Finally, although we found sex differences in global cognitive performance and memory, none of the factors investigated in this study had a contribution to these differences. This suggests a need to investigate the role of other mechanisms including sex hormones, whose decline with aging has been linked to neuroinflammation, synaptic decline, and cognitive impairment and the development of brain hypometabolism, all risk factors for dementia.68
These results need to be interpreted in light of the potential limitations of the study. The cross-sectional nature of the study precludes chronological assessment of the relationships between the study outcome (ie cognition) and some of the factors investigated (ie physical functionality and depressive symptoms) and therefore mediation role was assessed based on a priori relationships assuming that these factors precede cognitive decline. However, both physical dysfunction and depressive symptoms can represent consequences of cognitive impairment and dementia, in which case the results could be interpreted to indicate that the reduced physical functionality and increased depressive symptoms observed in minorities could be explained by a decline in cognitive function. Although cognition can and does impact a person’s SES, this direction of association is mostly observed earlier in life, so in the current study, SES is expected to be a precursor rather than a consequence of cognitive impairment.
Our mediation analysis was designed to quantify the individual contribution of SES, physical functionality, and depressive symptoms in explaining the racial, ethnic, age, and sex differences in cognitive function observed in our study. Other factors have been identified as playing a role as well including quality as opposed to quantity of formal education, acculturation, and physical activity.69–71 We were however limited in our ability to assess the influence of these factors by the unavailability of data in the current study.
Finally, another limitation has to do with the make-up of our sample, which may have led to the Hispanic group being different from the general US Hispanic population. Although Mexican Americans represent the largest Hispanic ethnic group in the US, only 5% of our sample consisted of Mexican Americans. The distribution of Hispanics reflected the demographics of the capture area of our research center (mostly Puerto Rican, Central and South American). This may help explain our finding of the highest rate of cognitive impairment based on performance-based testing in the Hispanic group.
Higher education may directly affect brain structure in formative years helping build cognitive reserve which may later result in a longer latent period of cognitive decline and therefore a slower rate of progression to dementia even in the presence of pathology.72,73 Alternatively, higher education may help develop skills required during neuropsychological testing and is often associated with healthier behaviors such as engagement in physical activities, which may have beneficial effects on brain structure and cognitive function.20,74,75
Conclusion
The poorer cognitive function observed among older adults from racial and ethnic minority groups appears to reflect a difference in peak cognitive reserve rather than higher rates of cognitive decline. A clear understanding of the factors that increase cognitive reserve including the contribution of biological and cultural promoters will help efforts to reduce racial/ethnic disparities. Our findings highlight the importance of SES as a contributory factor to racial and ethnic disparities in cognition as well as that of physical functionality for explaining both racial and age differences in cognitive performance. In order to provide the evidence, the USPSTF requires to make recommendations regarding dementia screening, we must first understand how best to determine cognitive impairment in diverse samples and understand the impact of relevant biological and sociodemographic variables on cognitive performance and self-reporting of cognitive change.31
Taken together, our findings suggest that dementia screening programs would benefit if tailored to specific racial, ethnic and age subgroups. Programs to detect dementia in Blacks and the oldest olds should target those with physical functional impairment, while among Hispanics, economical disadvantage could help identify those who will benefit the most from these programs. In addition, targeting these at-risk populations for interventions to promote increased cognitive reserve earlier in life may help level out the racial/ethnic divide in cognitive function.
This may be particularly true in deciding how to best assess cognitive impairment across diverse populations and communities. Tailoring dementia screening programs to include factors that are specific to individual socio-demographic subgroups may help improve the accuracy of dementia detection, increase identification of important co-morbidities, and therefore reduce disparities in health outcomes for older adults from diverse racial, ethnic, and socioeconomic backgrounds.
Disclosure
James E. Galvin reports grants from National Institute on Aging, National Institute of Neurological Disease and Stroke, Harry T. Mangurian Foundation, and Albert Charitable Trust, outside the submitted work; in addition, they report patent AD8s with royalties paid to Roche, Lilly, Quintiles, Continuum Clinical, Roobrik, and Langland.
The authors report no other conflicts of interest in this work.
This study was supported by grants from the NIH (R01 AG040211-A1, R01 AG040211-A1S1, and R01 NS1010483-01A1).
The authors confirm that this study was conducted in accordance with the Declaration of Helsinki.
References
1. Mazaffarian D, Benjamin EJ, Go AS. Heart disease and stroke statistics - 2016 update. A report from the American heart association. Circulation. 2016;133:e38–e360.
2. Centers for Disease Control and Prevention. Long-term trends in diabetes; 2017. Available from: http://www.cdc.gov/diabetes/data.
3. National Center for Health Statistics. Health, United States, 2015: With Special Feature on Racial and Ethnic Health Disparities. Hyattsville, MD; 2016.
4. Diaz-Venegas C, Downer B, Langa KM, Wong R. Racial and ethnic differences in cognitive function among older adults in the USA. Int J Geriatr Psychiatry. 2016;31(9):1004–1012. doi:10.1002/gps.4410
5. Alzheimer’s Association. 2019 Alzheimer’s disease facts and figures. Alzheimers Dement. 2019;15:321–387.
6. Hyde JS, LInn MC. Gender differences in verbal ability: a meta-analysis. Psychol Bull. 1988;104(1):53–69.
7. Stoet G, Geary DC. Sex differences in mathematics and reading achievement are inversely related: within- and across-nation assessment of 10 years of PISA data. PLoS One. 2013;8(3):e57988. doi:10.1371/journal.pone.0057988
8. Burton LA, Henninger D. Sex differences in relationships between verbal fluency and personality. Curr Psychol. 2013;32(2):168–174. doi:10.1007/s12144-013-9167-4
9. Voyer D, Voyer S, Bryden MP. Magnitude of sex differences in spatial abilities: a meta-analysis and consideration of critical variables. Psychol Bull. 1995;117(2):250–270. doi:10.1037/0033-2909.117.2.250
10. Barel E, Tzischinsky O. Age and sex differences in verbal and visuospatial abilities. Adv Cogn Psychol. 2018;14(2):51–61. doi:10.5709/acp-0238-x
11. Murman DL. The impact of age on cognition. Semin Hear. 2015;36(03):111–121. doi:10.1055/s-0035-1555115
12. Salat DH, Kaye JA, Janowsky JS. Prefrontal gray and white matter volumes in healthy aging and alzheimer disease. Arch Neurol. 1999;56(3):338–344. doi:10.1001/archneur.56.3.338
13. Madden DJ, Bennett IJ, Song AW. Cerebral white matter integrity and cognitive aging: contributions from diffusion tensor imaging. Neuropsychol Rev. 2009;19(4):415–435. doi:10.1007/s11065-009-9113-2
14. Pannesse E. Morphological changes in nerve cells during normal aging. Brain Struct Funct. 2011;216(2):85–89. doi:10.1007/s00429-011-0308-y
15. Morrisson JH, Baxter MG. The aging cortical synapse: hallmarks and implications for cognitive decline. Nat Rev Neurosci. 2012;13(4):240–250.
16. Ritchie SJ, Bates TC, Deary IJ. Is education associated with improvements in general cognitive ability, or in specific skills? Dev Psychol. 2015;51(5):573–582. doi:10.1037/a0038981
17. Stern Y, Gurland B, Tatemichi TK, Tang MX, Wilder D, Mayeux R. Influence of education and occupation on the incidence of alzheimer’s disease. JAMA. 1994;271(13):1004–1010. doi:10.1001/jama.1994.03510370056032
18. Evans DA, Hebert LE, Beckett LA, et al. Education and other measures of socioeconomic status and risk of incident alzheimer disease in a defined population of older persons. Arch Neurol. 1997;54(11):1399–1405. doi:10.1001/archneur.1997.00550230066019
19. Prince M, Acosta D, Ferri CP, et al. Dementia incidence and mortality in middle-income countries, and associations with indicators of cognitive reserve: a 10/66 dementia research group population-based cohort study. Lancet. 2012;380(9836):50–58. doi:10.1016/S0140-6736(12)60399-7
20. Ho AJ, Raji CA, Becker JT, et al. The effects of physical activity, education, and body mass index on the aging brain. Hum Brain Mapp. 2011;32(9):1371–1382. doi:10.1002/hbm.21113
21. Ryan CL, Bauman K. Educational attainment in the United States: 2015. population characteristics: current population reports. us census bureau. Department of Commerce, Economics and Statistics Administration; 2016. Available from: https://www.census.gov/content/dam/Census/library/publications/2016/demo/p20-578.pdf.
22. Wilson RS, Capuano AW, Boyle PA, et al. Clinical-pathologic study of depressive symptoms and cognitive decline in old age. Neurology. 2014;83(8):702–709. doi:10.1212/WNL.0000000000000715
23. Centers for Disease Control and Prevention and National Association of Chronic Disease Directors. The state of mental health and aging in America issue brief 1: what do the data tell us? National Association of Chronic Disease Directors; 2008. Available from: https://www.cdc.gov/aging/pdf/mental_health.pdf.
24. Kessler RC, McGonagle KA, Swartz M, Blazer DG, Nelson CB. Sex and depression in the national comorbidity survey. I: lifetime prevalence, chronicity and recurrence. J Affect Disord. 1993;29(2–3):85–96. doi:10.1016/0165-0327(93)90026-G
25. Sutin AR, Terracciano A, Milaneschi Y, Yang A, Ferrucci L, Zonderman AB. The trajectory of depressive symptoms across the adult life span. JAMA Psychiatry. 2013;70(8):803–811. doi:10.1001/jamapsychiatry.2013.193
26. Kraus L, Lauer E, Coleman R, Houtenville A. 2017 Disability Statistics Annual Report. Durham NH: University of New Hampshire; 2018.
27. Zunzunegui MV, Alvarado B, Oliveira Guerra R, Gomez JF, Ylli A, Guralnik JM. The mobility gap between older men and women: the embodiment of gender. Arch Gerontol Geriatr. 2015;61(2):140–148. doi:10.1016/j.archger.2015.06.005
28. Courtney-Long EA, Carroll DD, Zhang QC, et al. Prevalence of disability and disability type among adults, United States - 2013. MMWR Morb Mortal Wkly Rep. 2015;64(29):777–783. doi:10.15585/mmwr.MM6429a2
29. Clouston SA, Brewster P, Kuh D, et al. The dynamic relationship between physical function and cognition in longitudinal aging cohorts. Epidemiol Rev. 2013;35(1):33–50. doi:10.1093/epirev/mxs004
30. Beckett MW, Ardern CI, Rotondi MA. A meta-analysis of prospective studies on the role of physical activity and the prevention of alzheimer’s disease in older adults. BMC Geriatr. 2015;15(1):9. doi:10.1186/s12877-015-0007-2
31. Owens DK, Davidson KW, Krist AH, US Preventive Services Task Force. Screening for cognitive impairment in older adults. US preventive services task force recommendation statement. JAMA. 2020;323(8):757–763. doi:10.1001/jama.2020.0435
32. Tolea MI, Galvin JE. Sarcopenia and impairment in cognitive and physical performance. Clin Interv Aging. 2015;10:663–671. doi:10.2147/CIA.S76275
33. Nasreddine ZS, Phillips NA, Bedirian V, et al. The montreal cognitive assessment, MoCA: a brief screening tool for mild cognitive impairment. J Am Geriatr Soc. 2005;53(4):695–699.
34. Freitas S, Simoes MR, Alves L, Santana I. Montreal cognitive assessment: validation study for mild cognitive impairment and alzheimer disease. Alzheimer Dis Assoc Disord. 2013;27(1):37–43. doi:10.1097/WAD.0b013e3182420bfe
35. Trzepacz PT, Hochstetler H, Wang S, Walker B, Saykin AJ. For the alzheimer’s disease neuroimaging initiative. Relationship between the montreal cognitive assessment and mini-mental state examination for assessment of mild cognitive impairment in older adults. BMC Geriatr. 2015;15(1):107. doi:10.1186/s12877-015-0103-3
36. Partington J, Leiter RG. Partington’s pathway test. Psychol Serv Cent J. 1949;1:11–20.
37. Sager MA, Hermann BP, La Rue A, Woodard JL. Screening for dementia in community-based memory clinics. WMJ. 2006;105(7):25–29.
38. Galvin JE, Roe CM, Coats MA. Patient’s rating of cognitive ability: using the AD8, a brief informant interview, as a self-rating tool to detect dementia. Arch Neurol. 2007;64(5):725–730. doi:10.1001/archneur.64.5.725
39. Hendry K, Green C, McShane R, et al. AD-8 for detection of dementia across a variety of healthcare settings. Cochrane Database Syst Rev. 2019;3(3). doi:10.1002/14651858.CD011121.pub2
40. Galvin JE, Fagan AM, Holtzman DM, Mintun MA, Morris JC. Relationship of dementia screening tests with biomarkers of alzheimer’s disease. Brain. 2010;133(11):3290–3300. doi:10.1093/brain/awq204
41. Espinosa PS, Espinosa PH, Basantes AG, et al. Validation study of the AD8 and CDR Spanish versions for detecting dementia in Ecuador. J Ky Med Assoc. 2013;111:5–11.
42. Carnero PC, de la Vega CR, Lopez AS, et al. Assessing the diagnostic accuracy (DA) of the Spanish version of the informant-based AD8 questionnaire. Neurologia. 2013;28:88–94.
43. Munoz C, Nunez J, Flores P, Behrens PMI, Slachevsky A. Usefulness of a brief informant interview to detect dementia, translated into Spanish (AD8-CH). Rev Med Chil. 2010;138:1063–1065.
44. Hollingshead AB. Two factor index of social position. In: Hollingshead AB, Redlich FC, editors. Social Class and Mental Illness: A Community Study. New York: John Wiley; 1958.
45. Charlson ME, Pompei P, Ales KL, MacKenzie CR. A new method of classifying prognostic comorbidity in longitudinal studies: development and validation. J Chronic Dis. 1987;40(5):373–383. doi:10.1016/0021-9681(87)90171-8
46. Wilkins CH, Roe CM, Morris JC. A brief clinical tool to assess physical function: the mini-physical performance test. Arch Gerontol Geriatr. 2010;50(1):96–100. doi:10.1016/j.archger.2009.02.006
47. Reuben DB, Siu AL. An objective measure of physical function of elderly outpatients. The physical performance test. J Am Geriatr Soc. 1990;38(10):1105–1112. doi:10.1111/j.1532-5415.1990.tb01373.x
48. Zigmond AS, Snaith RP. The hospital anxiety and depression scale. Acta Psychiatr Scand. 1983;67(6):361–370. doi:10.1111/j.1600-0447.1983.tb09716.x
49. Torres V. The diversity among us: Puerto Ricans, Cuban Americans, Caribbean Americans, and Central and South Americans. New Dir Student Serv. 2004;2004(105):5–16. doi:10.1002/ss.112
50. Potter GG, Plassman BL, Burke JR. Cognitive performance and informant reports in the diagnosis of cognitive impairment and dementia in African Americans and Whites. Alzheimers Dement. 2009;5(6):445–453. doi:10.1016/j.jalz.2009.04.1234
51. Gurland BJ, Wilder DE, Lantigua R, et al. Rates of dementia in three ethnoracial groups. Int J Geriatr Psychiatry. 1999;14(6):481–493. doi:10.1002/(SICI)1099-1166(199906)14:6<481::AID-GPS959>3.0.CO;2-5
52. Russ TC, Stamatakis E, Hamer M, Starr JM, Kivimaki M, Batty GD. Socioeconomic status as a risk factor for dementia death: individual participant meta-analysis of 86 508 men and women from the UK. Br J Psychiatry. 2013;203(1):10–17. doi:10.1192/bjp.bp.112.119479
53. Chin AL, Negash S, Xie S, Arnold S, Hamilton RH. Quality, and not just quantity, of education accounts for differences in psychometric performance between african americans and white non-hispanics with alzheimer’s disease. J Int Neuropsychol Soc. 2012;18(2):277–285. doi:10.1017/S1355617711001688
54. Kelley-Moore JA, Ferraro KF. The black/white disability gap: persistent inequality in later life? J Gerontol B Psychol Sci Soc Sci. 2004;59(1):S34–43. doi:10.1093/geronb/59.1.S34
55. Jackson JD, Rentz DM, Aghjaya SL. Subjective cognitive concerns are associated with objective memory performance in Caucasian but not African-American persons. Age Ageing. 2017;46(6):988–993. doi:10.1093/ageing/afx077
56. Fauth EB, Schwartz S, Tschanz JT, Ostbye T, Corcoran C, Norton MC. Baseline disability in activities of daily living predicts dementia risk even after controlling for baseline global cognitive ability and depressive symptoms. Int J Geriatr Psychiatry. 2013;28(6):597–606.
57. Wilkins CH, Roe CM, Morris JC, Galvin JE. Mild physical impairment predicts future diagnosis of dementia of the alzheimer’s type. J Am Geriatr Soc. 2013;61(7):1055–1059. doi:10.1111/jgs.12255
58. Tolea MI, Galvin JE. The relationship between mobility dysfunction staging and global cognitive performance. Alzheimer Dis Assoc Disord. 2016;30(3):230–236. doi:10.1097/WAD.0000000000000136
59. Tolea MI, Morris JC, Galvin JE. Longitudinal associations between physical and cognitive performance among community-dwelling older adults. PLoS One. 2015;10(4):e0122878. doi:10.1371/journal.pone.0122878
60. Hardy SE, McGurl DJ, Studenski SA, Degenholtz HB. Biopsychosocial characteristics of community-dwelling older adults with limited ability to walk one-quarter of a mile. J Am Geriatr Soc. 2010;58(3):539–544. doi:10.1111/j.1532-5415.2010.02727.x
61. Goyat R, Vyas A, Sambamoorthi U. Racial/ethnic disparities in disability prevalence. J Racial Ethn Health Disparities. 2016;3(4):635–645. doi:10.1007/s40615-015-0182-z
62. Soggard I, Ni R. Mediating age-related cognitive decline through lifestyle activities: a brief review of the effects of physical exercise and sports-playing on older adult cognition. Acta Psychopathol. 2018;4(5):22.
63. Ferrucci L, Cooper R, Shardell M, Simonsick EM, Schrack JA, Kuh D. Age-related change in mobility: perspectives from life course epidemiology and geroscience. J Gerontol a Biol Sci Med Sci. 2016;71(9):1184–1194. doi:10.1093/gerona/glw043
64. Steffens DC, Fisher GG, Langa KM, Potter GG, Plassman BL. Prevalence of depression among older Americans: the aging, demographics and memory study. Int Psychogeriatr. 2009;21(5):879–888. doi:10.1017/S1041610209990044
65. Zlatar ZZ, Moore RC, Palmer BW, Thompson WK, Jeste DV. Cognitive complaints correlate with depression rather than concurrent objective cognitive impairment in the successful aging evaluation baseline sample. J Geriatr Psychiatry Neurol. 2014;27(3):181–187. doi:10.1177/0891988714524628
66. Lariscy JT, Hummer RA, Hayward MD. Hispanic older adult mortality in the United States: new estimates and an assessment of factors shaping the Hispanic paradox. Demography. 2015;52(1):1–14. doi:10.1007/s13524-014-0357-y
67. Markides KS, Coreil J. The health of Hispanics in the southwestern United States: an epidemiologic paradox. Public Health Rep. 1986;101(3):253–265.
68. Zarate A, Stevnsner T, Gredilla R. Role of estrogen and other sex hormones in brain aging, neuroprotection and DNA repair. Front Aging Neurosci. 2017;9:430.
69. Manly JJ, Schupf N, Tang MX, Stern Y. Cognitive decline and literacy among ethnically diverse elders. J Geriatr Psychiatry Neurol. 2005;18(4):213–217. doi:10.1177/0891988705281868
70. Beniflah J, Chatterjee S, Urtis K. Bilingual memory: the impact of acculturation on the cognitive structure of foreign-born Hispanics. J Brand Strategy. 2014;3:261–277.
71. Masel MC, Raji M, Peek MK. Education and physical activity mediate the relationship between ethnicity and cognitive function in late middle-aged adults. Ethn Health. 2010;15(3):283–302. doi:10.1080/13557851003681273
72. Stern YP, Albert S, Tang MX, Tsai WY. Rate of memory decline in AD is related to education and occupation: cognitive reserve? Neurology. 1999;53(9):1942–1947. doi:10.1212/WNL.53.9.1942
73. Scarmeas N, Zarahn E, Anderson KE. Association of life activities with cerebral blood flow in alzheimer disease: implications for the cognitive reserve hypothesis. Arch Neurol. 2003;60(3):359–365. doi:10.1001/archneur.60.3.359
74. Mirowsky J, Ross CE. Education, Social Status, and Health. Howthorne, NY: Aldine de Gruyter; 2003.
75. Albert MS. How does education affect cognitive function? Ann Epidemiol. 1995;5(1):76–78. doi:10.1016/1047-2797(94)00044-T
 © 2020 The Author(s). This work is published and licensed by Dove Medical Press Limited. The
full terms of this license are available at https://www.dovepress.com/terms
and incorporate the Creative Commons Attribution
- Non Commercial (unported, 3.0) License.
By accessing the work you hereby accept the Terms. Non-commercial uses of the work are permitted
without any further permission from Dove Medical Press Limited, provided the work is properly
attributed. For permission for commercial use of this work, please see paragraphs 4.2 and 5 of our Terms.
© 2020 The Author(s). This work is published and licensed by Dove Medical Press Limited. The
full terms of this license are available at https://www.dovepress.com/terms
and incorporate the Creative Commons Attribution
- Non Commercial (unported, 3.0) License.
By accessing the work you hereby accept the Terms. Non-commercial uses of the work are permitted
without any further permission from Dove Medical Press Limited, provided the work is properly
attributed. For permission for commercial use of this work, please see paragraphs 4.2 and 5 of our Terms.