Back to Journals » Clinical Ophthalmology » Volume 17
The Effect of Myopia on Vessel Density in Glaucomatous Patients by Optical Coherence Tomography Angiography
Authors AM S, Anany M, Awwad MA ![]() , Sanad E, Eltohamy SM
, Sanad E, Eltohamy SM
Received 10 May 2023
Accepted for publication 27 June 2023
Published 17 August 2023 Volume 2023:17 Pages 2429—2441
DOI https://doi.org/10.2147/OPTH.S418194
Checked for plagiarism Yes
Review by Single anonymous peer review
Peer reviewer comments 2
Editor who approved publication: Dr Scott Fraser
Saeed AM, Mohamed Anany, Mohamed A Awwad, Eman Sanad, Soha MM Eltohamy
Department of Ophthalmology, Benha University Hospital, Benha, Qualubia, Egypt
Correspondence: Mohamed A Awwad, Department of Ophthalmology, Benha University Hospital, Benha, Qualubia, Egypt, Tel +201017014208, Email [email protected]; [email protected]
Background: Glaucoma is a degenerative optic neuropathy that causes anatomical and functional visual impairment.
Aim and Objectives: This investigation’s primary goal was to perform a qualitative and quantitative assessment of macular and peripapillary vessels to detect the impairment of blood flow in glaucomatous patients with or without myopia which can affect the prognosis of glaucoma and visual field.
Subjects and Methods: This prospective, cross-sectional, observational research was performed for glaucomatous patients with and without myopia who attend the outpatient clinic at the ophthalmology department, at Benha University. The study was conducted on 50 subjects with glaucomatous eyes, divided into two groups: the first group consisted of (25 subjects) of glaucoma with myopia and the second group (25 subjects) of glaucoma with the same severity of mean deviation in the visual field of group 1 without myopia, using OCTA to measure retinal vessel density (superficial vessel density) and OCT thickness ILM-RPE, RNFL thickness, GCL and small vessel density (RADIAL PERI PAPILLARY PLEXUS).
Results: Regarding demographic data of myopia in the studied eyes, there were (9) 18% with low myopia with no significance, (32) 64% with moderate myopia, and (9) 18% with high myopia, with open-angle glaucoma patients showed a highly significant decline in total retinal nerve fiber layer thickness, superior-nasal RNFL thickness, Inferior-nasal RNFL thickness, superior-temporal RNFL and inferior-temporal RNFL thickness compared to open-angle glaucoma patients without myopia.
Conclusion: Our results show that microvascular attenuation occurs more significantly in OAG than in myopia. When both myopia and OAG are present, there is a higher reduction in microvascular attenuation than with either disease alone. The development and progression of glaucoma in individuals with high myopia are more aggressive than in low or non-myopia, so by using OCTA detection of early microvascular changes in high myopia, individuals help the early detection and management of glaucoma.
Keywords: OCT angiography, microvasculature, choroid, glaucoma, optic nerve head ONH, macula
Introduction
It’s no secret that myopia is a leading cause of blindness. Around 1.4 billion individuals worldwide have trouble seeing far away without corrective lenses because of myopia.1 Retinal blood vessel density and blood flow in the retinal arteries are reduced, as shown in laser Doppler and (OCTA) in mild to severe myopic eyes.2 High myopia (HM) is an important cause of blindness in young adults. According to the accepted definition, when the spherical equivalent of the refractive error exceeds six diopters (D) and/or axial length exceeds 26.5 mm.3
High axial myopia with obvious pathological changes in the posterior pole is called pathological myopia (PM) or degenerative myopia. Common pathologic findings include localized or diffuse chorioretinal atrophy, posterior staphyloma, lacquer cracks, Fuchs spots, choroidal neovascularization membrane (CNV) and fovea cleavage. In addition, progressive visual impairment is a typical result of these pathologic alterations.4 Because it refers to many different conditions, glaucoma defies a single definition. IOP is a crucial modifiable factor in all types of illness with a similar symptom: a potentially progressive optic neuropathy coupled with visual field loss as damage advances.5 The human eye’s retinal vascular system is segmented into four capillary plexuses along its axial axis, the nerve fiber layer vascular plexus (NFLVP), superficial vascular plexus (SVP), intermediate capillary plexus (ICP), and deep capillary plexus (DCP) are four different nerve plexuses extending from retinal anterior edge to more posterior axis.6 Recently, non-invasive imaging of the retina’s and choroid’s microvasculature has been possible with OCT-A, which employs laser light reflected from circulating RBCs’ surface to correctly display veins in various anatomically divided eye sections.7 The primary purpose of the research was to perform a qualitative and quantitative assessment of macular and peripapillary vessels to detect the impairment of blood flow in a glaucomatous patient with or without myopia, which can affect the prognosis of glaucoma and the visual field.
Patients and Methods
Type of Study: It was prospective, cross-sectional, observational research for glaucomatous cases with and without myopia.
Study setting: outpatient clinic at ophthalmology department; Benha University.
Study Period: twelve months from (1 February 2021) to (1 February 2022).
Study Population: The study was performed on 50 subjects with glaucomatous eyes (primary opening angle glaucoma); there were 2 groups: the primary group consisted of (25 Subjects) with glaucoma with myopia, and the second group (25 Subjects) of glaucoma with the same severity of mean deviation in the visual field of group 1 without myopia.
Inclusion criteria: Myopia (low ranged from −0.50D to below −3.00D, moderate from −3.00D to below −6.00D and severe more than −6D), age more than 20 years, both genders, no history of diabetes mellitus and hypertension and suitable candidates for OCTA imaging (no media opacity).
Exclusion criteria: We excluded patients with eye diseases that could affect retinal vasculature apart from glaucoma and myopia. All patients with a history of significant eye trauma, eye surgery or systemic conditions affecting the retina, macula and optic disc, cataract, refractive, and glaucoma surgery were also excluded. Patients with diabetic retinopathy, other macular vascular diseases, pseudo-exfoliated glaucoma, symptoms or history of central serous chorioretinopathy, hereditary retinal dystrophy, and those with low-resolution images in OCTA were not included in our study.
Methods
The following data will be obtained for each study participant; demographic; age, gender, history of previous intraocular surgery, any associated systemic, metabolic, or neurologic diseases and previous ocular trauma.
All Patients Will Be Submitted to the Following
Complete ophthalmological examinations including Gonioscopy, measurement of IOP with Goldman applanation tonometer, measurement of uncorrected visual acuity (UCVA) with Snellen’s chart, and measurement of BCVA with Snellen’s chart after auto-refractometer. Bio microscopy with a +90D lens and an indirect ophthalmoscope with a +20D lens (to examine the center and edges of the retina) are used to conduct a thorough fundus examination (for evaluating the posterior pole). Visual field assessment: Applying HUMPHREY FIELD ANALYZER (MODEL745i) Carl Zeiss Meditec Inc. Dublin, CA, USA. Optical coherence tomography angiography: for measuring SUPERFACIAL VESEEL DENESTY AND OCT THICKNESS ILM-RPE, RNFL THICKNESS, GCL and SMALL VESEEL DENESTY (RADIAL PERI PAPILLARY PLEXUS). Optovue was used for the OCTA imaging (Model Avanti Scanner, number P/N (500–50845-002), QTY: 1Ea, made in (U.S.A), MDSS GmbH Schiffgraben 4130175 Hannover Germany).
Depending on Split Spectral Amplitude Decorrelation Angiography (SSADA), a method for extracting angiographic data from optical coherence tomography scans. The device has an illumination source with a central wavelength of 840 nm and a spectral width of 50 nm.
It acquires 70,000 A-scans per second with an axial resolution of 5 μm and a horizontal resolution of 20 μm. A-scans are 304 × 304 pixels in size and can be found in each OCTA volume.
Ethical Consideration
Nothing that may be considered damaging will be done. Participants should be given a clear explanation of the study’s goals. Without the patient’s consent, no information collected will be shared with anyone outside the research team. Participants may discontinue the study at any time and for any reason. Research can only be carried out with the free and voluntary participation of the subjects and their informed consent. All participants provided informed consent in accordance with the Declaration of Helsinki. For quantitative data, mean, SD and unpaired Student’s t-test were used to compare 2 groups. For qualitative data, the chi-square test was used for distinguishing between groups. The linear correlation coefficient was used to detect the relationship between the two groups of quantitative data. Variables within a single group via (IBM SPSS Windows Statistics, version 20.0. Armonk, New York: IBM Corporation). Ethics and Scientific Research Committee approval number: (MS14-2-2021) granted from Benha University Ethical Committee.
Results
It is prospective, cross-sectional, observational research was done on 50 eyes of glaucomatous cases with myopia (9 with mild, 9 with high and 32 with moderate myopia) and 50 eyes of glaucomatous patients without myopia with the same severity of glaucoma according to the severity of mean deviation in the visual field, both aged more than 20 years old who attend the outpatient clinic at ophthalmology department; Benha university.
Regarding demographic data of the studied eyes, there were aged more than 20 years, with a mean of 56.86 ± 10.46 years in the group (1) and a mean of 56.25 ± 8.83 years in the group (2). There were 17 (58.6%) males, 12 (41.4%) females in group (1) and 16 (50%) males, 16 (50%) females in group (2). There were 25 (50%) right eye, 25 (50%) left eye in group (1) and 26 (52%) right eye, 24 (48%) left eye in group (2). Age, sex, and laterality of the eyes were not significantly different (p-value >0.5) Table 1.
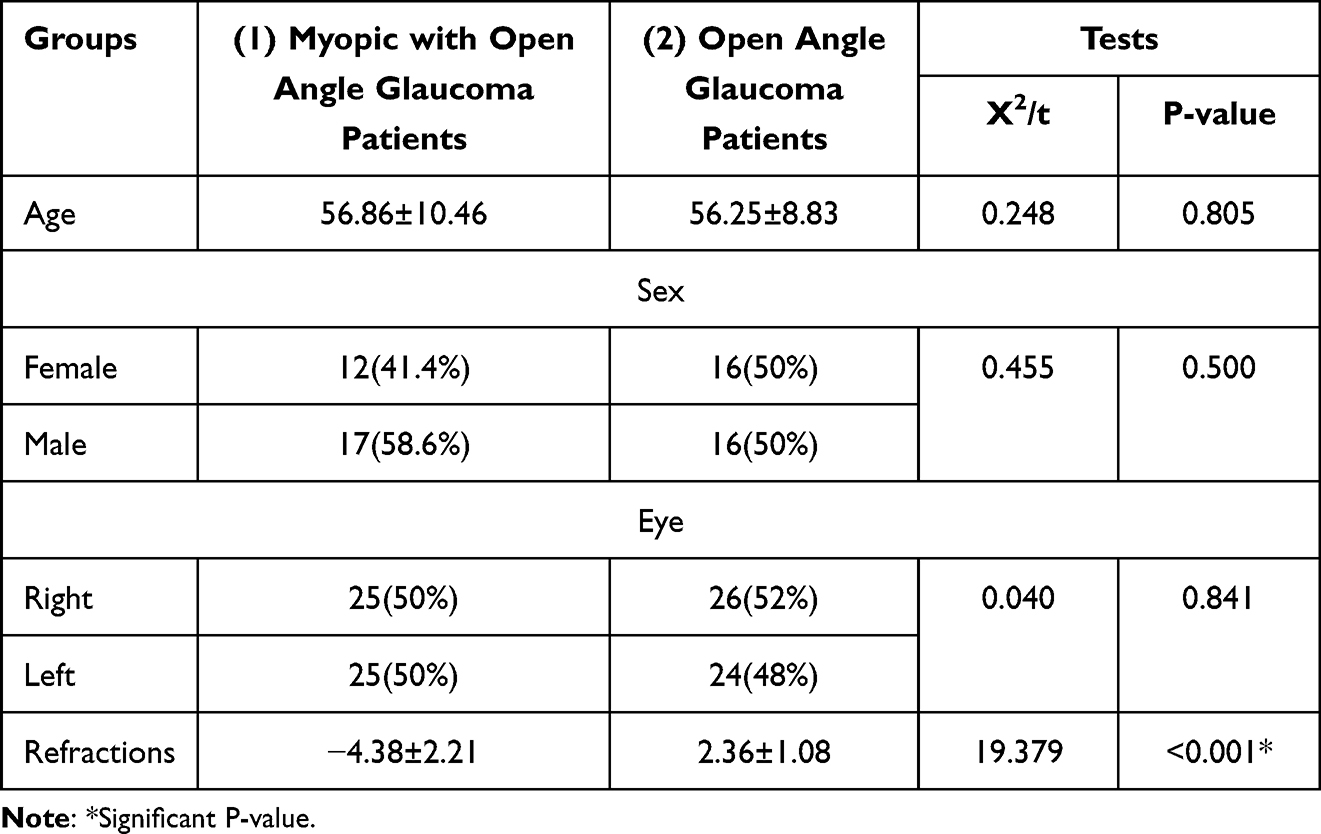 |
Table 1 Baseline Characteristics of the Studied Eyes |
Regarding demographic data of glaucoma measurements in both groups, there was a controlled glaucomatous patient with an IOP mean of (26.12 ± 5.85) mmHg in group (1) and a mean of (26.86 ± 3.25) mmHg in group (2). There was a Cup/disc ratio mean of (0.63 ± 0.18) in group (1) and a mean of (0.68 ± 0.19) in group (2) Table 2.
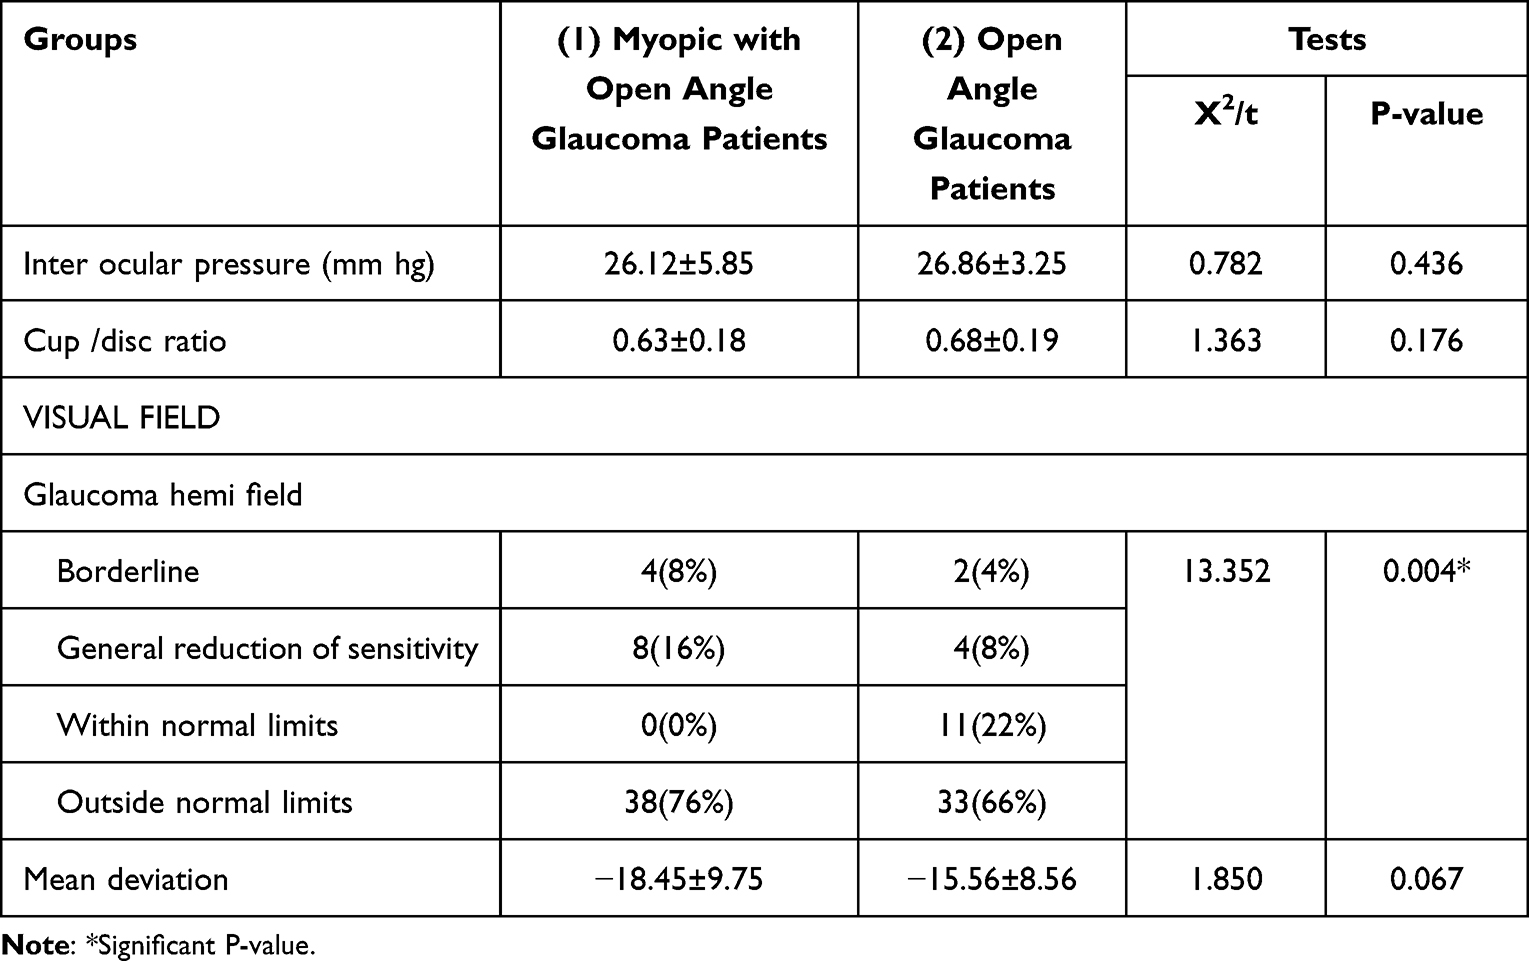 |
Table 2 Glaucoma Measurements of the Studied Eyes |
Myopic with open-angle glaucoma patients showed a significant decrease in average GCL, superior GCL and inferior-GCL compared to open-angle glaucoma patients Table 3.
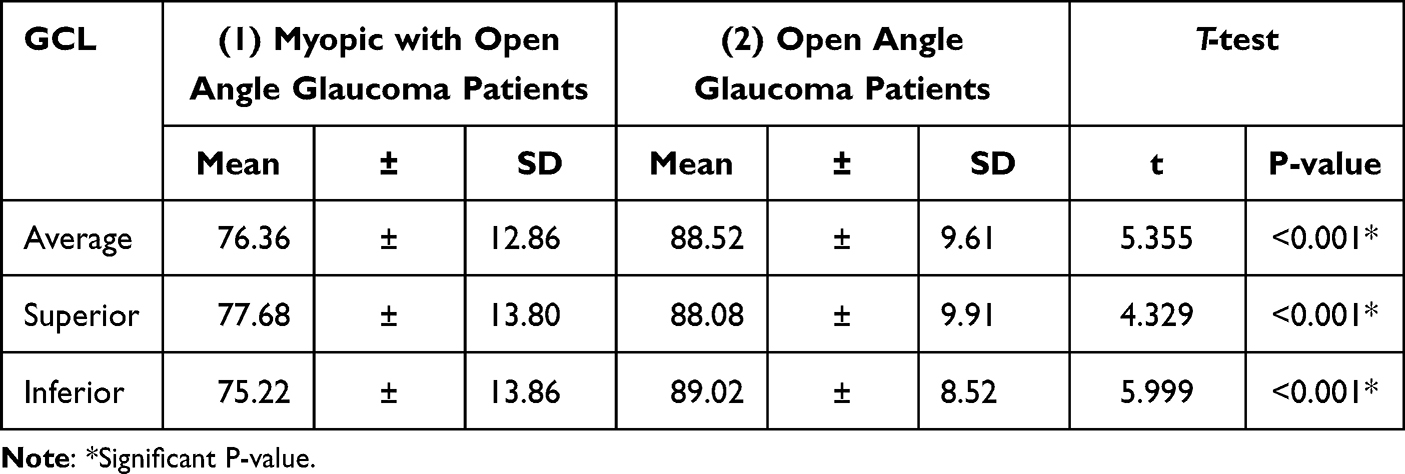 |
Table 3 Ganglion Cell Layer Measurements of the Studied Eyes |
In low myopia, no significant differences were found between myopic with open-angle glaucoma cases and open-angle glaucoma cases without myopia regarding average GCL, superior GCL and inferior-GCL Table 4.
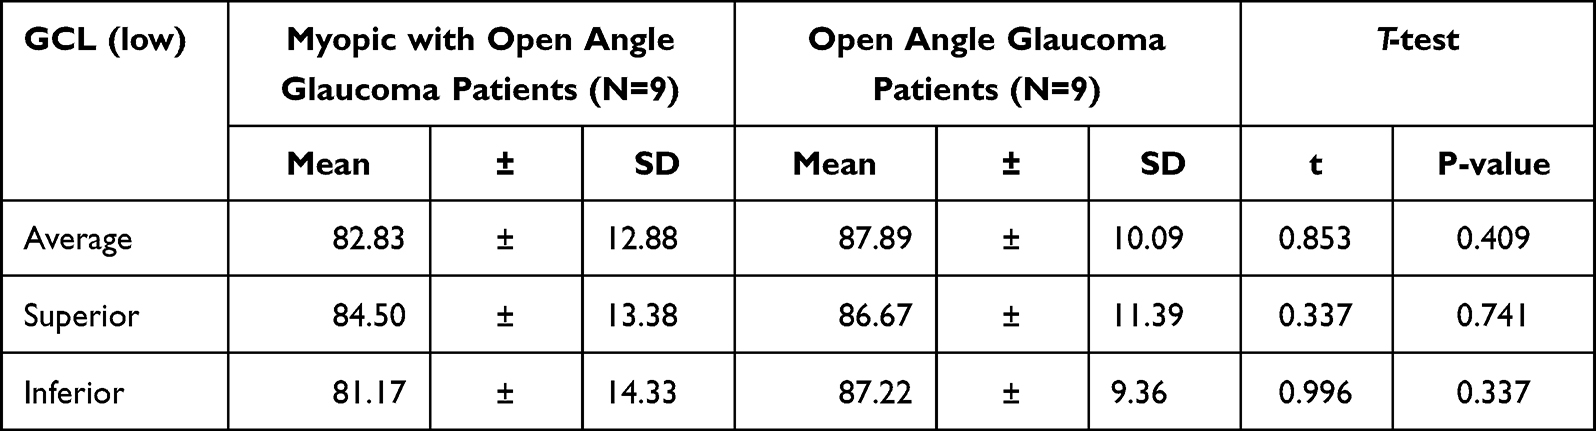 |
Table 4 Ganglion Cell Layer in Low Myopia Group with Same Mean Deviation of Glaucoma in Other Group |
In high myopia, myopic with open-angle glaucoma patients showed a significant decrease in average GCL, superior GCL and inferior-GCL when compared to open-angle glaucoma patients Table 5.
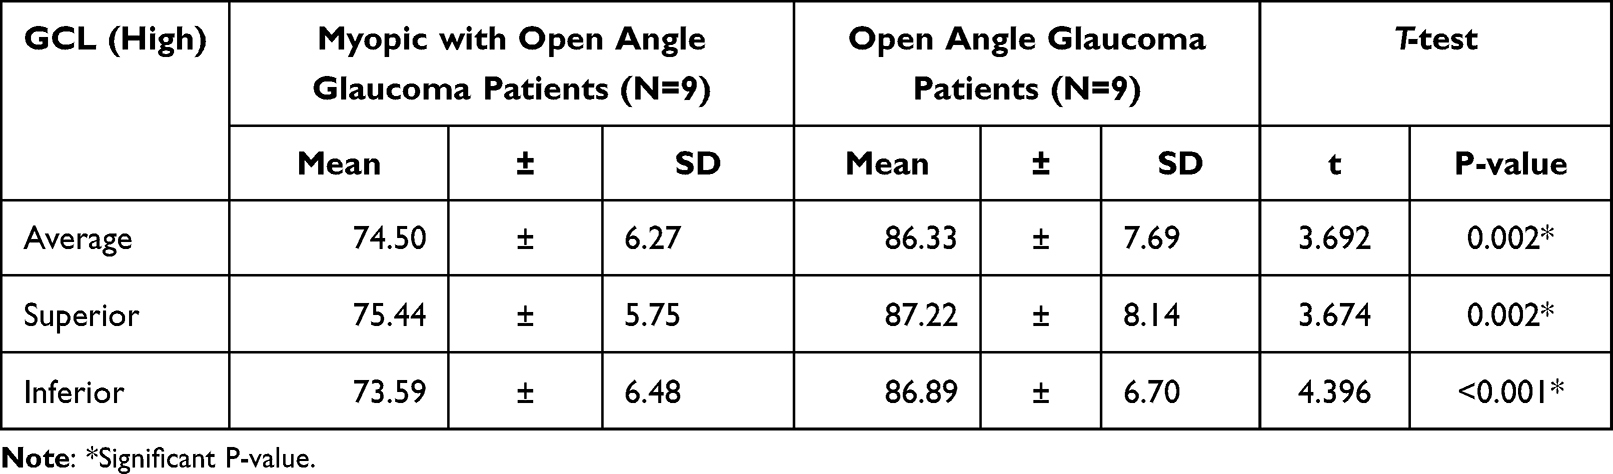 |
Table 5 Ganglion Cell Layer in High Myopia Group with Same Mean Deviation of Glaucoma in Other Group |
Myopic with open-angle glaucoma patients showed a significant decrease in superior-hemi macular density, superior-hemi macular density, whole image macular thickness and inferior-hemi macular thickness compared to open-angle glaucoma patients Table 6.
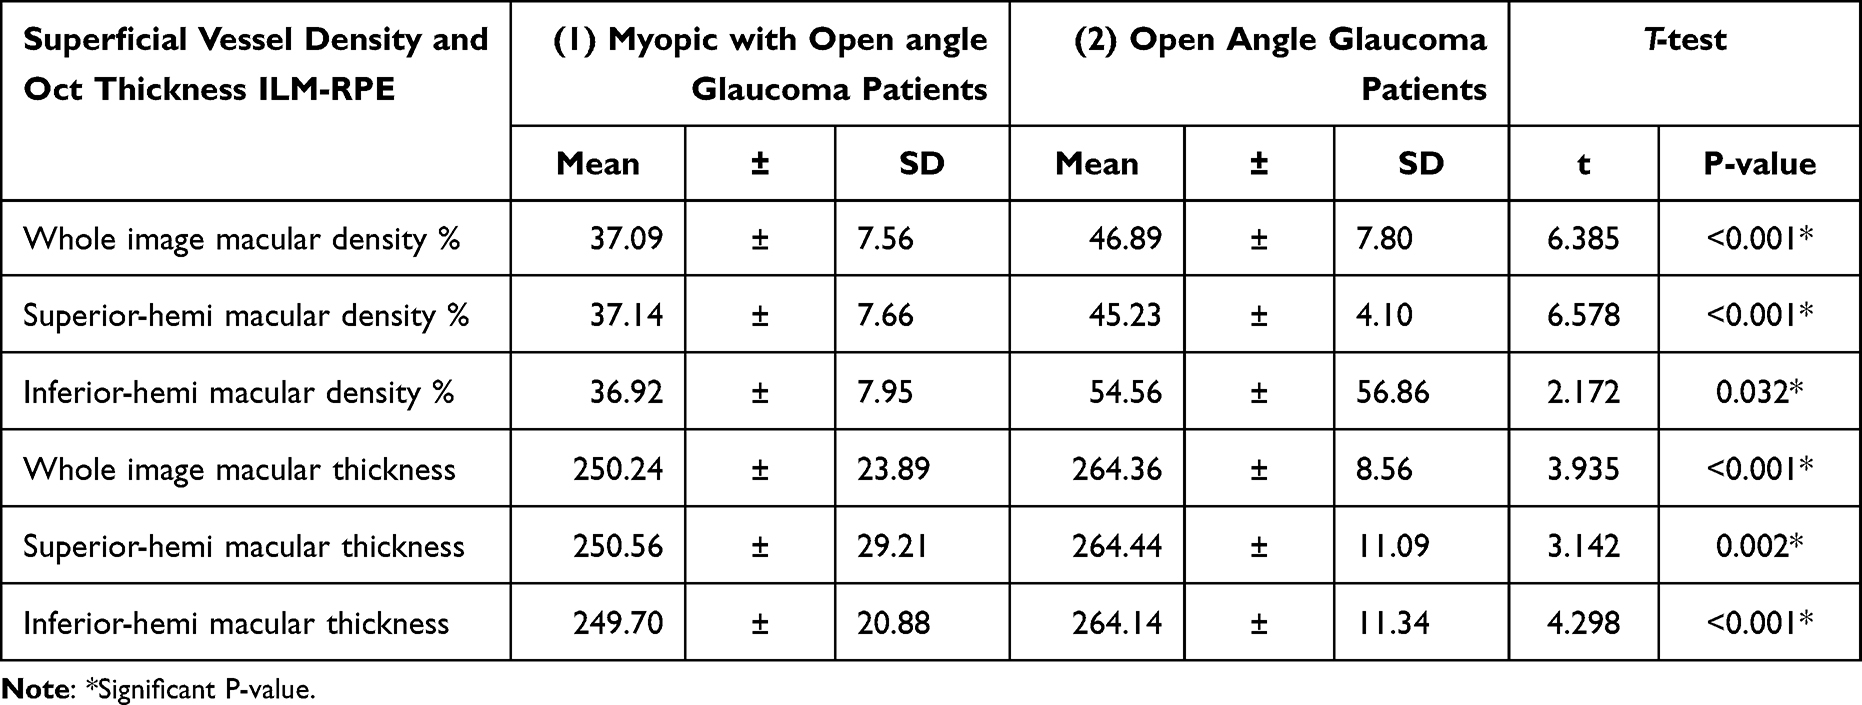 |
Table 6 Superficial Vessel Density and OCT Thickness ILM-RPE of the Studied Eyes |
In low myopia, no significant differences were found between myopic with open-angle glaucoma cases and open-angle glaucoma cases without myopia regarding superior-hemi macular density, whole image macular thickness and inferior-hemi macular thickness Table 7.
 |
Table 7 Superficial Vessel Density and OCT Thickness ILM-RPE in Low Myopia Group with Same Mean Deviation of Glaucoma in Other Group |
Whole macular density, upper half macular density, lower half macular density, and lower half macular thickness were significantly reduced in patients with high myopia and open-angle glaucoma Table 8.
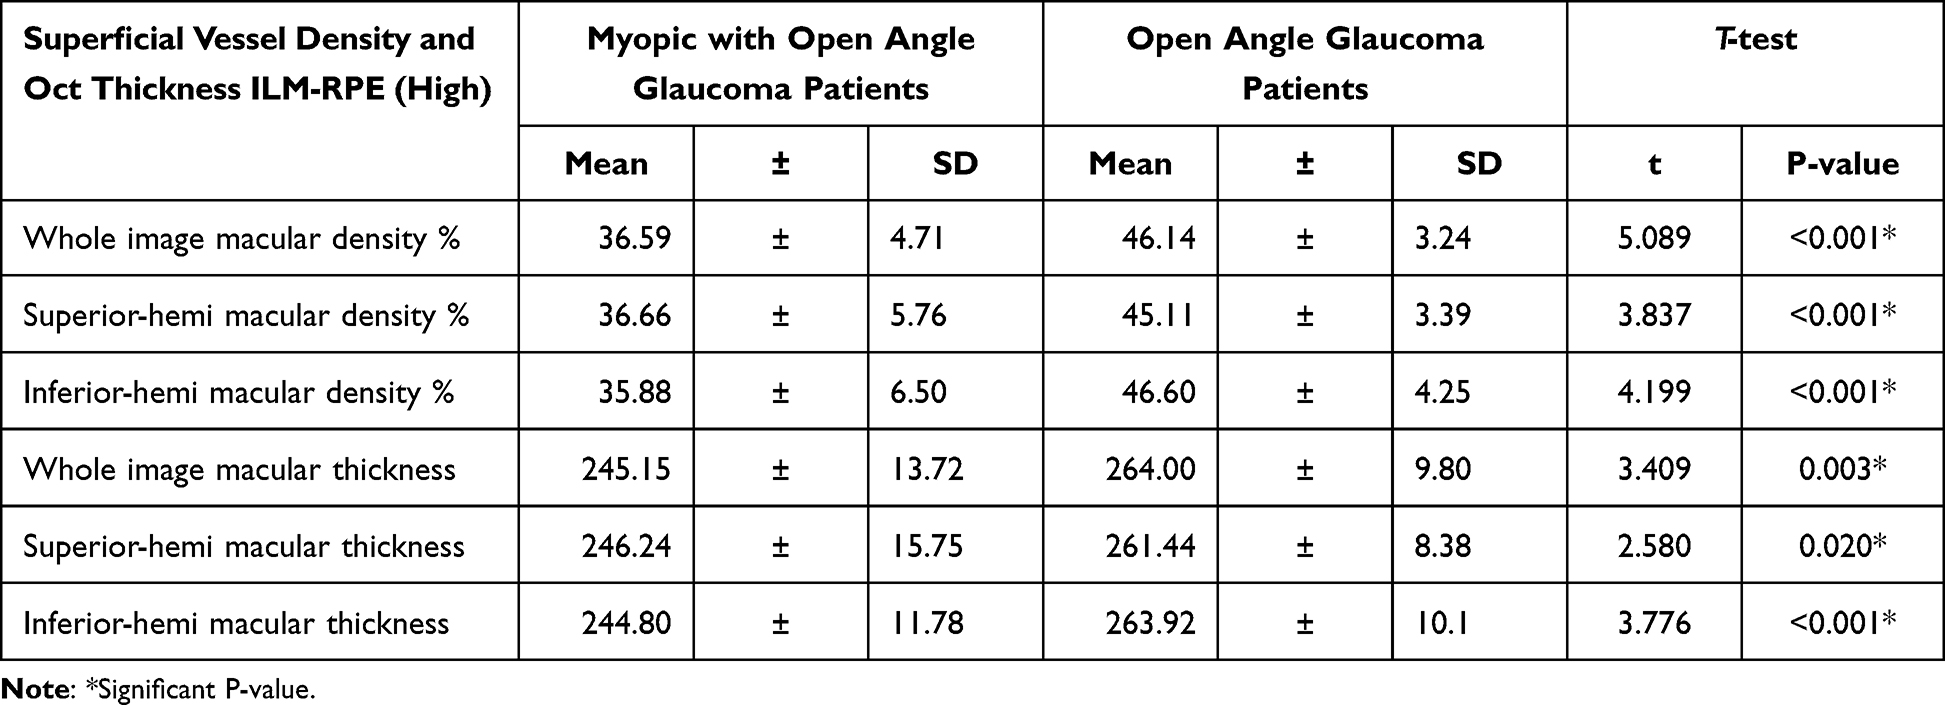 |
Table 8 Superficial Vessel Density and OCT Thickness ILM-RPE in High Myopia Group with Same Mean Deviation of Glaucoma in Other Group |
Patients with myopic open-angle glaucoma had significantly decreased total RNFL thickness, superior nasal RNFL thickness, inferior nasal RNFL thickness, superior temporal RNFL, and inferior temporal RNFL thickness compared with non-myopic open-angle glaucoma patients Table 9.
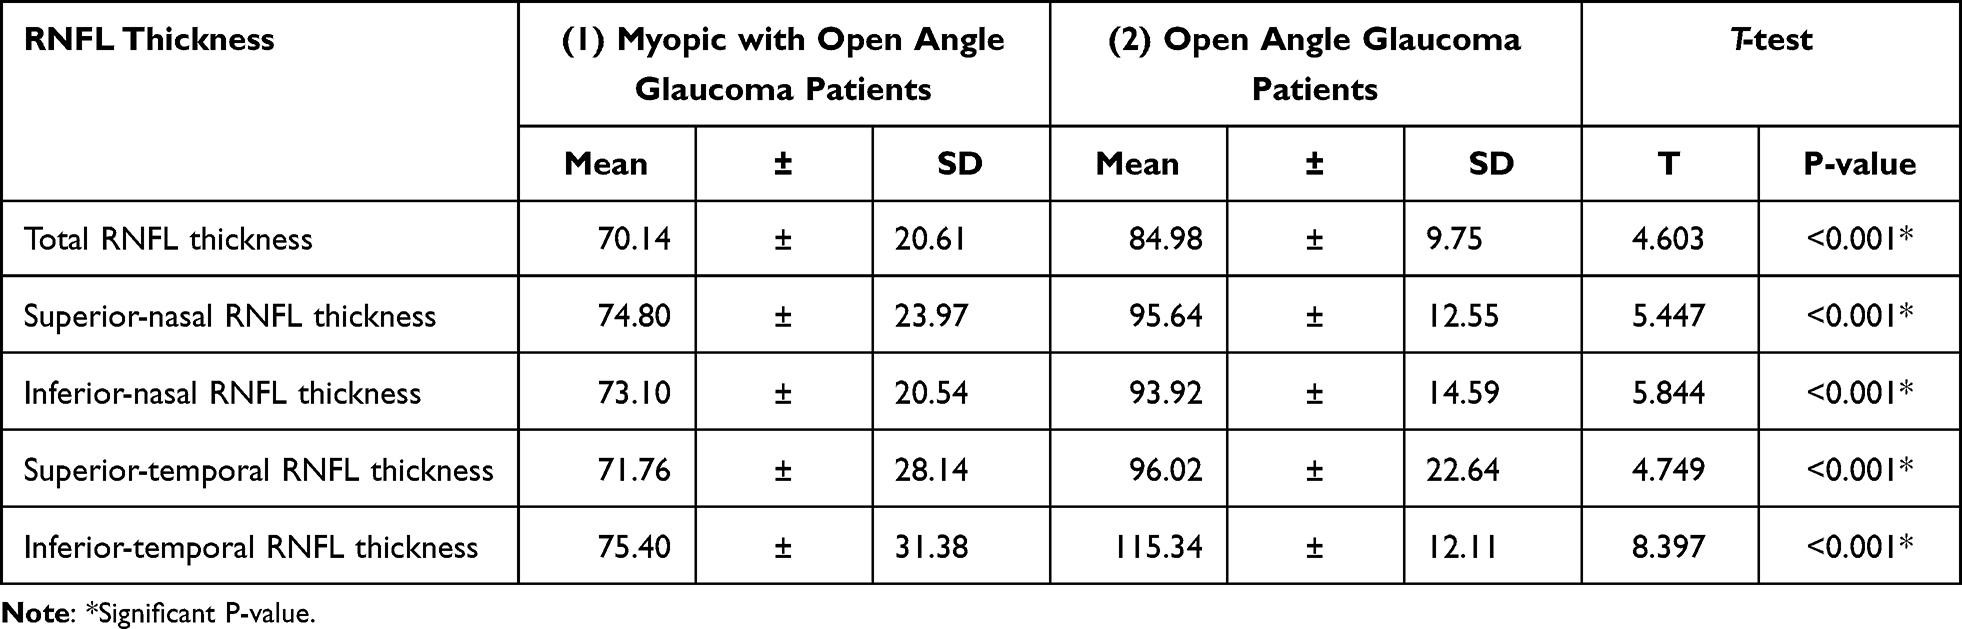 |
Table 9 Retinal Nerve Fiber Layer Thickness of the Studied Eyes |
In low myopia, there was no significant difference in total RNFL thickness, upper nasal RNFL thickness between myopic open-angle glaucoma patients and non-myopic open-angle glaucoma patients, inferior nasal RNFL thickness, superior temporal RNFL thickness and inferior temporal RNFL thickness Table 10.
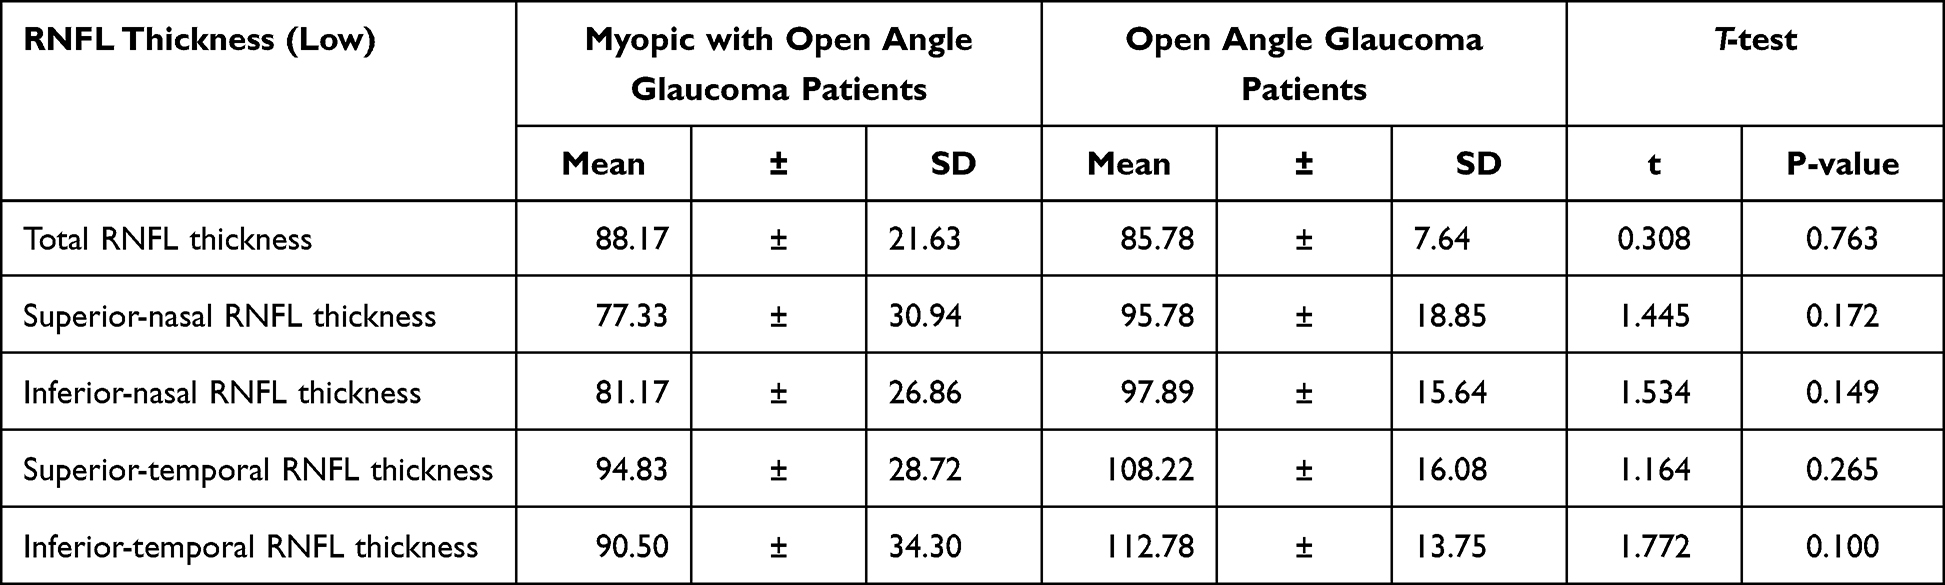 |
Table 10 Retinal Nerve Fiber Layer Thickness in Low Myopia Group with Same Mean Deviation of Glaucoma in Other Group |
In high myopia, myopic with open-angle glaucoma patients showed a significant decrease in inferior-nasal RNFL thickness, superior-nasal RNFL thickness and inferior-temporal RNFL thickness Table 11.
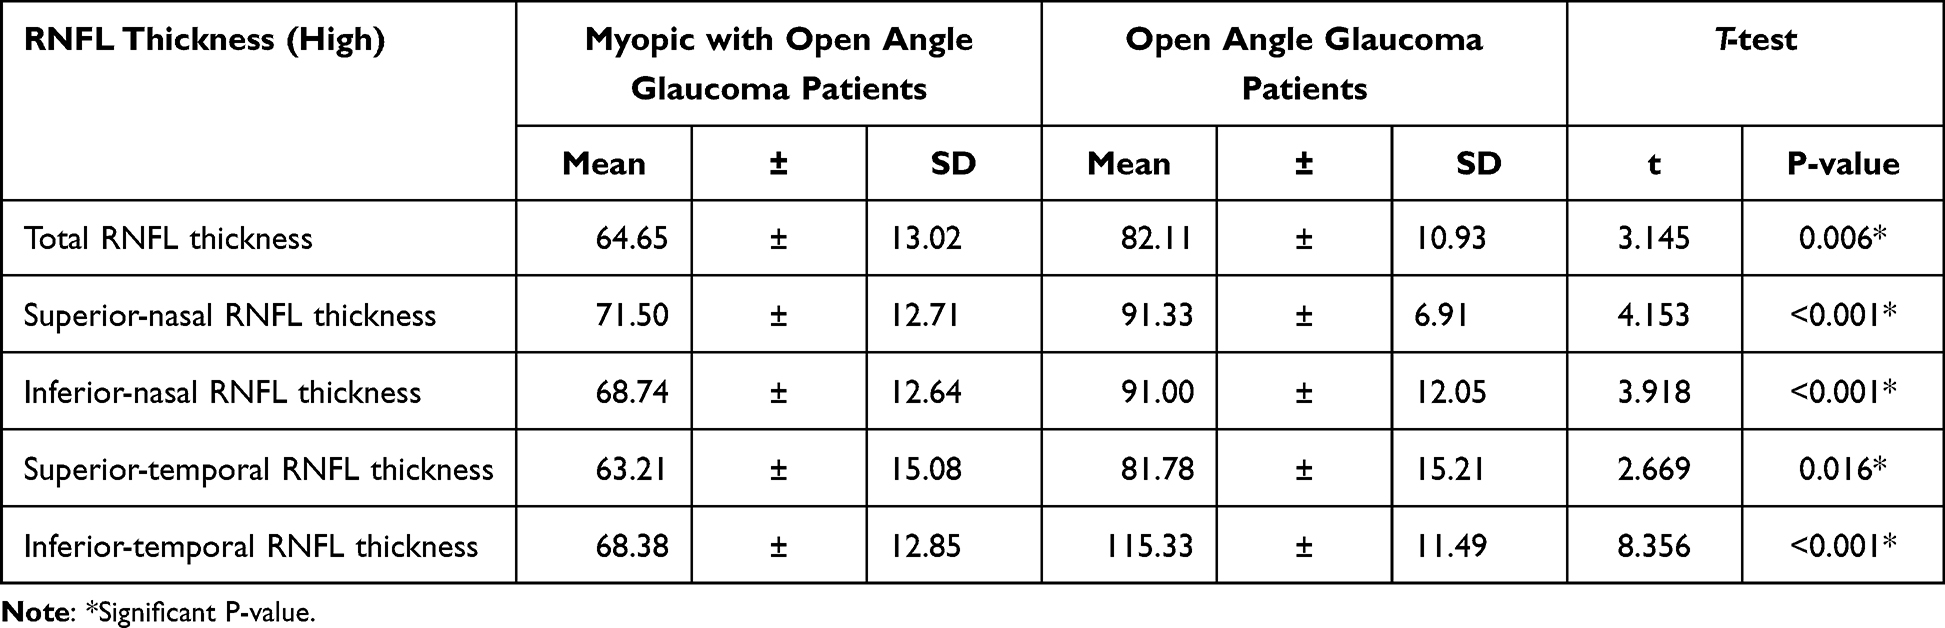 |
Table 11 Retinal Nerve Fiber Layer Thickness in High Myopia Group with Same Mean Deviation of Glaucoma in Other Group |
Myopic with open-angle glaucoma patients had significantly lower overall optic disc image density, the upper half of the optic disc peripapillary density, and the lower half of the optic disc peripapillary density compared to open-angle glaucoma patients Table 12.
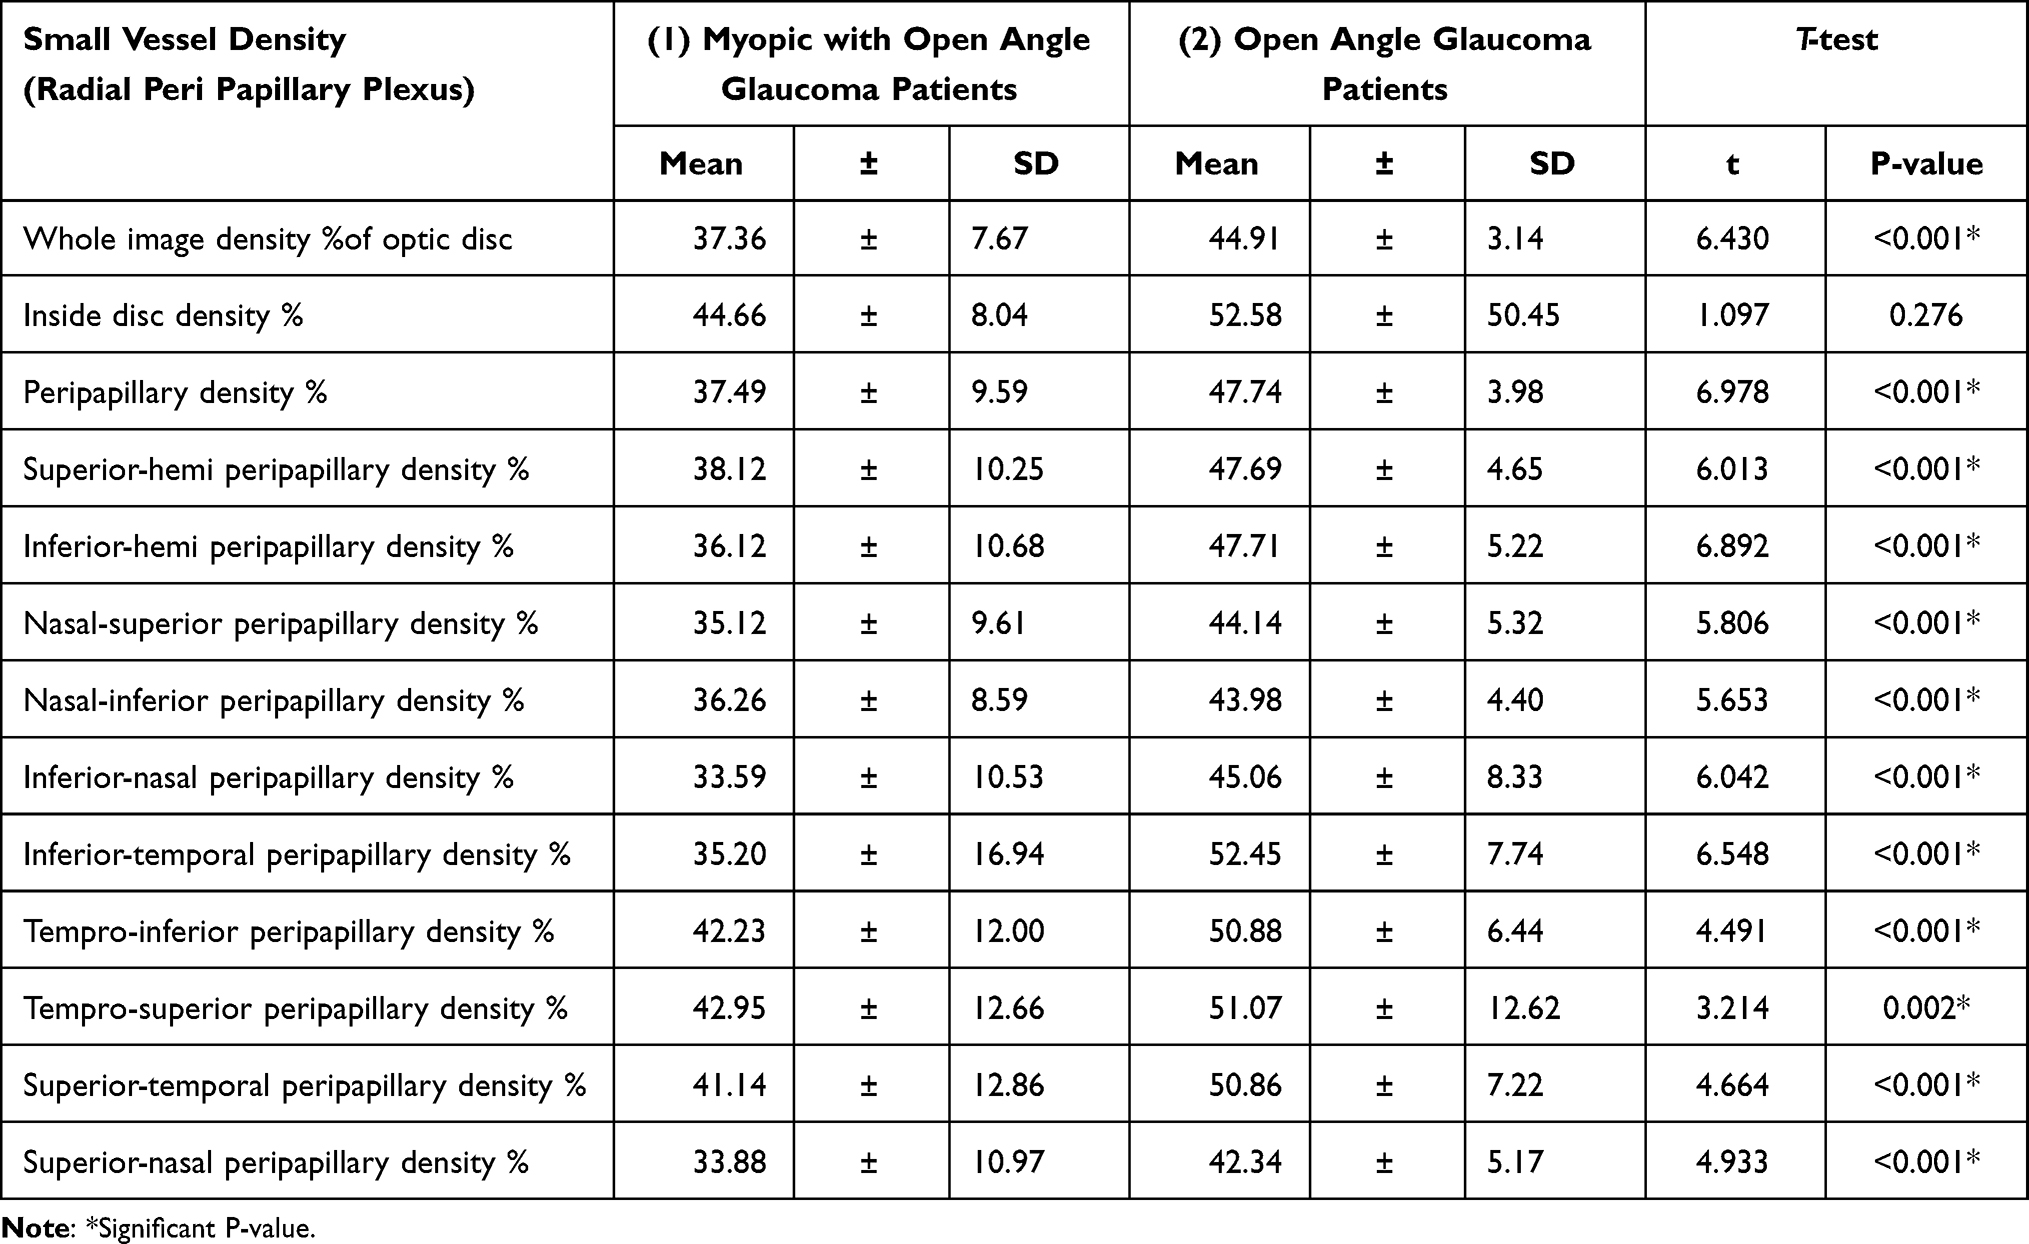 |
Table 12 Small Vessel Density (Radial Peri Papillary Plexus) of the Studied Eyes |
This table shows the correlation between ganglion cell layer and superficial vessel density and OCT thickness ILM-RPE in non-myopic groups. An extremely +ve association was discovered among average with superior-hemi macular density (r = 0.291). Also, there was a substantial +ve association amongst inferior with superior-hemi macular density (r = 0.3311, p = 0.028) Table 13.
 |
Table 13 Correlation Between Ganglion Cell Layer and Superficial Vessel Density & OCT Thickness ILM-RPE in Non-Myopic Groups |
In the correlation between ganglion cell layer and superficial vessel density and OCT thickness ILM-RPE in myopic groups, there was a significant positive connection amongst whole image macular density, Superior-hemi macular density, whole image macular thickness and lower-hemi macular thickness with upper and average GCL superior GCL (p-value = <0.001*) Table 14.
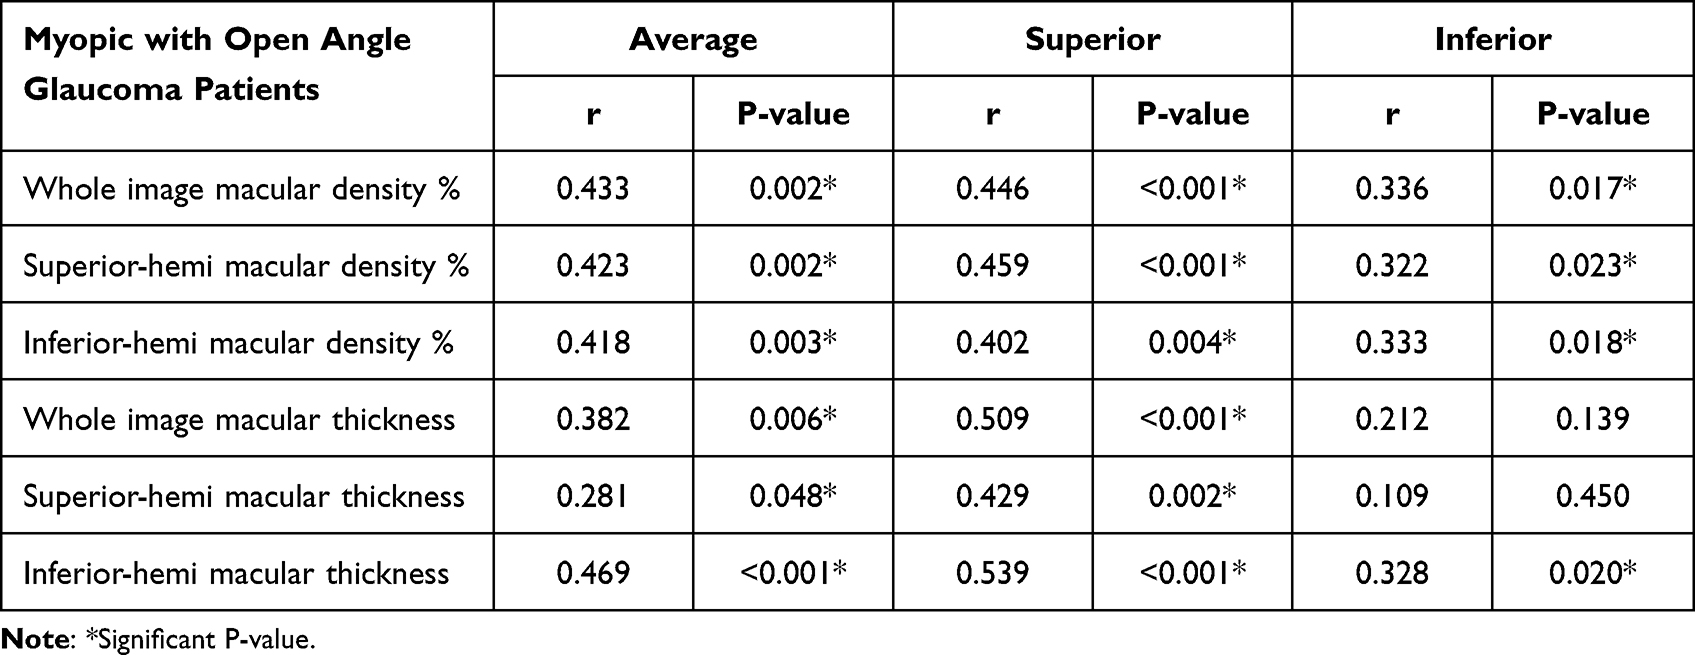 |
Table 14 Correlation Between Ganglion Cell Layer and Superficial Vessel Density & OCT Thickness ILM-RPE in Myopic Groups |
In the correlation between RNFL thickness and small blood vessel density in myopic people, the whole thickness of RNFL was highly positive with the optic disc whole density (r = 0.823), peripapillary density (r = 0.808), and inside disc density (r = 0.458), superior-hemi peripapillary density (r = 0.839) and inferior-hemi peripapillary density (r = 0.544) Table 15.
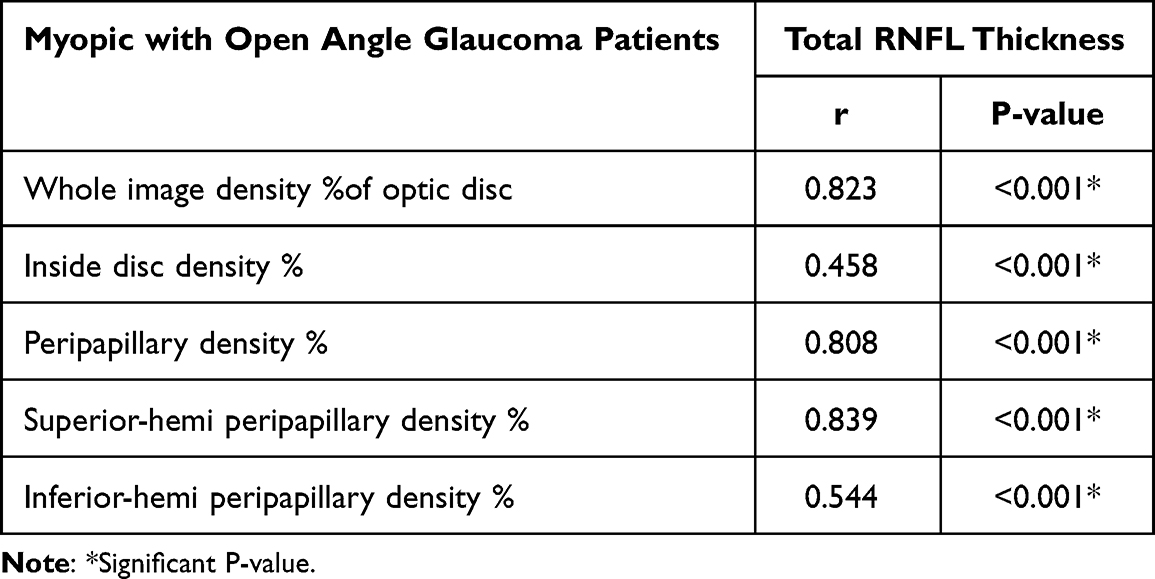 |
Table 15 Correlation Between Retinal Nerve Fiber Layer Thickness and Small Vessel Density (Radial Peri Papillary Plexus) in Myopic Groups |
In the correlation between RNFL thickness and small blood vessel density in non-myopic groups a strong +ve association existed amongst total RNFL thickness with a whole image density of optic disc (r = 0.343), peripapillary density (r = 0.315), inside disc density (r = −0.102), superior-hemi peripapillary density (r = 0.173) and inferior-hemi peripapillary density (r = 0.338) Table 16.
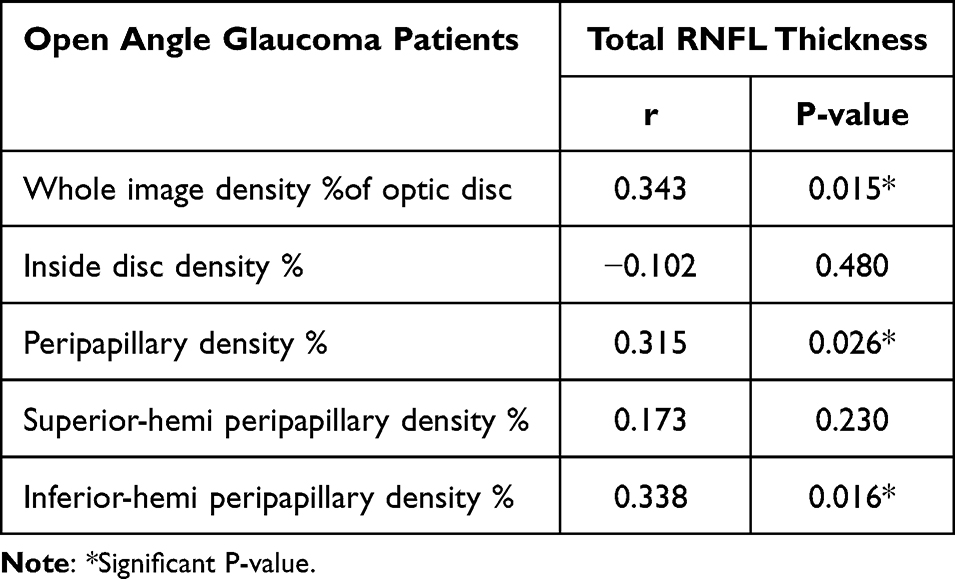 |
Table 16 Correlation Between Retinal Nerve Fiber Layer Thickness and Small Vessel Density (Radial Peri Papillary Plexus) in Non-Myopic Group |
Discussion
In high myopic patients, retinal blood vessel density is reduced, and blood flow in the large retina is impaired. Blood vessels are visible on (OCTA), primarily as diminish of the blood vessels’ diameter.8 The pathophysiological mechanism of myopia in glaucoma patient remains unclear. In addition, reduced blood flow increases the vulnerability of the optic nerve head. Additionally, increased IOP due to stress or strain on lamina cribrosa and peripapillary sclera.1 OCTA is a new non-invasive imaging technique that has been widely used in retinal pathology research and glaucoma and is a relatively dye-free imaging modality that permits qualitative and quantitative assessment of the vasculature of the retina and optic nerve head.9
Our results were supported by a study of Chang et al,10 as they reported that there was no significant difference in mean VF defect between the non-highly myopic glaucoma group (mean [SD], 2.98 [2.12]) and highly myopic glaucoma group (mean [SD], 2.73 [2.22]).
While the study of Lee et al,11 there was a significantly worse VF’s mean deviation in glaucoma in 2 groups. VF defects in eyes with non-myopic glaucoma, 24 had both upper and lower hemi VFD, 18 had upper, and 12 had lower VFD (P = 0.231).
Current study showed that high myopia with open-angle glaucoma patients showed a significant decrease in average GCL, superior GCL and inferior-GCL when compared to open-angle glaucoma without myopia and low myopic patients (Figures 1 and 2).
 |
Figure 1 Ganglion cell layer of a high myopic eye with open-angle glaucoma by OCTA. |
 |
Figure 2 Ganglion cell layer of a low myopic eye with open-angle glaucoma by OCTA. |
While in the study of Lee et al,11 the infratemporal macular layer had significant difference in thickness between normal and glaucomatous eyes without high myopia eyes and high myopia with age-adjusted, macular GCIPL thickness was greater in non-myopia than in high myopia. A study by Chang et al,10 macular GCIPL thickness was more significant in normal than glaucoma patients. The temporal part in the high myopic patient was thicker in the normal than in glaucoma, whether in the non–myopic or in the myopic group. However, the study of Hou et al,12 ganglion cell complex measurements showed a similar effect in detecting early glaucoma. In our study, high myopia with open-angle glaucoma patients showed a significant decrease in superior-hemi macular density, whole image macular thickness and inferior-hemi macular thickness compared to open-angle glaucoma without myopia and low myopic patients (Figure 3). In the study of Wan et al,13 adjustment for age, axial length, sex, and images, the glaucoma group (42.1 [4.9%]) had less intramuscular vessel density than the healthy group (46.3 [4.4%]). Similarly, the inner macular thickness is before and after adjustment; the former (77.0 [16.6] μm) is smaller than the latter (98.2 [6.4] μm). Also, Chen et al14 regarding the vessel density in the macular area, the whole image vessel density (wiVD) values of glaucomatous eyes were also lower than those of healthy eyes (38.5%±2.2% vs 43.2%±2.3%, P < 0.001), but the fovea or fovea no significant difference Area vessel density, including mean, first and second half values, and any 4 quadrants (P > 0.05 for all quadrants). The density of superior-hemi and inferior-hemi parafoveal vessels was relatively higher in glaucomatous eyes than in healthy eyes (2.7%±2.1% vs 2.2%±2.1%), but this difference did not reach statistical significance (P = 0.21). However, in the study of Hou et al12 macular vessel density measurements show similar efficiencies detection of early glaucoma in NHM patients.
 |
Figure 3 OCTA of the retina, superficial vessel density and OCT thickness ILM-RPE (macular density). |
Our study showed that high myopia with open-angle glaucoma patients showed a significant decline in superior-nasal RNFL thickness, inferior-nasal RNFL thickness, superior-temporal RNFL, inferior-temporal RNFL thickness and in total RNFL thickness, compared to open-angle glaucoma without myopia and low myopic patients (Figure 4).
 |
Figure 4 OCTA of the optic disc, small vessel density and RNFL thickness. |
While in the study of Lee et al,11 there were significant differences between normal and glaucomatous eyes in high myopia and non-high myopia in the average and inferior peripapillary RNFL thickness (all P < 0.05). There was no difference in average peripapillary RNFL thickness between non-high myopia and high myopia. After adjusting for age, the inferior peripapillary RNFL thickness was unequal. Suwan et al15 found that four distinct groups in RNFL thickness showed significant differences. This was observed among glaucoma patients, both with and without myopia.
The current study showed that high myopia with open-angle glaucoma patients showed significant decline in whole image density of optic disc, peripapillary density, superior-hemi peripapillary density, inferior-hemi peripapillary density, nasal-superior peripapillary density, nasal-inferior peripapillary density, inferior-nasal Peripapillary density, inferior-temporal peripapillary density, tempro-inferior peripapillary density, tempro-superior peripapillary density, superior-temporal peripapillary density and superior-nasal peripapillary density compared to open-angle glaucoma without myopia and low myopic patients (Figure 4).
Suwan et al,15 there was reported the efficacy of myopia on peripapillary vessel density. Using an optic disc scan 4.5 × 4.5-mm and reported no significant decrease in peripapillary VD in moderate to high myopia compared to controls. Akagi et al16 also reported similar statistical peripapillary VD in POAG patients with and without high myopia using 3 × 3 mm disc scans. The region used in both studies can be considered the inner area of the peripapillary disc VD, which is indistinguishable from non-high myopia eyes and high myopia. In the study in our hands, there was a significant positive correlation between ganglion cell layer and superficial vessel density and OCT thickness ILM-RPE in high myopic with OAG patients. In the study of Wan et al,13 inner macular vessel density and thickness were related to average vision in linear and linear macular 3 × 3-mm 2 macular areas. Non-linear regression analysis was (P < 0.001). Structural strength-functional correlation of mean inner macular thickness for linear and non-linear (decrease analysis) is a stronger confidence interval for linear and nonlinear regression, respectively. These results display that positive correlation between RNFL thickness and small vessel density in the myopic group, according to total RNFL thickness with a whole image density of optic disc, peripapillary density, inside disc density, superior-hemi peripapillary density and inferior-hemi peripapillary density. However, in non-myopic eye no significance inside the disc with total RNFL as it depends on large vessel diameter. Shin et al17 reported that better global and regional correlation of peripapillary vessel density was compared to pRNFL thickness in highly myopic glaucoma patients. It was had that peripapillary vessel density was little affected by myopia than RNFL thickness.
Conclusion
Our research shows significant microvascular attenuation in OAG patients with high myopia. In addition to the microvascular attenuation seen with myopia or OAG alone, a larger degree of attenuation is seen when both conditions coexist. Furthermore, our results showed that the development and progression of glaucoma in individuals with high myopia are more aggressive than in low or non-myopia. Therefore, using OCT-A to detect early microvascular changes in high myopia individuals helps with the early detection and management of glaucoma. Further research is needed to determine the role of OCT-A in the diagnosis and development of glaucoma in highly myopic people.
Disclosure
The authors confirm that there is no conflict of interest in this work.
References
1. Holden BA, Fricke TR, Wilson DA. Global prevalence of myopia and high myopia and temporal trends from 2000 through 2050. Ophthalmology. 2016;123(5):1036–1042. doi:10.1016/j.ophtha.2016.01.006
2. Che Azemin MZ, Mohamad Daud N, Ab Hamid F, Zahari I, Sapuan AH. Influence of refractive condition on retinal vasculature complexity in younger subjects. Scientif World J. 2014;2014:1–5. doi:10.1155/2014/783525
3. Flitcroft DI, He M, Jonas JB, et al. IMI–Defining and classifying myopia: a proposed set of standards for clinical and epidemiologic studies. Invest Ophthalmol Vis Sci. 2019;60(3):M20–M30. doi:10.1167/iovs.18-25957
4. Kumar A, Chawla R, Kumawat D, Pillay G. Insight into high myopia and the macula. Indian J Ophthalmol. 2017;65(2):85. doi:10.4103/ijo.IJO_863_16
5. Costagliola C, Agnifili L, Mastropasqua L, Di Costanzo A. Low-tension glaucoma: an oxymoron in ophthalmology. Prev Chronic Dis. 2019;2019:16.
6. Rocholz R, Corvi F, Weichsel J, Schmidt S, Staurenghi G. OCT Angiography (OCTA) in Retinal Diagnostics. In: Bille JF, editor. High Resolution Imaging in Microscopy and Ophthalmology: New Frontiers in Biomedical Optics. Cham: Springer International Publishing; 2019:pp. 135–160.
7. De Carlo TE, Romano A, Waheed NK, Duker JS. A review of optical coherence tomography angiography (OCTA). Int J Retina Vitreous. 2015;1:5. doi:10.1186/s40942-015-0005-8
8. Li M, Yang Y, Jiang H, et al. Retinal microvascular network and microcirculation assessments in high myopia. Am J Ophthalmol. 2017;174:56–67. doi:10.1016/j.ajo.2016.10.018
9. Bazvand F, Mirshahi R, Fadakar K, Faghihi H, Sabour S, Ghassemi F. The quantitative measurements of vascular density and flow area of optic nerve head using optical coherence tomography angiography. J Glaucoma. 2017;26(8):735–741. doi:10.1097/IJG.0000000000000722
10. Chang PY, Wang JY, Wang JK, Huang TL, Hsu YR. Optical coherence tomography angiography compared with optical coherence tomography for detection of early glaucoma with high Myopia. Front Med. 2022;11(8):793786. doi:10.3389/fmed.2021.793786
11. Lee K, Maeng KJ, Kim JY. Diagnostic ability of vessel density measured by spectral-domain optical coherence tomography angiography for glaucoma in patients with high myopia. Sci Rep. 2020;10:3027. doi:10.1038/s41598-020-60051-0
12. Hou H, Moghimi S, Zangwill LM, et al. Macula vessel density and thickness in early primary open-angle glaucoma. Am J Ophthalmol. 2019;199:120–132. doi:10.1016/j.ajo.2018.11.012
13. Wan KH, Lam AK, Leung CK. Optical coherence tomography angiography compared with optical coherence tomography macular measurements for detection of glaucoma. JAMA Ophthalmol. 2018;136(8):866–874. doi:10.1001/jamaophthalmol.2018.1627
14. Chen HS, Liu CH, Wu WC, Tseng HJ, Lee YS. Optical coherence tomography angiography of the superficial microvasculature in the macular and peripapillary areas in glaucomatous and healthy eyes. Invest Ophthalmol Vis Sci. 2017;58(9):3637–3645. doi:10.1167/iovs.17-21846
15. Suwan Y, Fard MA, Geyman LS, et al. Association of myopia with peripapillary perfused capillary density in patients with glaucoma: an optical coherence tomography angiography study. JAMA Ophthalmol. 2018;136(5):507–513. doi:10.1001/jamaophthalmol.2018.0776
16. Akagi T, Iida Y, Nakanishi H, et al. Microvascular density in glaucomatous eyes with hemifield visual field defects: an optical coherence tomography angiography study. Am J Ophthalmol. 2016;168:237–249. doi:10.1016/j.ajo.2016.06.009
17. Shin JW, Kwon J, Lee J, Kook MS Relationship between vessel density and visual field sensitivity in glaucomatous eyes with high myopia. Br J Ophthalmol (2018) 103:1827–1833.
 © 2023 The Author(s). This work is published and licensed by Dove Medical Press Limited. The
full terms of this license are available at https://www.dovepress.com/terms
and incorporate the Creative Commons Attribution
- Non Commercial (unported, 3.0) License.
By accessing the work you hereby accept the Terms. Non-commercial uses of the work are permitted
without any further permission from Dove Medical Press Limited, provided the work is properly
attributed. For permission for commercial use of this work, please see paragraphs 4.2 and 5 of our Terms.
© 2023 The Author(s). This work is published and licensed by Dove Medical Press Limited. The
full terms of this license are available at https://www.dovepress.com/terms
and incorporate the Creative Commons Attribution
- Non Commercial (unported, 3.0) License.
By accessing the work you hereby accept the Terms. Non-commercial uses of the work are permitted
without any further permission from Dove Medical Press Limited, provided the work is properly
attributed. For permission for commercial use of this work, please see paragraphs 4.2 and 5 of our Terms.
Recommended articles
AI-Based Ocular Age Estimation from Combined OCT and OCTA Metrics: Decade-Stratified Normative Modelling in Healthy Eyes – a Pilot Study
Pourjavan S, Nazaran N, Vaucourt T, Abdouli N, El Maftouhi A, Macq B
Clinical Ophthalmology 2025, 19:3855-3867
Published Date: 18 October 2025