Back to Journals » Cancer Management and Research » Volume 9
The effect of medication nonadherence on progression-free survival among patients with renal cell carcinoma
Authors Shafrin J, Sullivan J ![]() , Chou JW, Neely MN, Doan JF, Maclean JR
, Chou JW, Neely MN, Doan JF, Maclean JR
Received 3 August 2017
Accepted for publication 12 October 2017
Published 29 November 2017 Volume 2017:9 Pages 731—739
DOI https://doi.org/10.2147/CMAR.S148199
Checked for plagiarism Yes
Review by Single anonymous peer review
Peer reviewer comments 2
Editor who approved publication: Dr Alexandra R. Fernandes
Jason Shafrin,1 Jeffrey Sullivan,1 Jacquelyn W Chou,1 Michael N Neely,2 Justin F Doan,3 J Ross Maclean1
1Precision Health Economics, Los Angeles, CA, USA; 2Department of Pediatrics, Keck School of Medicine, University of Southern California, Los Angeles, CA, USA; 3Worldwide Health Economics and Outcomes Research, Bristol-Myers Squibb, Princeton, NJ, USA
Objective: To examine how observed medication nonadherence to 2 second-line, oral anticancer medications (axitinib and everolimus) affects progression-free survival (PFS) among patients with renal cell carcinoma.
Methods: We used an adherence–exposure–outcome model to simulate the impact of adherence on PFS. Using a pharmacokinetic/pharmacodynamic (PK/PD) population model, we simulated drug exposure measured by area under the plasma concentration–time curve (AUC) and minimum blood or trough concentration (Cmin) under 2 scenarios: 1) optimal adherence and 2) real-world adherence. Real-world adherence was measured using the medication possession ratios as calculated from health insurance claims data. A population PK/PD model was simulated on individuals drawn from the Medical Expenditure Panel Survey (MEPS), a large survey broadly representative of the US population. Finally, we used previously published PK/PD models to estimate the effect of drug exposure (i.e., Cmin and AUC) on PFS outcomes under optimal and real-world adherence scenarios.
Results: Average adherence measured using medication possession ratios was 76%. After applying our simulation model to 2164 individuals in MEPS, drug exposure was significantly higher among adherent patients compared with nonadherent patients for axitinib (AUC: 249.5 vs. 159.8 ng×h/mL, P<0.001) and everolimus (AUC: 185.4 vs. 118.0 µg×h/L, P<0.001). Patient nonadherence in the real world decreased the expected PFS from an optimally adherent population by 29% for axitinib (8.4 months with optimal adherence vs. 6.0 months using real-world adherence, P<0.001) and by 5% (5.5 vs. 5.2 months, P<0.001) for everolimus.
Conclusion: Nonadherence by renal cell carcinoma patients to second-line oral therapies significantly decreased the expected PFS.
Keywords: adherence, axitinib, everolimus, outcomes, pharmacokinetics/pharmacodynamics, progression-free survival, renal cell carcinoma, second-line
Introduction
Kidney cancer is among the 10 most common cancers in the USA.1 In 2017, there were an estimated 63,990 news cases -~3.8% of all new oncologic cases - and ~14,400 deaths recorded from kidney and renal pelvis cancer.2 Nine out of every 10 kidney cancers are renal cell carcinomas (RCCs).3 Although 5-year survival for patients with RCC has been increasing, only 23% of patients with stage IV RCC survive to 5 years.4 The majority of RCC treatments (e.g., axitinib, everolimus, pazopanib, sorafenib, sunitinib) are orally administered small molecule drugs, but some new treatments are intravenously administered (e.g., bevacizumab, nivolumab).5
Although some patients prefer convenient oral administration to more invasive intravenous administration, few patients are willing to sacrifice effective treatment response for other considerations if oral medication is not the most effective.6 Nonadherence or poor adherence to oral anticancer therapies has the potential to affect treatment effectiveness and health outcomes.7 Adherence to oral therapies for RCC has ranged from 74% to 95% in studies using claims-based measures such as medication possession ratio (MPR) or proportion of days covered.8,9 Using electronic pill counts, the share of oncology patients who took at least 80% of their prescribed doses of oral therapies for other solid tumor types ranged from 78% to 96%;10–12 adherence estimates using serum samples are lower.13 Further, healthcare providers frequently overestimate oncology patient adherence to self-administered medications.12,14
This study examined the effect of adherence to oral anticancer drugs among adult patients with RCC. We applied the dose adherence–exposure–outcome model to everolimus and axitinib – 2 of the most commonly prescribed second-line RCC treatments15 – to estimate how adherence affects drug exposure and patient outcomes. We modeled second-line treatments in RCC that had evidence linking medication exposure to patient outcomes. Building on previously published adherence models,9 we simulated pharmacokinetics/pharmacodynamics (PK/PD), building a model based on inputs from clinical trials, and estimated drug exposure in the real world by simulating different levels of adherence. We then used the modeled exposure to simulate progression-free survival (PFS) outcomes with second-line RCC treatment.
Methods
We used PK/PD modeling to estimate the effect of adherence on drug exposure and downstream outcomes for axitinib and everolimus. In this approach, we constructed a hypothetical cohort of patients that resembled an RCC population as closely as possible, and modeled the relationship between medication dosing and medication concentration in patients’ systems based on previous clinical trials. To test the impact of adherence levels on outcomes, we then varied the assumed adherence rate of our hypothetical cohort, which ultimately impacted the level of drug that was absorbed into the patient’s system. Based on the relationship between medication exposure and patient outcomes in clinical trials, our model finally simulated the effect of nonadherence on PFS for these hypothetical patients based on different assumed adherence rates.
Our framework relied on a simulation model that comprised 4 modules.7 In the first module, we used axitinib- and everolimus-recommended dosing from US Food and Drug Administration (FDA)-approved labeling.16,17 In the second module, we adapted adherence rates from published studies using claims data analyses.9 In our targeted literature reviews, we were unable to identify adherence studies specific to axitinib and everolimus in RCC patients, so instead we adapted adherence rates for modeling purposes from a real-world study of adherence rates in RCC patients. In the third module, we measured exposure by modeling PK/PD: first, by matching existing models to clinical trials assuming optimal adherence, and then incorporating measures of real-world medication adherence.18–21 In the fourth module, we translated the exposure measured with imperfect adherence rates into changes in PFS as our final outcome.20
Simulated population
Previously published exposure modeling studies did not specify correlations for the independent variables used in their models.18,20 Generating a synthetic population based purely on the summary statistics included in the literature would ignore correlations that we know to exist across race, sex, smoking, and body weight. To include reasonable correlations across the independent variables of interest, we generated a population for this study based upon patients diagnosed with any cancer in the 2012 Medical Expenditure Panel Survey (MEPS).22 There were 2164 patients in the MEPS cohort with observed sex, age, body mass index, smoking status, and ethnicity. Because MEPS reports body mass index, not height and weight, some assumptions were required to obtain height and weight (Supplementary material). The simulation population was bootstrapped from the MEPS population of 2164 patients (weighted to be nationally representative) to achieve an unweighted sample of 21,640 individual records.
Dose and adherence
The recommended doses for axitinib and everolimus were identified from their respective FDA labels. Axitinib (5 mg) is taken orally every 12 h,17 whereas everolimus (10 mg) is taken orally once every 24 h.16
Two separate dosing schedules were derived for each patient in the simulation: optimal adherence and real-world adherence. In the optimal adherence schedule, patients took the medication exactly as prescribed. In the real-world adherence schedule, previously published adherence rates were used. The adherence rate for everolimus was reported previously and used for both everolimus and axitinib, as the latter had not been reported in the literature (Supplementary material).9 Nonadherence was assumed to occur along 2 dimensions: taking the medication at a different time of day than prescribed or not taking the medication (Supplementary material). Failure to take the medication was measured using the MPR, defined as the total days of supply during the treatment period until the date of the last prescription divided by the total treatment period until the date of the last prescription administration claim.
Exposure and outcomes
Dosing regimen was converted into measures of drug exposure using previously published PK models for axitinib and everolimus. The key exposure metrics used in the model were area under the plasma concentration–time curve (AUC) and minimum blood or trough concentration (Cmin). Mean and median AUC and Cmin levels were extracted, in addition to the PK diagnostic plots for visual predictive checks (Supplementary material). The identified population PK models for axitinib and everolimus used 2 compartments with the first-order lag time.18,20,21,23 Exposure was measured with AUC for axitinib (mean: 375 ng×h/mL)20 and everolimus (mean: 120 µg×h/L).18 Exposure for everolimus was also measured with Cmin (mean: 12.1 µg/L).18 The Pmetrics v1.5.0 software package for R19 was used to simulate patient drug exposure based on optimal and real-world adherence. The model fit was compared versus average and median AUC and Cmin levels, and the blood concentration diagnostic plots with the corresponding figures in the published literature (Figures S1 and S2).
Using the relationship between blood concentration and PFS in published studies, we modeled the effect of changes in AUC on PFS for axitinib and changes in Cmin on PFS for everolimus. Different exposure units were used because studies estimated the effect of drug exposure on PFS (i.e., PD) using different exposure metrics (namely, AUC for axitinib and Cmin for everolimus). For axitinib, the PFS hazard ratio was 0.909, indicating that a 100-unit increase in AUC decreased the PFS hazard by 9.1%.20 For everolimus, the effect of exposure on PFS was stratified into 3 exposure groups by Cmin: 4.47 months for Cmin <10 ng/mL, 5.52 months for Cmin between 10 and 30 ng/mL, and 5.36 months for Cmin >30 ng/mL.24 PFS was computed for each patient in the simulation, across 10 replications, under both real-world and optimal adherence; the difference in outcomes was the impact of adherence on PFS.
Results
Our literature review identified sufficient parameters to conduct the simulation exercise for all 4 phases of the model. Table 1 describes the key parameters of interest. Axitinib and everolimus dosing was obtained from their FDA labels. Mean MPR was 0.76, and increased drug exposure increased median PFS for both axitinib and everolimus.
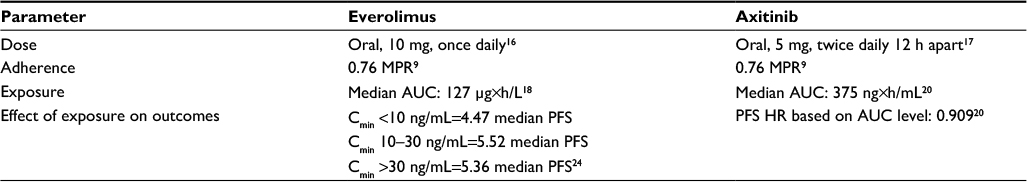 | Table 1 Model parameters used in the simulation Abbreviations: AUC, area under the plasma concentration–time curve; Cmin, minimum blood or trough concentration; HR, hazard ratio; MPR, medication possession ratio; PFS, progression-free survival. |
Over 60% of our patient population was older than 60 years of age and the mean weight was ~81 kg (Table 2).
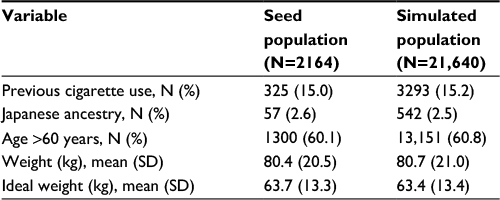 | Table 2 Summary statistics of population Abbreviation: SD, standard deviation. |
Each patient was assigned an overall adherence rate drawn from the full distribution of MPR as reported previously.9 Mean MPR was 0.76 for everolimus; only 25.3% of patients had optimal adherence (MPR=1). Due to the small sample size of axitinib patients in the cited analysis, we assumed that MPRs for everolimus and axitinib were identical.9 Overall, 46.4% of the simulated population was adherent (MPR≥0.80), 41.2% were moderately adherent (0.50≤MPR<0.80), and 12.4% of patients had poor adherence (MPR<0.50).
After incorporating patient nonadherence, average drug exposure declined significantly. Patients treated with everolimus with MPR≥0.80 adherence had an average Cmin of 14.0 versus 8.9 μg/L among patients with MPR <0.80. For axitinib, the corresponding Cmin values were 3.1 and 1.8 ng/mL, respectively. Lower adherence rates also led to lower drug exposure when exposure was measured using AUC. For everolimus, AUC was 185.4 μg×h/L among patients with MPR ≥0.80, but only 118.0 μg×h/L among patients with MPR <0.80. The corresponding AUCs for patients using axitinib were 249.5 and 159.8 ng×h/mL for adherent and nonadherent patients, respectively. Both measures of drug exposure (AUC and Cmin) were significantly reduced due to nonadherence (P<0.001) for both medications versus optimal adherence (Figure 1A, B).
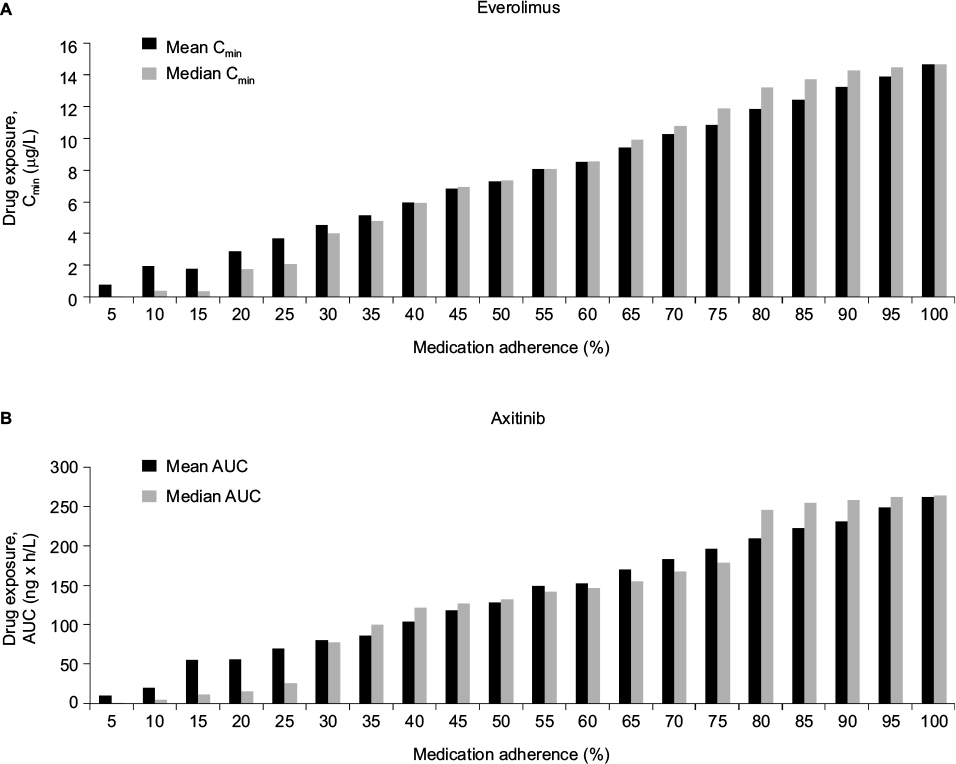 | Figure 1 Mean drug exposure by patient adherence group for patients treated with everolimus (A) and with axitinib (B). Abbreviations: AUC, area under the plasma concentration–time curve; Cmin, minimum blood or trough concentration. |
In our simulation model, real-world PFS for patients with RCC using oral treatments was significantly lower than PFS in clinical trials. We compared the predicted PFS based on exposure levels derived from real-world adherence levels versus PFS levels with optimal adherence. As shown in Figure 2A for everolimus, the average patient with optimal adherence can expect to have a PFS of 5.5 months, whereas it is 5.2 months for patients based on real-world adherence, a difference of 0.3 months (10 days) or a 5% decline (P<0.001). For axitinib, the average patient with optimal adherence can expect to have a PFS of 8.4 months, whereas it is 6.0 months for patients based on real-world adherence, a difference of 2.4 months (73 days) or a 29% decline (P<0.001).
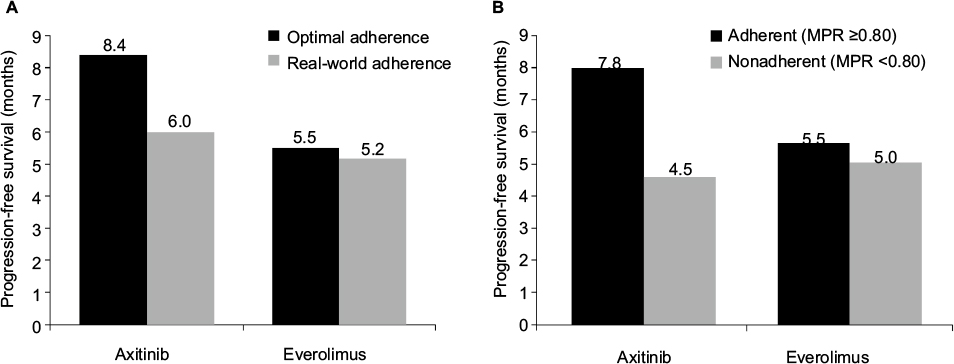 | Figure 2 Progression-free survival with optimal and real-world adherence (A) and in adherent and nonadherent patients (B) treated with axitinib and everolimus. Abbreviation: MPR, medication possession ratio. |
This decrease in real-world PFS was driven by a differences in PFS between adherent and nonadherent patients (Figure 2B). For everolimus, adherent patients (MPR≥0.80) could expect a PFS of 5.5 months, whereas it is 5.0 months for nonadherent patients (MPR<0.80), a difference of 0.5 months (16 days) or a 9% decline (P<0.001). For axitinib, adherent patients had an expected PFS of 7.8 months, whereas it is 4.5 months for nonadherent patients. This difference represents a decrease of 3.3 months (101 days) or a 42% (P<0.001) decrease in PFS between nonadherent versus adherent patients.
Discussion
In our simulation model, patient nonadherence was associated with decreased real-world PFS compared with clinical trial PFS. Our modeling closely resembled published studies for PK exposure outcomes.20,24 Patient nonadherence decreased levels of drug exposure as measured by the blood concentration of the drug. As a direct result of adherence-related decreases in drug exposure, PFS decreased by 29% for patients with RCC taking axitinib and by 5% for patients with RCC taking everolimus.
These findings indicate that physicians selecting treatments for patients with RCC should consider how real-world effectiveness differs from efficacy measured in clinical trials, in part because of patient nonadherence. One key component affecting adherence is probably whether a treatment is administered orally or through an infusion at physicians’ offices. One review study25 of adherence to oral anticancer medications found that 1 in 5 patients was nonadherent to oral RCC treatments; similar findings have been identified in other cancers.26 Although most patients with RCC currently receive oral anticancer treatments, injectable drugs – for which adherence is typically higher27 – are available (e.g., nivolumab, temsirolimus). In addition to considerations of treatment efficacy, safety, and cost, physicians should also examine whether a treatment’s mode of administration is likely to affect real-world effectiveness due to patient nonadherence.
To our knowledge, this study is the first to measure the impact of patient nonadherence in second-line RCC treatments using a simulation model. Our finding that oral medications decrease real-world treatment effectiveness has been echoed by prior studies using similar methods for the treatment of other diseases. For instance, a previous report estimated the impact of adherence on renal transplant patients and found that patients who frequently missed both required doses had a higher proportion of days below the target range of cyclosporine exposure.7 Nonadherence had a greater impact on exposure in renal transplant patients than in the treatment of patients with RCC in our study, as nonadherence to cyclosporine occurred more frequently than nonadherence to axitinib and everolimus in our study.
There were several limitations to our study. First, we were unable to identify adherence estimates specific to axitinib or everolimus. Instead, we assumed the same adherence between both treatments, based on claims data for adult patients, which may overestimate actual adherence using prescription fills instead of doses taken or underestimate actual adherence if patients self-pay for medication. Second, we are not able to identify the source of nonadherence, which could be related to patient preference, forgetfulness, or dose delays due to toxicity. Third, these results should not be extrapolated to other tumor types or diseases. The relationship between adherence and exposure, and between exposure and outcomes, can vary by tumor and disease type. Fourth, to model survival, we used AUC for axitinib and Cmin for everolimus, due to the availability of existing models in the literature. However, AUC may be a more sensitive exposure measure to changes in adherence compared with Cmin. Specifically, while there is a direct correlation between PFS and AUC for axitinib in the literature, for everolimus previously published research only captured Cmin bands, where small decreases in adherence and exposure may not change modeled PFS if an exposure–efficacy band was not crossed. We also considered modeling the effect of adherence on PFS for other RCC treatments, but we could not find literature measuring the relationship between exposure and PFS for other RCC agents. Fifth, our estimates of the relationship between medication exposure and PFS come from clinical trials. In this study, we assumed that this relationship would translate to the real world, but the external validity of this assumption is uncertain. Finally, our study evaluates the utility of different treatments based solely on PFS, but other factors matter to patients. For instance, we do not incorporate patient disutility from intravenous infusions, the cost to patients for clinic visits to receive intravenous infusions (e.g., costs of transportation, child care, time off from work), or the importance of other efficacy end points (e.g., overall survival rather than PFS). On the other hand, we do not capture potential clinical disadvantages from using oral medications due to less frequent clinical surveillance, as the patient does not need to visit medical facilities as frequently as in the case of using intravenous infusions.
Conclusion
This study found that patient nonadherence to oral anticancer medications decreases their real-world effectiveness as measured by PFS. When prescribing anticancer medication for patients with RCC, physicians should take into account a patient’s prior treatment adherence behavior and how this may impact real-world treatment effectiveness.
Acknowledgments
This research was sponsored by Bristol-Myers Squibb. The authors acknowledge Alison Silverstein and Taylor Watson for administrative and technical support. Professional editorial assistance was provided by Juan Sanchez-Cortes, PhD, of PPSI, funded by Bristol-Myers Squibb.
Disclosure
Jason Shafrin, Jeffrey Sullivan, Jacquelyn W Chou and J Ross Maclean are employees of Precision Health Economics, a consulting firm for the life sciences industry. Justin F Doan is an employee of and holds stock in Bristol-Myers Squibb. Michael N Neely reports no conflicts of interest related to this work.
References
National Cancer Institute. Common cancer types. Available from: https://www.cancer.gov/types/common-cancers. Accessed November 6, 2017. | ||
National Cancer Institute. Cancer stat facts: kidney and renal pelvis cancer. Available from: https://seer.cancer.gov/statfacts/html/kidrp.html. Accessed November, 6, 2017. | ||
American Cancer Society. What is kidney cancer? Available from: https://www.cancer.org/cancer/kidney-cancer/about/what-is-kidney-cancer.html. Accessed November 6, 2017. | ||
Chittoria N, Rini BI. Renal cell carcinoma. Available from: www.clevelandclinicmeded.com/medicalpubs/diseasemanagement/nephrology/renal-cell-carcinoma/. Accessed November 6, 2017. | ||
Minguet J, Smith KH, Bramlage CP, Bramlage P. Targeted therapies for treatment of renal cell carcinoma: recent advances and future perspectives. Cancer Chemother Pharmacol. 2015;76(2):219–233. | ||
Liu G, Franssen E, Fitch MI, Warner E. Patient preferences for oral versus intravenous palliative chemotherapy. J Clin Oncol. 1997;15(1):110–115. | ||
Maclean JR, Pfister M, Zhou Z, Roy A, Tuomari VA, Heifets M. Quantifying the impact of nonadherence patterns on exposure to oral immunosuppressants. Ther Clin Risk Manag. 2011;7:149–156. | ||
Byfield SA, McPheeters JT, Burton TM, Nagar SP, Hackshaw MD. Persistence and compliance among US patients receiving pazopanib or sunitinib as first-line therapy for advanced renal cell carcinoma: a retrospective claims analysis. J Manag Care Spec Pharm. 2015;21(6):515–522. | ||
Margolis J, Princic N, Doan J, Lenhart G, Motzer R. Analysis of real world treatment compliance in a cohort of 2,395 patients with metastatic renal cell carcinoma (mRCC). ASCO. Annu Meet Proc. 2015;33(15 Suppl):4546. | ||
de Figueiredo Junior AG, Forones NM. Study on adherence to capecitabine among patients with colorectal cancer and metastatic breast cancer. Arq Gastroenterol. 2014;51(3):186–191. | ||
Partridge AH, Archer L, Kornblith AB, et al. Adherence and persistence with oral adjuvant chemotherapy in older women with early-stage breast cancer in CALGB 49907: adherence companion study 60104. J Clin Oncol. 2010;28(14):2418–2422. | ||
Waterhouse DM, Calzone KA, Mele C, Brenner DE. Adherence to oral tamoxifen: a comparison of patient self-report, pill counts, and microelectronic monitoring. J Clin Oncol. 1993;11(6):1189–1197. | ||
Levine AM, Richardson JL, Marks G, et al. Compliance with oral drug therapy in patients with hematologic malignancy. J Clin Oncol. 1987;5(9):1469–1476. | ||
Partridge AH, Avorn J, Wang PS, Winer EP. Adherence to therapy with oral antineoplastic agents. J Natl Cancer Inst. 2002;94(9):652–661. | ||
Sun M, Larcher A, Karakiewicz PI. Optimal first-line and second-line treatments for metastatic renal cell carcinoma: current evidence. Int J Nephrol Renovasc Dis. 2014;7:401–407. | ||
Afinitor (everolimus) [prescribing information]. East Hanover, NJ: Novartis Pharmaceuticals Corporation; 2010. | ||
Inlyta (axitinib) tablets [prescribing information]. New York, NY: Pfizer Inc; 2012. | ||
Moes DJ, Press RR, den Hartigh J, van der Straaten T, de Fijter JW, Guchelaar HJ. Population pharmacokinetics and pharmacogenetics of everolimus in renal transplant patients. Clin Pharmacokinet. 2012;51(7):467–480. | ||
Neely MN, van Guilder MG, Yamada WM, Schumitzky A, Jelliffe RW. Accurate detection of outliers and subpopulations with Pmetrics, a non-parametric and parametric pharmacometric modeling and simulation package for R. Ther Drug Monit. 2012;34(4):467–476. | ||
Rini BI, Melichar B, Ueda T, et al. Axitinib with or without dose titration for first-line metastatic renal-cell carcinoma: a randomised double-blind phase 2 trial. Lancet Oncol. 2013;14(12):1233–1242. | ||
Tortorici MA, Cohen EE, Pithavala YK, et al. Pharmacokinetics of single-agent axitinib across multiple solid tumor types. Cancer Chemother Pharmacol. 2014;74(6):1279–1289. | ||
Agency for Healthcare Research and Quality. Medical Expenditure Panel Survey (MEPS). Rockville, MD: U.S. Department of Health and Human Services; 2012. | ||
Garrett M, Poland B, Brennan M, Hee B, Pithavala YK, Amantea MA. Population pharmacokinetic analysis of axitinib in healthy volunteers. Br J Clin Pharmacol. 2014;77(3):480–492. | ||
Ravaud A, Urva SR, Grosch K, Cheung WK, Anak O, Sellami DB. Relationship between everolimus exposure and safety and efficacy: meta-analysis of clinical trials in oncology. Eur J Cancer. 2014;50(3):486–495. | ||
Geynisman DM, Wickersham KE. Adherence to targeted oral anticancer medications. Discov Med. 2013;15(83):231–241. | ||
Foulon V, Schöffski P, Wolter P. Patient adherence to oral anticancer drugs: an emerging issue in modern oncology. Acta Clin Belg. 2011;66(2):85–96. | ||
Danesi R, Boni JP, Ravaud A. Oral and intravenously administered mTOR inhibitors for metastatic renal cell carcinoma: pharmacokinetic considerations and clinical implications. Cancer Treat Rev. 2013;39(7):784–792. |
Supplementary materials
Methods
Body mass index calculations
Because the Medical Expenditures Panel Survey (MEPS) reports body mass index (BMI) instead of individual height and weight, some assumptions were required to obtain patient weight and ideal weight. To compute the patient weight for the axitinib analysis, average adult height was used (stratified into men and women) to convert the BMI into weight in kilograms. The resulting weight was constrained to be within the range observed in the trial (37–130 kg). To compute the ideal weight for the everolimus analysis, height was first approximated using the MEPS BMI and the mean total body weight as reported previously.1 Then, the ideal weight for men was computed according to the Devine formula and for women using the Robinson formula.2,3
Adherence rates for everolimus and axitinib
We conducted a literature review to identify adherence rates for axitinib and everolimus. PubMed, EBSCO, and Google Scholar research databases were queried using search strings built on key terms including the generic drug names, renal cell carcinoma, adherence, MEMSCaps, and other measurements of adherence. All studies measuring adherence in patients receiving treatment for renal cell carcinoma (RCC) were screened. The search yielded one RCC adherence study,4 in which patients with two or more doses/administrations of RCC treatment initiated therapy with sunitinib, sorafenib, pazopanib, axitinib, temsirolimus, or everolimus. This study used the medication possession ratio to estimate RCC patient adherence to everolimus across all lines of therapy at 76% through claims data. Real-world adherence rates were not available for axitinib, so the everolimus adherence rate was applied to axitinib, assuming similar patient populations and therefore adherence behaviors.
Incorporating real-world adherence
For the first component of real-world adherence, we estimated the inter-dose interval to allow for variability in the time of day the patient took the medication. We applied a normal distribution centered on the recommended time and calibrated the standard deviation to match an estimate from the literature that 55% of people took their medication within 2 hours of the scheduled time.5 Once the dosing schedule was simulated, we used a second simulation that randomly removed doses based on the adherence rate. For instance, if the adherence rate was 50%, then we assigned a random number to each scheduled dose and included the dose if the random number was <50% and included the dose if the random number was ≥50%.
Visual predictive check results
We conducted a visual predictive check to compare the results of our exposure model against previously published models. In addition, Table S1 displays key descriptive metrics from our exposure model as compared to the relevant published models.
Everolimus dose–exposure modeling
The everolimus dose–exposure model produced results that were similar but not identical to those found in the literature.
Figure S1A shows the reproduced and Figure S1B shows the original blood concentration of everolimus based on published results.1 The original mean and median area under the plasma concentration–time curves (AUCs) were 130 and 127 µg×h/L, and the reproduced were 138 and 131 µg×h/L, respectively. The published results had a sample size of 53 patients, while our simulated sample contained more than 20,000 observations (2164 RCC patients across 10 replications), so comparing the statistical distributions is not meaningful. The five curves displayed in the study results panel for Figure S1A captured different percentiles of drug exposure for the population. As expected, higher percentiles of exposure resulted in greater concentrations of AUC.
Axitinib dose–exposure modeling
As was the case with everolimus, the axitinib dose–exposure model reflects but is not identical to the exposure model in the literature. Figure S2A shows the reproduced and Figure S2B shows the original log concentration plots for axitinib based on the published model.6 The median (range) of the published results was substantially higher than that observed in our simulation: 375 ng×h/mL (32.8–1,728) versus 264 ng×h/mL (61.0–430), respectively. Only the median and range of AUC were available in the published model, so a statistical comparison of the two distributions was not feasible, but the match was not as good as with everolimus based on visual inspection and summary statistics. Similar to the everolimus figure, the five curves for the study results panel modeled different percentiles of drug exposure, with higher percentiles of exposure resulting in higher concentrations of AUC.
References
Moes DJA, Press RR, den Hartigh J, van der Straaten T, de Fijter JW, Guchelaar H-J. Population pharmacokinetics and pharmacogenetics of everolimus in renal transplant patients. Clin Pharmacokinet. 2012;51(7):467–480. | ||
Robinson J, Lupkiewicz S, Palenik L, Lopez L, Ariet M. Determination of ideal body weight for drug dosage calculations. Am J Health Syst Pharm. 1983;40(6):1016–1019. | ||
Devine BJ. Gentamicin therapy. Drug Intell Clin Pharm. 1974;8(11):650–655. | ||
Margolis J, Princic N, Doan J, Lenhart G, Motzer R. Analysis of real world treatment compliance in a cohort of 2,395 patients with metastatic renal cell carcinoma (mRCC). ASCO Annu Meet Proc. 2015;33(15 Suppl):4546. | ||
Thivat E, Van Praagh I, Belliere A, et al. Adherence with oral oncologic treatment in cancer patients: interest of an adherence score of all dosing errors. Oncology. 2013;84(2):67–74. | ||
Rini BI, Melichar B, Ueda T, et al. Axitinib with or without dose titration for first-line metastatic renal-cell carcinoma: a randomised double-blind phase 2 trial. Lancet Oncol. 2013;14(12):1233–1242. |
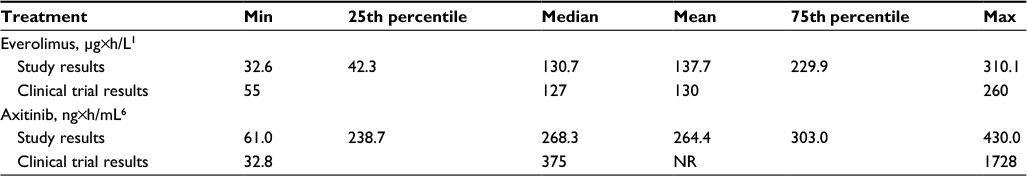 | Table S1 Exposure results summary Abbreviations: Max, maximum; Min, minimum; NR, not reported. |
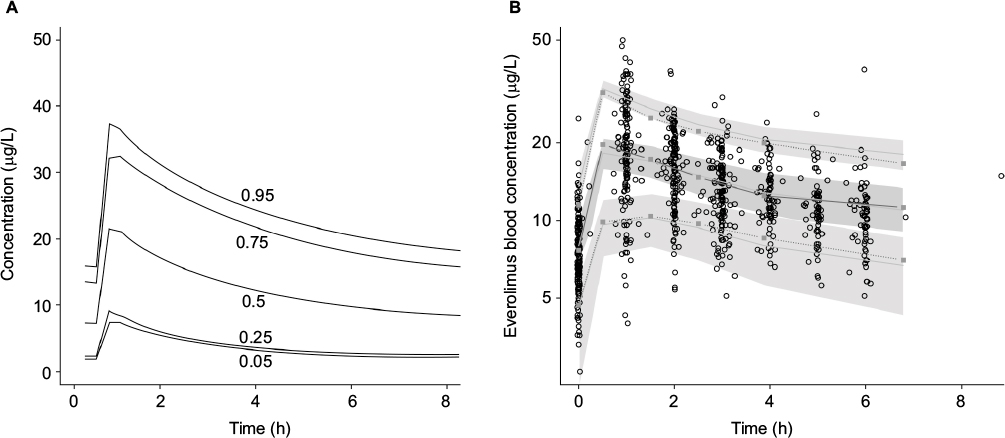 | Figure S1 Everolimus dose–exposure study results (A) compared with clinical trial results (B). Note: Clin Pharmacokinet. Population pharmacokinetics and pharmacogenetics of everolimus in renal transplant patients. 51 (7), 2012, 467–480. Moes DJA, Press RR, den Hartigh J, van der Straaten T, de Fijter JW, Guchelaar H-J, (© Springer International Publishing AG 2012) with permission of Springer.1 |
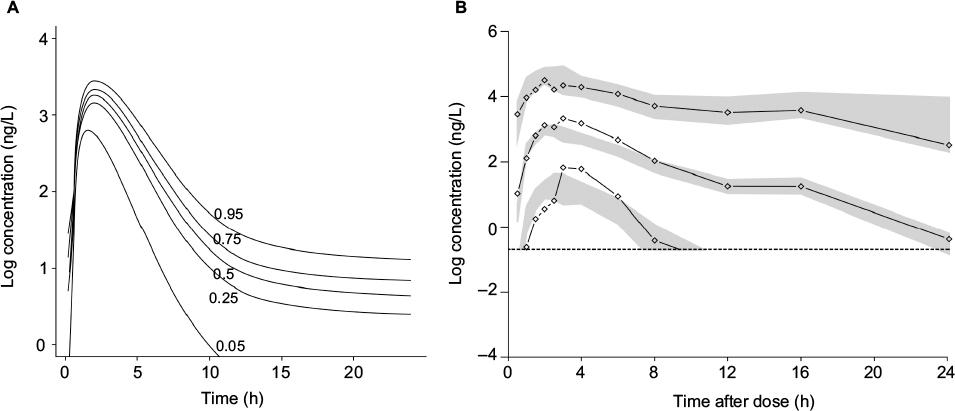 | Figure S2 Axitinib dose–exposure study results (A) compared with clinical trial results (B). Note: Reprinted from Lancet Oncol, Vol 14(12), Rini BI, Melichar B, Ueda T, et al. Axitinib with or without dose titration for first-line metastatic renal-cell carcinoma: a randomised double-blind phase 2 trial. 1233–1242, Copyright (2013), with permission from Elsevier.6 |
 © 2017 The Author(s). This work is published and licensed by Dove Medical Press Limited. The
full terms of this license are available at https://www.dovepress.com/terms
and incorporate the Creative Commons Attribution
- Non Commercial (unported, 3.0) License.
By accessing the work you hereby accept the Terms. Non-commercial uses of the work are permitted
without any further permission from Dove Medical Press Limited, provided the work is properly
attributed. For permission for commercial use of this work, please see paragraphs 4.2 and 5 of our Terms.
© 2017 The Author(s). This work is published and licensed by Dove Medical Press Limited. The
full terms of this license are available at https://www.dovepress.com/terms
and incorporate the Creative Commons Attribution
- Non Commercial (unported, 3.0) License.
By accessing the work you hereby accept the Terms. Non-commercial uses of the work are permitted
without any further permission from Dove Medical Press Limited, provided the work is properly
attributed. For permission for commercial use of this work, please see paragraphs 4.2 and 5 of our Terms.