
Back to Journals » Clinical, Cosmetic and Investigational Dentistry » Volume 17
The Effect of Chewing Simulation on Flexural Strength of Different Lithium Disilicate Ceramics
Authors Alsulimani O, Yousief SA  , Al-Dabbagh RA, Attar EA, Bukhary DM , Algamaiah H, Musawa K, Subahi A, Abuzinadah SH , Alhaddad AJ , Alqahtani WMS, Emam ANM, Alqhtani MA, Elmarakby AM
Received 3 November 2024
Accepted for publication 15 January 2025
Published 28 January 2025 Volume 2025:17 Pages 67—76
DOI https://doi.org/10.2147/CCIDE.S504292
Checked for plagiarism Yes
Review by Single anonymous peer review
Peer reviewer comments 2
Editor who approved publication: Professor Christopher E. Okunseri
Osamah Alsulimani,1 Salah A Yousief,2,3 Raghad A Al-Dabbagh,4 Esraa A Attar,4 Dalea M Bukhary,4 Hamad Algamaiah,5 Khadija Musawa,6 Awatif Subahi,6 Samar H Abuzinadah,7 Abdulrahman J Alhaddad,4 Waleed MS Alqahtani,8 Abdel Naser M Emam,9 Mohammad A Alqhtani,9 Ahmed M Elmarakby2,10
1Department of Oral Diagnostic Sciences, Faculty of Dentistry, King Abdulaziz University, Jeddah, Saudi Arabia; 2Department of Restorative and Prosthetic Dental Sciences, College of Dentistry, Dar Al Uloom University, Riyadh, 13313, Saudi Arabia; 3Department of Crown and Bridge, Faculty of Dental Medicine, Al-Azhar University, Assuit, Egypt; 4Department of Oral and Maxillofacial Prosthodontics, Faculty of Dentistry, King Abdulaziz University, Jeddah, Saudi Arabia; 5Department of Restorative Dental Science, King Saud University, College of Dentistry, Riyadh, Saudi Arabia; 6BDS, General Dentist, Faculty of Dentistry, King Abdulaziz University, Jeddah, Saudi Arabia; 7Department of Restorative Dentistry, Faculty of Dentistry, King Abdulaziz University, Jeddah, Saudi Arabia; 8Department of Prosthetic Dentistry, College of Dentistry, King Khalid University, Abha, Saudi Arabia; 9Department of Prosthetic Dental Science, Faculty of Dentistry, Najran University, Najran, Saudi Arabia; 10Department of Operative Dentistry, Faculty of Dental Medicine, Al-Azhar University, Assuit, Egypt
Correspondence: Salah A Yousief, Department of Restorative and Prosthetic Dental Sciences, College of Dentistry, Dar Al Uloom University, Riyadh, 13313, Saudi Arabia, Tel +966598045800, Email [email protected]
Background: Improved Lithium Disilicate Ceramic has been highly valued in dentistry for over two decades, owing to its durability and aesthetic qualities, making it a preferred choice for both anterior and posterior crowns.
Objective: This study aimed to evaluate the flexural strength of two types of lithium disilicate blocks post-chewing simulation.
Materials and Methods: Seventy-six lithium disilicate specimens were utilized in this study. They were divided into two primary groups (n=38) based on two brands: IPS Emax CAD LT (Ivoclar Vivadent) designated as (E), and Initial Lisi LT/B1 (GC America) designated as (L). Each primary group was further split into two subgroups (n=19) based on surface treatment: group E into (E0 & E1) and group L into (L0 & L1). Half of the specimens were subjected to flexural testing without chewing simulation cycles and designated as (E0 and L0), while the remainder were tested after 24× 104 cycles of chewing simulation and designated as (E1 and L1). The ceramic surfaces were examined using SEM before and after loading.
Statistical Analysis: Data were gathered, organized, and subjected to Shapiro–Wilk’s and Levene’s tests (p-value < 0.05), followed by analysis with Brown-Forsythe two-way ANOVA and Tamhane’s post hoc tests to assess group differences (p-value < 0.05).
Results: There were significant statistical differences in the flexural strength values between the different brand groups before and after chewing simulation (p-value < 0.05). The IPS Emax CAD group showed values approximately twice that of the Initial Lisi group (307.2– 310.5 MPa ± 48.5– 67 vs 148.1– 158.5 MPa ± 24.6– 25.6).
Conclusion: Within the limitation of the current study, the following may be concluded: 1. The study’s findings suggest that Initial Lisi blocks should not be used for posterior teeth restorations. 2. This study can provide valuable insights for dental professionals to make informed decisions about which material is most appropriate for various clinical situations.
Keywords: lithium disilicate, flexural strength, ceramics, mastication
Introduction
Currently, there has been an increased interest in enhancing dental esthetics and addressing metal allergies. As a result, metal-free, all-ceramic restorations have gained popularity for their ability to mimic the color, shine, and natural translucency of teeth. The production process for these restorations involves various ceramic materials and techniques, with lithium disilicate glass-ceramic material being a frequently employed option.1 Lithium disilicate glass-ceramic (LDG) has many applications, including thin veneers, inlays, onlays, crowns, fixed dental prostheses in the anterior and premolar region, and implant superstructures. LDG ceramics have favorable mechanical properties, chemical resistance, biocompatibility, diminished plaque accumulation, accuracy of fit, and esthetics. These properties are attributed to the unique structure of LDG ceramics of a glass matrix (for optimal esthetics) and 70% in volume of elongated and interlocked crystals (for superior mechanical resistance).2,3 Lithium disilicate ceramic has a flexural strength of 440 MPa;4 while it has great biomechanical properties, making it suitable for monolithic inlays in the posterior teeth, glass ceramics are frequently recommended for cosmetic restorations in the anterior region. For instance, using lithium disilicate allows for a more conservative repair that satisfies posterior loading requirements.1 Restorations made from lithium disilicate can be created using computer-aided design (CAD) and computer-aided manufacturing (CAM) or heat-pressing. The CAD/CAM method creates the model in partially crystallized blocks that need post-milling crystallization. Meanwhile, heat-pressing uses fully crystallized ingots that become pressable and viscous when heated and pressured, forming the required restoration. The crystals’ size, composition, and shape are determined during crystallization.5–9 Oxides could be applied in various ratios to control the restorations’ ultimate color and translucency.10,11 Recent developments in CAD/CAM milling have enabled the production of restorations with high precision and shorter processing times.12 Along with those benefits, it also improved the mechanical qualities of ceramic restorations since there were fewer inherent flaws, which decreased the likelihood of failures when exposed to tensile stresses.12,13
Ceramic restorations can break down over time in the moist oral environment due to saliva and mastication forces, especially when there are high thermal and mechanical stresses. Repeated tensile loads may cause a radial fracture, especially when there are flaws at the core-cement interface. These imperfections can cause subcritical crack growth, ultimately exceeding the material’s fracture toughness.2 Studies show that these defects may lead to bulk fractures in crowns and bi-layered samples, as they initiate the core material’s cracking. While ceramic materials are a popular choice for dental applications because of their biocompatibility and esthetic appeal, there is a cause for concern regarding the contact fatigue damage they may experience, impacting their expected lifespan. To evaluate the mechanical performance of ceramic materials, cyclic fatigue tests under intermittent loads are used to determine their fatigue strength and the effects of other relevant elements. These tests simulate the clinical settings in which restorative materials are used.14
IPS E.max CAD has been a highly regarded dental material for over two decades due to its proven strength and esthetic properties, making it a popular choice for anterior and posterior crowns. However, its use in bridges remains limited, and its efficacy in this context is still not fully understood. More recently, Initial LiSi has emerged as a new version of this material. They both have lithium disilicate crystals in glassy matrix with almost the same composition elements but with different percentages, and GC initial LiSi differs in containing Na2O while IPS E. max contains ZnO and MgO.15 While IPS E.max CAD has been widely used and researched, Initial LiSi has been gaining traction as a promising alternative but there is scant information available on its mechanical and clinical behavior, and no direct comparison has been made between these two materials.
Both IPS E.max CAD and Initial LiSi claim to have exceptional mechanical performance, which prompted the authors to conduct a study comparing their flexural strength. In order to establish control, IPS E.max CAD was chosen due to its well-established reputation in the literature. Therefore, the objectives of this study was to investigate the flexural strength of two types of lithium disilicate blocks after chewing simulation in order to give valuable insights for dental professionals to make informed decisions about which material is most appropriate for various clinical situations. The null hypotheses were first; there would be no significant difference in the flexural strength between the two brands before and after chewing simulation. Second; there would be no significant difference in the flexural strength of the same brand before and after chewing simulation.
Materials and Methods
Materials
For the purposes of this study, two types of lithium disilicate blocks were selected: IPS e.max CAD LT/B1 C14 (Ivoclar, Schaan, Liechtenstein) and Initial LiSi LT/B1 (GC America, Alsip, Illinois, USA). The mechanical properties of these blocks, as provided by the respective manufacturers, are listed in Table 1.
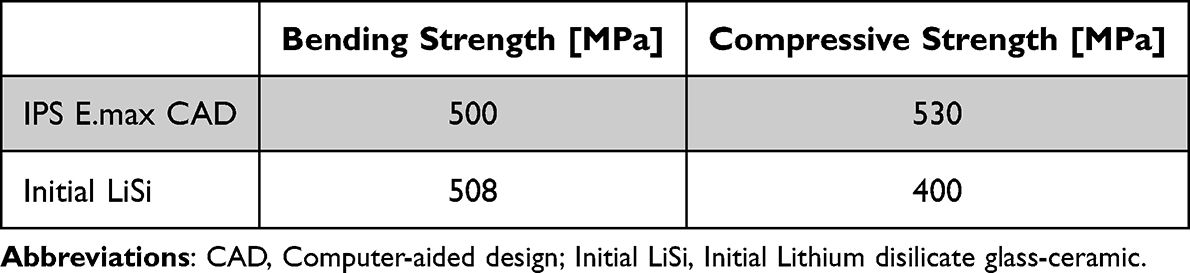 |
Table 1 Materials’ Mechanical Properties |
Specimen Preparation
Autodesk Meshmixer version 3.5.474 (Autodesk, San Francisco, California, USA) was utilized to design a bar measuring 10x4x2 mm, which was subsequently milled into 8 bars from each ceramic block (Ceramill Motion 2, Amann Girrbach AG, Koblach, Austria). The calculated sample size was seventy six with 82% power. Thirty-eight IPS E.max CAD and thirty-eight Initial LiSi bars were produced. The IPS E.max CAD bars underwent a post-sintering process (Programat P510, Ivoclar, Schaan, Liechtenstein), while the Initial LiSi bars were fully sintered upon delivery. Fully Sintering is the process of firing the compacted ceramic powder at high temperature to ensure optimal densification. This occurs by pore elimination and viscous flow when the firing temperature is reached. Sintering is the most common fabrication technique for ceramic veneers. After sintering, it is possible to improve the properties of porcelain components using various methods which include heat treatment. The treatment applied to the sintered components will depend on the application. Post-sintering processes include assembling of parts, heat treatment, densification and finishing.
The specimens were then finished and polished using 800 grit silicon carbide paper before being stored in a dry area. The specimens have been randomly distributed into two main groups, with the representation of E.max groups designated by the letter E and the LiSi group by the letter L. Each main group were further subdivided into two subgroups as following: samples that have not undergone simulated chewing are denoted as 0, while those that have undergone chewing simulation are denoted as 1. The final four subgroups (n=19) were as follows: E0 represents IPS E.max bars before the chewing simulation, E1 represents IPS E.max bars after the simulation, L0 represents Initial LiSi bars before the chewing simulation, and L1 represents Initial LiSi bars after the simulation.
Flexural Strength Testing
Specimens were subjected to a 3-point flexural strength test at 25°C room temperature and 50% room humidity using a Universal Testing Machine (INSTRON 5944, Norwood, MA, USA). The machine was set up with a 2 kN loading cell, 1-mm/min loading arm speed (ISO 6872), and 8-mm holding arm distance. Following the testing, flexural strength values were determined utilizing the subsequent equation:

The formulas for calculating the breaking load of a specimen in a test:
(P) is the breaking load in newtons (N),
(l) is the test span in millimeters (mm),
(w) is the width of the specimen in mm, and
(b) is the thickness of the specimen in mm.
Chewing Simulation
Cyclic loading was undertaken for E1 and L1 subgroups using a chewing simulator (CS-4.2, SD Mechatronik GmbH, Feldkirchen-Westerham, Germany) (Figure 1).This machine simulates the patient bite force capacity where maximum bite force is a basic parameter related to the functional state of the masticatory system. This is the maximum force which a human can reach while clenching their teeth, without the occurrence of pain in the periodontal tissues. The chewing simulator machine was formed of three main components: the antagonist (6-mm strain steel head), the specimen cup, and the specimen chamber (Figure 2).
 |
Figure 1 The chewing simulator. |
 |
Figure 2 Specimen mounted over the acrylic slab. |
To simulate a clinical setting, condensation silicone was used to fill the specimen cups and create a mold that imitated the periodontal ligament’s cushioning effect. Additionally, 3D-printed rectangular acrylic slabs, which were 2-mm thick, were used to replicate the dentin substructure. These slabs were inserted into the silicone before it was set to create a mold that could hold the tested specimens. After 24-hours, the acrylic pieces were removed, leaving a negative imprint to hold the specimens.
To assemble the specimens, all 38 acrylic slabs were surface-treated by air abrading (50µ Al2O₃ at 1 bar for 10-seconds). Each tested specimen was then mounted in the center of a slab and bonded with self-adhesive cement (RelyX U200, 3M, Bayern, Germany). After 24-hours post-irradiation, the specimens were transferred to their negative imprints in the mold cups and then to the chewing simulator chamber (Figure 2).
The chewing simulator equipment had eight chambers with a stainless-steel antagonist head. The simulator was set to 24×104 cycles with the following parameters: vertical volume of Z 2.0-mm, lateral movement of X 0.7-mm, vertical speed of 55-mm/s, lateral speed of 30-mm/s, a frequency of 1.8 hz, and an 8 kg loading weight transferring a ~78 N. The opposing arm’s extension was fitted with weights. Each set took around two seconds, and all chambers were filled with 37°C distilled water during the test. The 24×104 cycles took around 24 hours per set (8 specimens) until all specimens completed the chewing simulation phase.
After the chewing simulation, the specimens were removed from the acrylic slabs in order to prepare them for SEM imaging and post-flexural testing.
Scanning Electron Microscopy (SEM)
Following cyclic loading, a single sample of subgroups E1 and L1 were positioned on carbon tabs and mounted onto aluminum stubs. To prevent charging, silver paint was applied around the specimens after Au/Pd coating. The specimens were then cleaned with air pressure and scanned using SEM with scanning electrons (SE) at 5 eV (SERON, Gyeonggi-do, Korea). The SEM scans were conducted at varying magnifications.
Statistical Analysis
Sample size calculation was done using G* power 3.1.9 software. The polygon graphs indicated a normal distribution of outcomes across all experimental subgroups with only a slight skew (Figure 3). The data was also found to be normally distributed, albeit with unequal variances, as evidenced by Shapiro–Wilk’s test results being greater than 0.05 and Levene’s test results being less than 0.05. To assess the differences, the Brown-Forsythe one way ANOVA and Tamhane’s post hoc tests were employed. Moreover, the range of values spread across subgroups and any outliers were identified using box and whisker plots (Figure 4). The statistical analysis was conducted using IBM SPSS version 22. (SPSS Inc., Chicago, IL, USA).
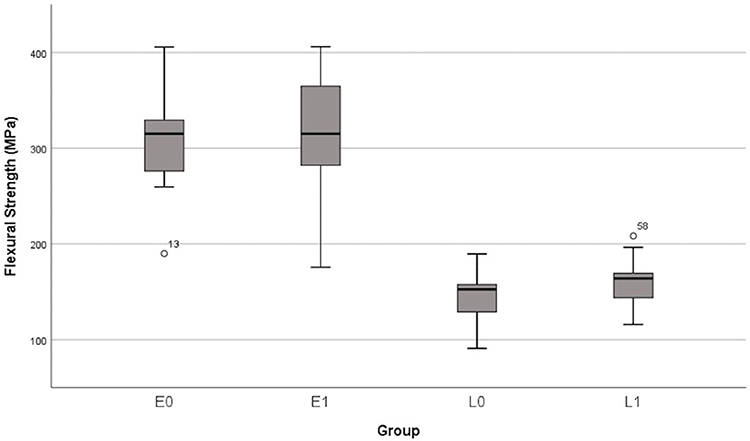 |
Figure 3 The frequency histogram polygon graphs display the distribution of flexural strength across all groups. |
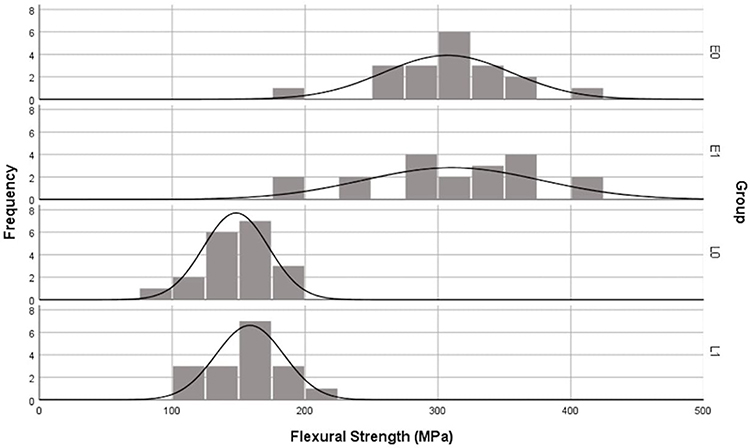 |
Figure 4 The flexural strength data is presented through box and whisker plots, which display the range of values and any outliers. |
Results
Flexural Strength
Two specimens of subgroup L1 were lost after chewing simulation. All values lie within the 95% confidence interval. E1 showed the highest mean (310.5 MPa) while L0 showed the lowest mean (148.1 MPa). The spread of values in the E groups was double that in the L groups. The values were not noticeably affected by the chewing cycles. E groups showed roughly double the values of the L groups (Table 2). One outlier was spotted in subgroups E0 and L1 (Figure 4).
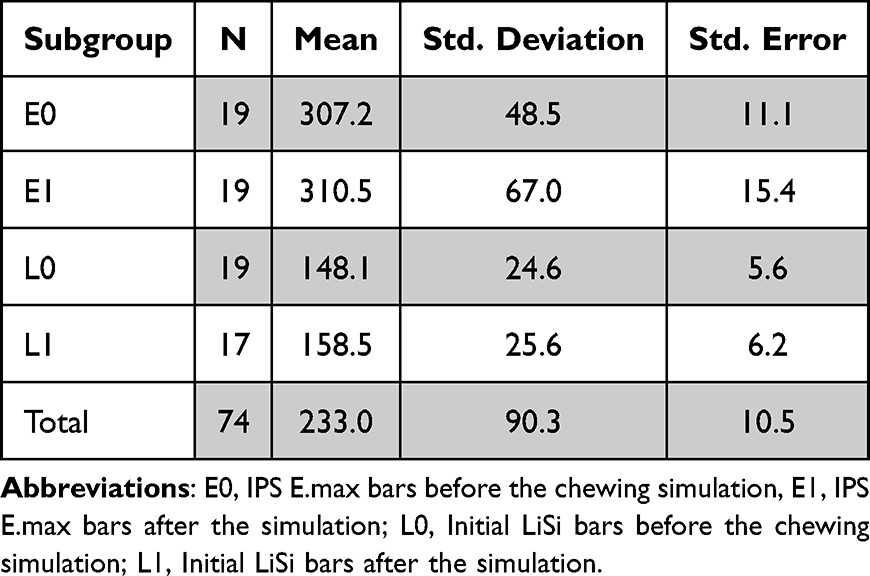 |
Table 2 Descriptive Statistics |
Upon analyzing dependent groups, no significant differences were observed. It was shown that simulated chewing at 24×104 cycles had no significant impact on the means or spread of values in the dependent groups (p-value >0.05) (Tables 2 and 3). The intragroup values for IPS E.max CAD were found to be noticeably variable (48.5–67.00) in comparison to Initial LiSi (24.6–25.6) (Table 2 and Figure 4).
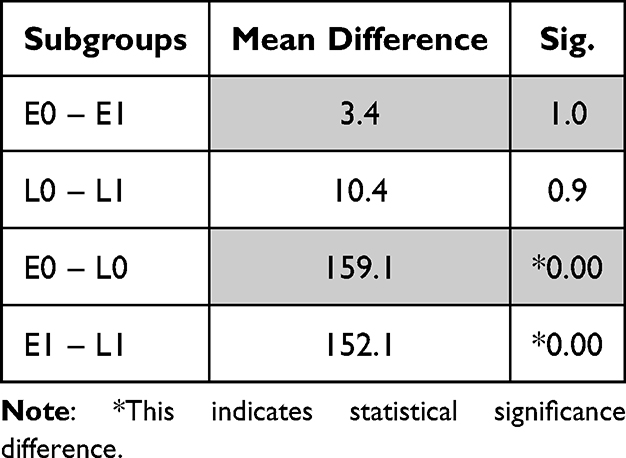 |
Table 3 Comparison of the Means |
SEM Imaging
Upon examination through SEM imaging, it was observed that subgroup E1 exhibited superior characteristics in comparison to subgroup L1. Specifically, subgroup E1 displayed less destruction, smaller debris size, and a smoother surface. Notably, at the impact site, subgroup L1 possessed a wider and more pronounced rim, while numerous particle debris was clearly visible at the impact site. Moreover, away from the impact site, subgroup E1 demonstrated a smoother surface, as can be seen in (Figures 5–7).
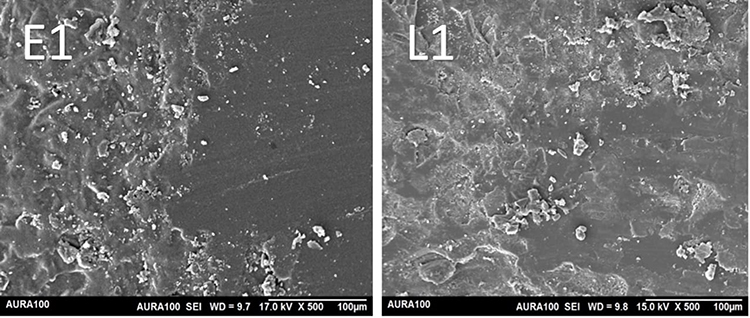 |
Figure 5 SEM imaging at 500x magnification at the site of impact. Note that the destruction is more progressive in L1 compared to E1. Abbreviations: SEM, Scanning Electron Microscopy; L1, Initial LiSi bars after the simulation; E1, IPS E.max bars after the simulation. |
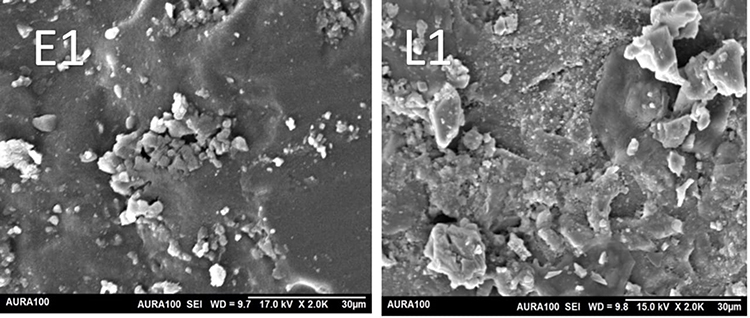 |
Figure 6 SEM imaging at 2000x magnification around the point of impact. Note that the ceramic debris is larger in L1 compared to E1. Abbreviations: SEM, Scanning Electron Microscopy; L1, Initial LiSi bars after the simulation; E1, IPS E.max bars after the simulation. |
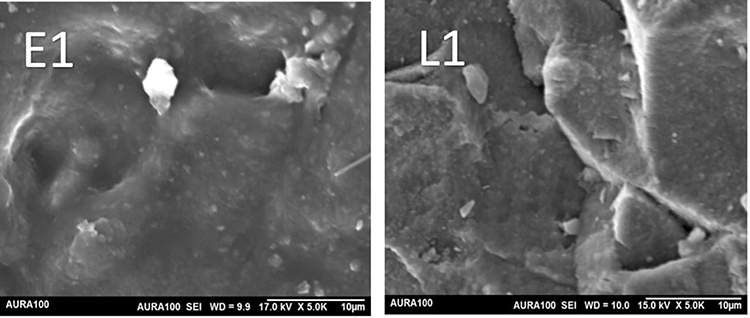 |
Figure 7 SEM imaging at 5000x magnification at a point away from impact. Note smoother E1 surface compared to L1. Abbreviations: SEM, Scanning Electron Microscopy; L1, Initial LiSi bars after the simulation; E1, IPS E.max bars after the simulation. |
Discussion
The results of this study indicate that the first null hypothesis was not supported, suggesting a significant difference between the materials tested. Specifically, IPS E.max CAD displayed the highest pre- and post-simulation means. However, it was found that the second null hypothesis was supported, as the chewing simulation did not have a significant impact on the dependent subgroups. In other words, there was no notable difference in the means of both materials prior to and following the simulation, as evidenced by Tables 2 and 3.
In Table 2, it can be observed that the IPS E.max CAD specimens exhibited a consistently high level of pre-and post-loading values, registering at 307.2 and 310.5 MPa, respectively. The Initial LiSi values remained nearly constant before and after loading, albeit significantly lower than the control groups. The IPS E.max CAD intragroup values displayed some variability, ranging from 48.5–67.00 SD, as opposed to the Initial LiSi, which ranged from 24.6–25.6 SD. This variability could be attributed to potential manufacturing flaws in the block. This could be explained by a study of Yamamoto. et al they indicated that IPS E.max CAD necessitates heat treatment at high temperatures for crystallization after fabrication, which could lead to deformation in dimensions during the process of lithium metasilicate turning into lithium di-silicate. However, Initial LiSi does not require crystallization or glaze firing processes and can achieve precise results via CAD/CAM machines with good grinding properties.16
It is noteworthy to observe that both materials were able to retain their flexural strength even after being subjected to 240,000 chewing cycles, which is equivalent to one year in the oral cavity.17 However, there was a slight increase in the spread of values for IPS E.max CAD post-simulation, which may suggest a lack of consistency in that material within the context of the study.
Based on ISO 6872,18 dental ceramic materials must meet certain minimum strength requirements to be used in bonded crowns, luted crowns, and 3-unit bonded bridges (excluding molars). Specifically, the required strength for bonded crowns is 100 MPa, while luted crowns and bridges require 300 MPa. In this study, IPS E.max CAD met the strength requirements for both bonded and luted crown applications, regardless of the tooth type. However, Initial LiSi only showed sufficient strength for bonded crown application on anterior teeth. If a 3-unit glass-ceramic bridge is desired, IPS E.max CAD can be used with caution and only in specific circumstances. Nonetheless, Initial LiSi exhibited a behavior below the minimum standard for bridge applications. On the other hand, Zumstein et al in their study tested the fatigue resistance of 0.5 mm occlusal veneers on molars made from different ceramic materials, including pressable IPS E.max CAD and Initial LiSi. After 1.2 million chewing cycles at 49 N, they discovered that Initial LiSi had statistically insignificant higher resistance to fatigue. Both materials were suitable for posterior applications.19 Another study tested ultrathin occlusal veneers of 0.3/0.5-mm made from IPS E.max CAD and other materials, reporting remarkably high fracture strength under cyclic mechanical loading of 1 million cycles at 100 N.20 Such differences in the results of previous studies may be due to differences in composition of tested materials, methodology and techniques.
Upon analysis of the scanning electron microscope images, it has been observed that IPS E.max CAD demonstrates a superior response to loading in contrast to Initial LiSi. Notably, it exhibits minimal damage, debris effect, and maintains a smooth surface before and after loading. Such findings suggest that IPS E.max CAD exhibits exceptional surface characteristics and structural stability during its functional use.
When making a decision on what type of lithium disilicate to use for patients, it is very useful for clinicians to take into consideration the information obtained from this study. IPS E.max CAD, due to its higher flexural strength under loading, may prove to be a better option for posterior restorations. However, Initial LiSi values were found to be inadequate for posterior teeth restorations. The superior flexural strength of IPS E.max CAD was reported in some recent studies. Freitas et al reported that tested IPS E.max CAD has better flexural fatigue strength than the advanced lithium disilicate CEREC Tessera (Dentsply Sirona, Charlotte, NC, USA) but both have similar hardness values.21 Consistently, a recent narrative review of Munoz et al concluded superior flexural strength of IPS E.max CAD as compared to three other lithium disilicate materials namely; Celtra DUO (Dentsply Sirona, Charlotte, NC, USA), Suprinity (VITA Zahnfabrik, Bad Sackingen, Germany), and n!ce (Straumann, Basel, Switzerland). This difference in materials strength was attributed to the differences in composition of the lithium disilicate glass ceramics.22 Further studies are required to verify the in vitro outcomes in a clinical setting. Lastly, it is essential to note that this study only simulated chewing forces on anterior teeth; thus, caution should be taken when interpreting the results.
Both materials possess unique advantages and limitations, yet they are extensively utilized in dental restorations owing to their superior esthetic and mechanical characteristics. Given the continuous evolution and progress of dental materials, it is imperative for researchers and clinicians to remain abreast of the latest advancements and endeavor to enhance the quality of dental care provided to patients.
It’s essential to consider some limitations of this study. While the in vitro results are promising, further studies conducted in vivo are necessary to confirm its clinical durability. Additionally, the machine’s weight capacity may limit the simulation of posterior teeth, but this can be improved with more advanced equipment. Lastly, it’s worth noting that the specimens used in the study were not bonded to teeth, which could affect the accuracy of the results.
For a more comprehensive understanding of the subject matter, it would be highly advantageous to conduct further research. This may involve investigating potential manufacturing defects, carrying out in-depth crystallography analysis, simulating posterior load scenarios, evaluating bonding capabilities to human teeth, testing alternative brands of lithium disilicate, and conducting rigorous clinical trials.
Conclusion
Within the limitations of this current study, it was concluded that:
- The flexural strength of IPS E.max CAD was significantly higher than Initial LiSi.
- IPS E.max CAD demonstrated a better response to load than Initial LiSi.
- The surface texture of IPS E.max CAD was superior both before and after loading when comparing to Initial LiSi.
- IPS E.max CAD values were more widely distributed than Initial LiSi.
- The study’s findings suggest that Initial Lisi blocks should not be used for posterior teeth restorations.
- This study can provide valuable insights for dental professionals to make informed decisions about which material is most appropriate for various clinical situations.
Abbreviations
LDG, Lithium disilicate glass-ceramic; CAD, Computer-aided design; CAM, Computer-aided manufacturing; LT, Low translucency; E0, IPS E.max bars before the chewing simulation; E1, IPS E.max bars after the simulation; L0, Initial LiSi bars before the chewing simulation; L1, Initial LiSi bars after the simulation; SEM, Scanning Electron Microscopy.
Acknowledgments
Special thanks to the Deanship of Scientific Research (DSR) and the Faculty of Dentistry at King Abdulaziz University, Jeddah.and to the Deanship of Postgraduate and Scientific Research at Dar Al Uloom University for thier support of this project.
Disclosure
The authors report no conflicts of interest in this work.
References
1. Shenoy A, Shenoy NJ. Dental ceramics: an update. J Conserv Dent. 2010;13(4):195. doi:10.4103/0972-0707.73379
2. Zhao K, Wei YR, Pan Y, Zhang XP, Swain MV, Guess PC. Influence of veneer and cyclic loading on failure behavior of lithium disilicate glass-ceramic molar crowns. Dent Mater. 2014;30(2):164–171. doi:10.1016/j.dental.2013.11.001
3. Velho HC, Dapieve KS, Pereira GK, Fraga S, Valandro LF, Venturini AB. Accelerated loading frequency does not influence the fatigue behavior of polymer infiltrated ceramic network or lithium disilicate glass-ceramic restorations. J Mech Behav Biomed Mater. 2020;110:103905. doi:10.1016/j.jmbbm.2020.103905
4. Kang SH, Chang J, Son HH. Flexural strength and microstructure of two lithium disilicate glass ceramics for CAD/CAM restoration in the dental clinic. Restor Dent Endod. 2013;38(3):134–140. doi:10.5395/rde.2013.38.3.134
5. Bischoff C, Eckert H, Apel E, Rheinberger VM, Höland W. Phase evolution in lithium disilicate glass–ceramics based on non-stoichiometric compositions of a multi-component system: structural studies by 29 Si single and double resonance solid state NMR. Phys Chem Chem Phys. 2011;13(10):4540–4551. doi:10.1039/c0cp01440k
6. Von Clausbruch SC, Schweiger M, Höland W, Rheinberger V. The effect of P2O5 on the crystallization and microstructure of glass-ceramics in the SiO2–Li2O–K2O–ZnO–P2O5 system. J Non-Crystalline Solids. 2000;263:388–394. doi:10.1016/S0022-3093(99)00647-X
7. Wen G, Zheng X, Song L. Effects of P2O5 and sintering temperature on microstructure and mechanical properties of lithium disilicate glass-ceramics. J Acta Materialia. 2007;55(10):3583–3591. doi:10.1016/j.actamat.2007.02.009
8. Anusavice KJ, Zhang NZ. Effect of crystallinity on strength and fracture toughness of Li2O‐Al2O3‐CaO‐SiO2 glass‐ceramics. J Am Ceramic Society. 1997;80(6):1353–1358. doi:10.1111/j.1151-2916.1997.tb02991.x
9. Hasselman D, Fulrath R. Proposed fracture theory of a dispersion‐strengthened glass matrix. J Am Ceramic Society. 1966;49(2):68–72. doi:10.1111/j.1151-2916.1966.tb13210.x
10. Anusavice KJ, Zhang NZ, Moorhead JE. Influence of P2O5, AgNO3, and FeCl3 on color and translucency of lithia-based glass-ceramics. Dent Mater. 1994;10(4):230–235. doi:10.1016/0109-5641(94)90066-3
11. Anusavice KJ, Zhang NZ, Moorhead JE. Influence of colorants on crystallization and mechanical properties of lithia-based glass-ceramics. Dent Mater. 1994;10(2):141–146. doi:10.1016/0109-5641(94)90055-8
12. Miyazaki T, Hotta Y, Kunii J, Kuriyama S, Tamaki Y. A review of dental CAD/CAM: current status and future perspectives from 20 years of experience. Dent Mater J. 2009;28(1):44–56. doi:10.4012/dmj.28.44
13. Sen N, Us YO. Mechanical and optical properties of monolithic CAD-CAM restorative materials. J Prosthet Dent. 2018;119(4):593–599. doi:10.1016/j.prosdent.2017.06.012
14. Prochnow C, Venturini AB, Guilardi LF, et al. Hydrofluoric acid concentrations: effect on the cyclic load-to-failure of machined lithium disilicate restorations. Dent Mater. 2018;34(9):e255–e63. doi:10.1016/j.dental.2018.06.028
15. Cagidiaco EF, Grandini S, Goracci C, Joda T. A pilot trial on lithium disilicate partial crowns using a novel prosthodontic functional index for teeth (FIT). BMC Oral Health. 2019;19(1):276. PMID: 31818278; PMCID: PMC6902521. doi:10.1186/s12903-019-0957-4
16. Yamamoto K, Hokii Y, Fusejima F. CAD/CAM fabricated prosthetic accuracies of lithium disilicate glass ceramic block. Dent Mater. 2022;38:e44–e5. doi:10.1016/j.dental.2021.12.104
17. Lutz F, Krejci I. Mesio-occlusodistal amalgam restorations: quantitative in vivo data up to 4 years. A data base for the development of amalgam substitutes. Quintessence Int. 1994;25(3).
18. Ch. BS EN ISO 6872:2015 - Dentistry. Ceramic materials 2015.
19. Zumstein K, Fiscalini L, Husain NAH, Evci E, Özcan M, Ioannidis A. Load-bearing capacity of pressable lithium disilicates applied as ultra-thin occlusal veneers on molars. J Mech Behav Biomed Mater. 2022;136:105520. doi:10.1016/j.jmbbm.2022.105520
20. Heck K, Paterno H, Lederer A, Litzenburger F, Hickel R, Kunzelmann K. Fatigue resistance of ultrathin CAD/CAM ceramic and nanoceramic composite occlusal veneers. Dent Mater. 2019;35(10):1370–1377. doi:10.1016/j.dental.2019.07.006
21. Freitas JS, Souza LFB, Pereira GKR, May LG. Surface properties and flexural fatigue strength of an advanced lithium disilicate. J Mech Behav Biomed Mater. 2023;147:106154. doi:10.1016/j.jmbbm.2023.106154
22. Munoz A, Zhao Z, Paolone G, Louca C, Vichi A. Flexural strength of CAD/CAM lithium-based silicate glass-ceramics: a narrative review. Materials. 2023;16(12):4398. doi:10.3390/ma16124398
 © 2025 The Author(s). This work is published and licensed by Dove Medical Press Limited. The
full terms of this license are available at https://www.dovepress.com/terms
and incorporate the Creative Commons Attribution
- Non Commercial (unported, 3.0) License.
By accessing the work you hereby accept the Terms. Non-commercial uses of the work are permitted
without any further permission from Dove Medical Press Limited, provided the work is properly
attributed. For permission for commercial use of this work, please see paragraphs 4.2 and 5 of our Terms.
© 2025 The Author(s). This work is published and licensed by Dove Medical Press Limited. The
full terms of this license are available at https://www.dovepress.com/terms
and incorporate the Creative Commons Attribution
- Non Commercial (unported, 3.0) License.
By accessing the work you hereby accept the Terms. Non-commercial uses of the work are permitted
without any further permission from Dove Medical Press Limited, provided the work is properly
attributed. For permission for commercial use of this work, please see paragraphs 4.2 and 5 of our Terms.