Back to Journals » Clinical Epidemiology » Volume 14
The Doctors’ Effect on Patients’ Physical Health Outcomes Beyond the Intervention: A Methodological Review
Authors Schnelle C ![]() , Jones MA
, Jones MA
Received 11 January 2022
Accepted for publication 22 June 2022
Published 18 July 2022 Volume 2022:14 Pages 851—870
DOI https://doi.org/10.2147/CLEP.S357927
Checked for plagiarism Yes
Review by Single anonymous peer review
Peer reviewer comments 3
Editor who approved publication: Professor Vera Ehrenstein
Video abstract presented by Christoph Schnelle.
Views: 73
Christoph Schnelle, Mark A Jones
Institute of Evidence-Based Healthcare, Bond University, Robina, QLD, 4226, Australia
Correspondence: Christoph Schnelle, Institute of Evidence-Based Healthcare, Bond University, 14 University Drive, Robina, QLD, 4226, Australia, Email [email protected]
Background: Previous research suggests that when a treatment is delivered, patients’ outcomes may vary systematically by medical practitioner.
Objective: To conduct a methodological review of studies reporting on the effect of doctors on patients’ physical health outcomes and to provide recommendations on how this effect could be measured and reported in a consistent and appropriate way.
Methods: The data source was 79 included studies and randomized controlled trials from a systematic review of doctors’ effects on patients’ physical health. We qualitatively assessed the studies and summarized how the doctors’ effect was measured and reported.
Results: The doctors’ effects on patients’ physical health outcomes were reported as fixed effects, identifying high and low outliers, or random effects, which estimate the variation in patient health outcomes due to the doctor after accounting for all available variables via the intra-class correlation coefficient. Multivariable multilevel regression is commonly used to adjust for patient risk, doctor experience and other demographics, and also to account for the clustering effect of hospitals in estimating both fixed and random effects.
Conclusion: This methodological review identified inconsistencies in how the doctor’s effect on patients’ physical health outcomes is measured and reported. For grading doctors from worst to best performances and estimating random effects, specific recommendations are given along with the specific data points to report.
Keywords: methodological study, meta-epidemiology, meta-epidemiological review, research methods, doctors’ effect
Introduction
A fundamental question in medical research is whether medical practitioners have an effect on patients’ health beyond the intervention, patient risk, and hospital variables. Previous research has revealed that when a treatment is delivered by a doctor (ie surgeon or medical physician), patient outcomes may vary systematically by medical practitioner.1,2 It is well known that hospitals can have an influence on patients’ health outcomes, with wide variation between hospitals.3–7 Such outcomes include adverse events,4 prescribing errors,4 hospital readmission,5,6 and mortality.7–9 Comparing hospitals requires a sound methodology and reliable estimates that take into account the multiple variables involved.8,10 In contrast to the substantial research on hospital effects, there is minimal research on the effect of doctors.
The influence of doctor-patient communication has been investigated as a “doctor effect” on patients’ health outcomes,1,11,12 including symptoms,13,14 readmission rates in the emergency department,13,15 health-related quality of life,16 and improved diabetes control.17
Research on the therapist effect in psychotherapy has shown significant effects of therapists on patient outcomes beyond the therapy technique or modality applied.18,19 This wide variation among practitioners has been acknowledged and incorporated into the training material for psychotherapists.20,21 In surgery, outcomes associated with procedure volume, seniority, level of experience, or doctor specialty, include mortality rate,22 length of hospital stay,23,24 postoperative complications,25 and readmission.26,27 While research on the doctors’ effect in non-surgical specialties is limited, there is evidence from studies in primary care,1,28 intensive care,29 acute care,30 and obstetrics,31 where medical practitioners had an effect on patients’ health outcomes.
Given the significant therapist effect in psychotherapy, and the known wide variation in patient outcomes across hospitals, but unclear effect of individual doctors on patient outcomes, we conducted a systematic review of the effect of doctors on patients’ physical outcomes. We aimed to assess whether doctor effects vary with specificity, outcome and intervention. However, in conducting the review, we found substantial variation in the way a doctor effect is measured and reported, therefore making data synthesis challenging and meta-analysis impossible. This has led to the present study where we have conducted a methodological review of studies that measure and report on doctors’ effect on physical patient outcomes. The focus of the methodological review is on the method of measurement of the doctors’ effect as well as how it is reported. The data source for the review is the included studies from our systematic review.32
Objective
To conduct a methodological review of studies reporting on the effect of doctors on patients’ physical health outcomes and to provide recommendations on how this effect could be measured and reported in a consistent and appropriate way.
Materials and Methods
Design
The present study is a methodological review where the focus is on statistical analysis and reporting.33 The search strategy, data collection, and extraction are explained in detail in a previous report of a systematic review of the surgeons’ effect on patients’ physical health outcomes.32
Search Strategy
Three databases were searched initially: PubMed, Embase, and PsycINFO; and over 10,000 publications were screened. For each of the studies identified that met the inclusion criteria, a citation analysis on Scopus was conducted to identify further eligible studies. The full search strategy and keywords can be found in the Supplementary Material.
Study Selection and Eligibility Criteria
The studies selected in the initial electronic search and the studies added through the citation analysis were independently reviewed by two researchers with a third reviewer acting as an arbitrator if required. This process resulted in 79 included studies, all of which are included in the present study. Any physical patient health-related outcome was eligible for inclusion. Studies that fulfilled any of the following criteria were excluded: (1) studies that only described a doctors’ effect on particular doctor-related variables (such as specialty of doctor), (2) studies with fewer than 15 doctors, (3) cross-sectional studies, and (4) studies that mention fixed or random effects but did not list them either graphically or in numerical form.
Data Extraction and Quality Assessment
CS extracted the relevant information for assessing doctor effects from each included study, and the extracted data was then reviewed by a second researcher. The data items extracted can be found in Table 1. For quality assessment, the Newcastle-Ottawa Scale (NOS) was used, with the majority of studies scoring between 8 and 9 (9 being the maximum total).34–36
 |
Table 1 Data Items Extracted |
Methodological Review
We planned to describe the methods used to estimate and report the doctors’ effect on patients’ physical outcomes including the statistical model used, types of confounding variables adjusted for (patient variables, hospital/institution variables, doctor variables), and the method of reporting the doctor effect.
Results
Of the 79 included studies, 62 used a multivariable multilevel regression model to estimate the doctors’ effect, 72 studies included patient variables in their model, 41 studies included hospital or institution variables in the model, 60 studies included doctors’ volume, and 24 studies included other doctor variables. There were two different ways that the doctors’ effect was reported: fixed effects and random effects,37,38 with 54 studies reporting fixed effects and 34 studies reporting random effects.
Table 2 provides details for each included study, presenting in part the wide variety of statistical methods used.
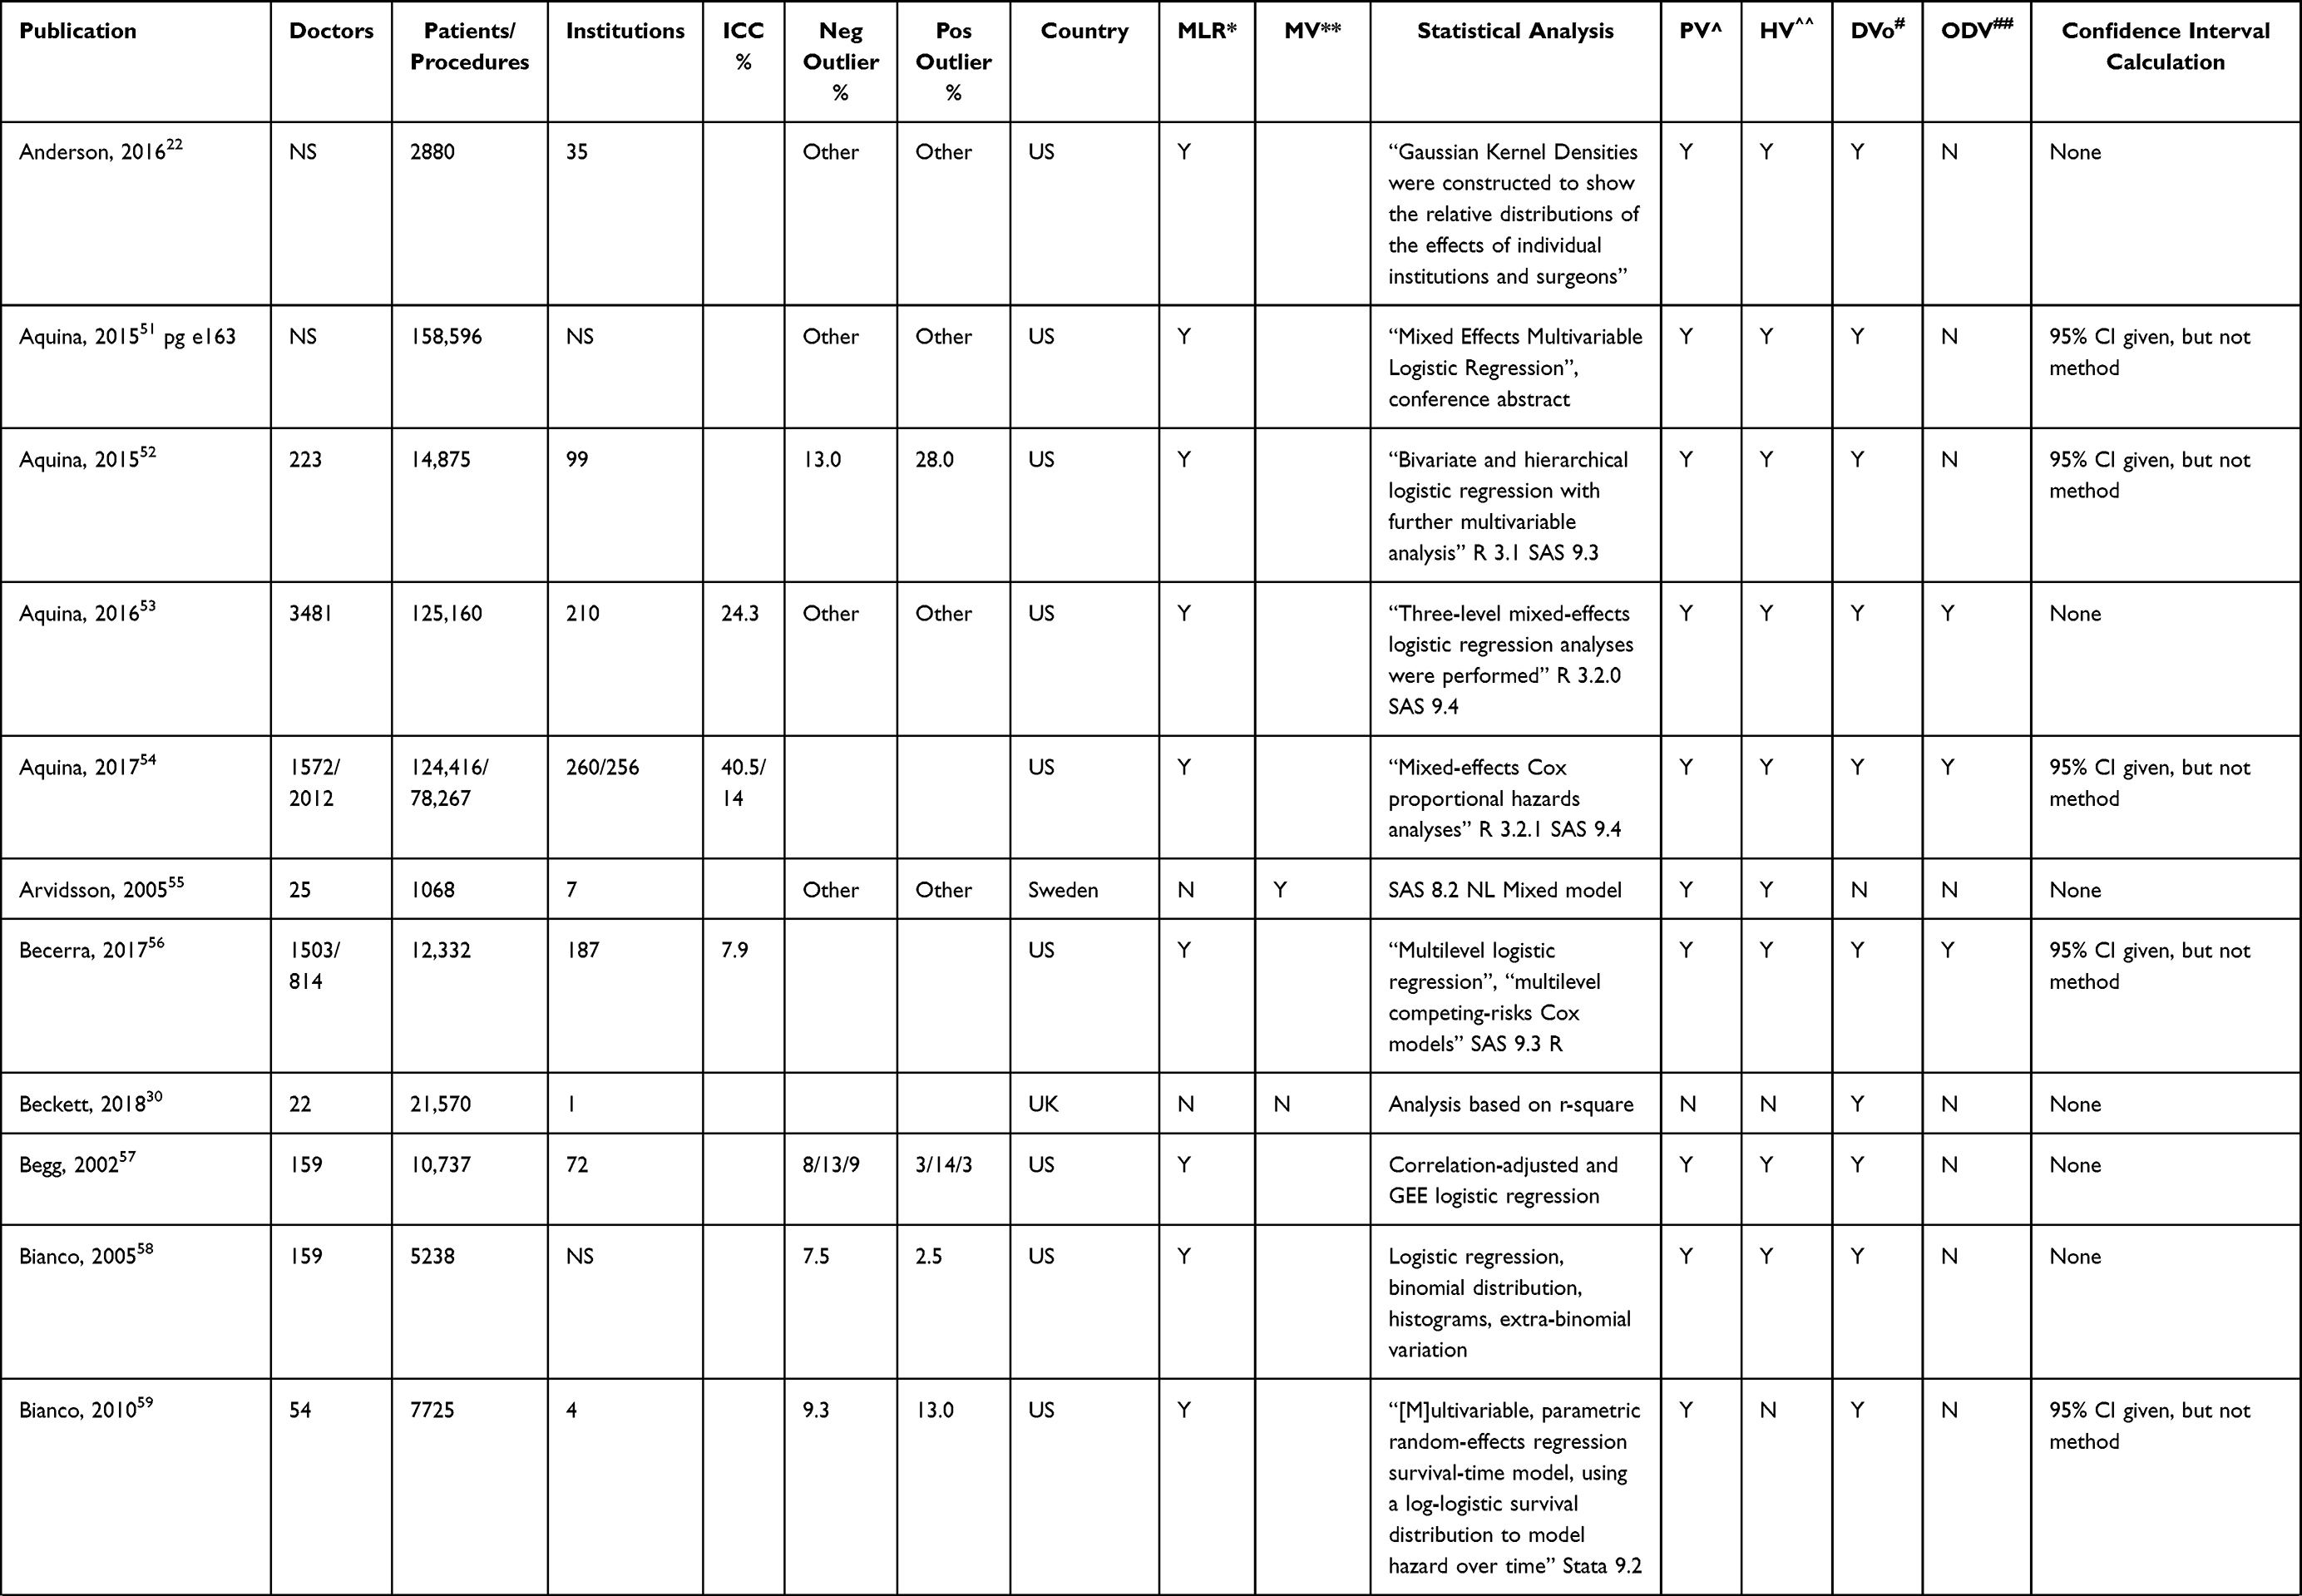 | 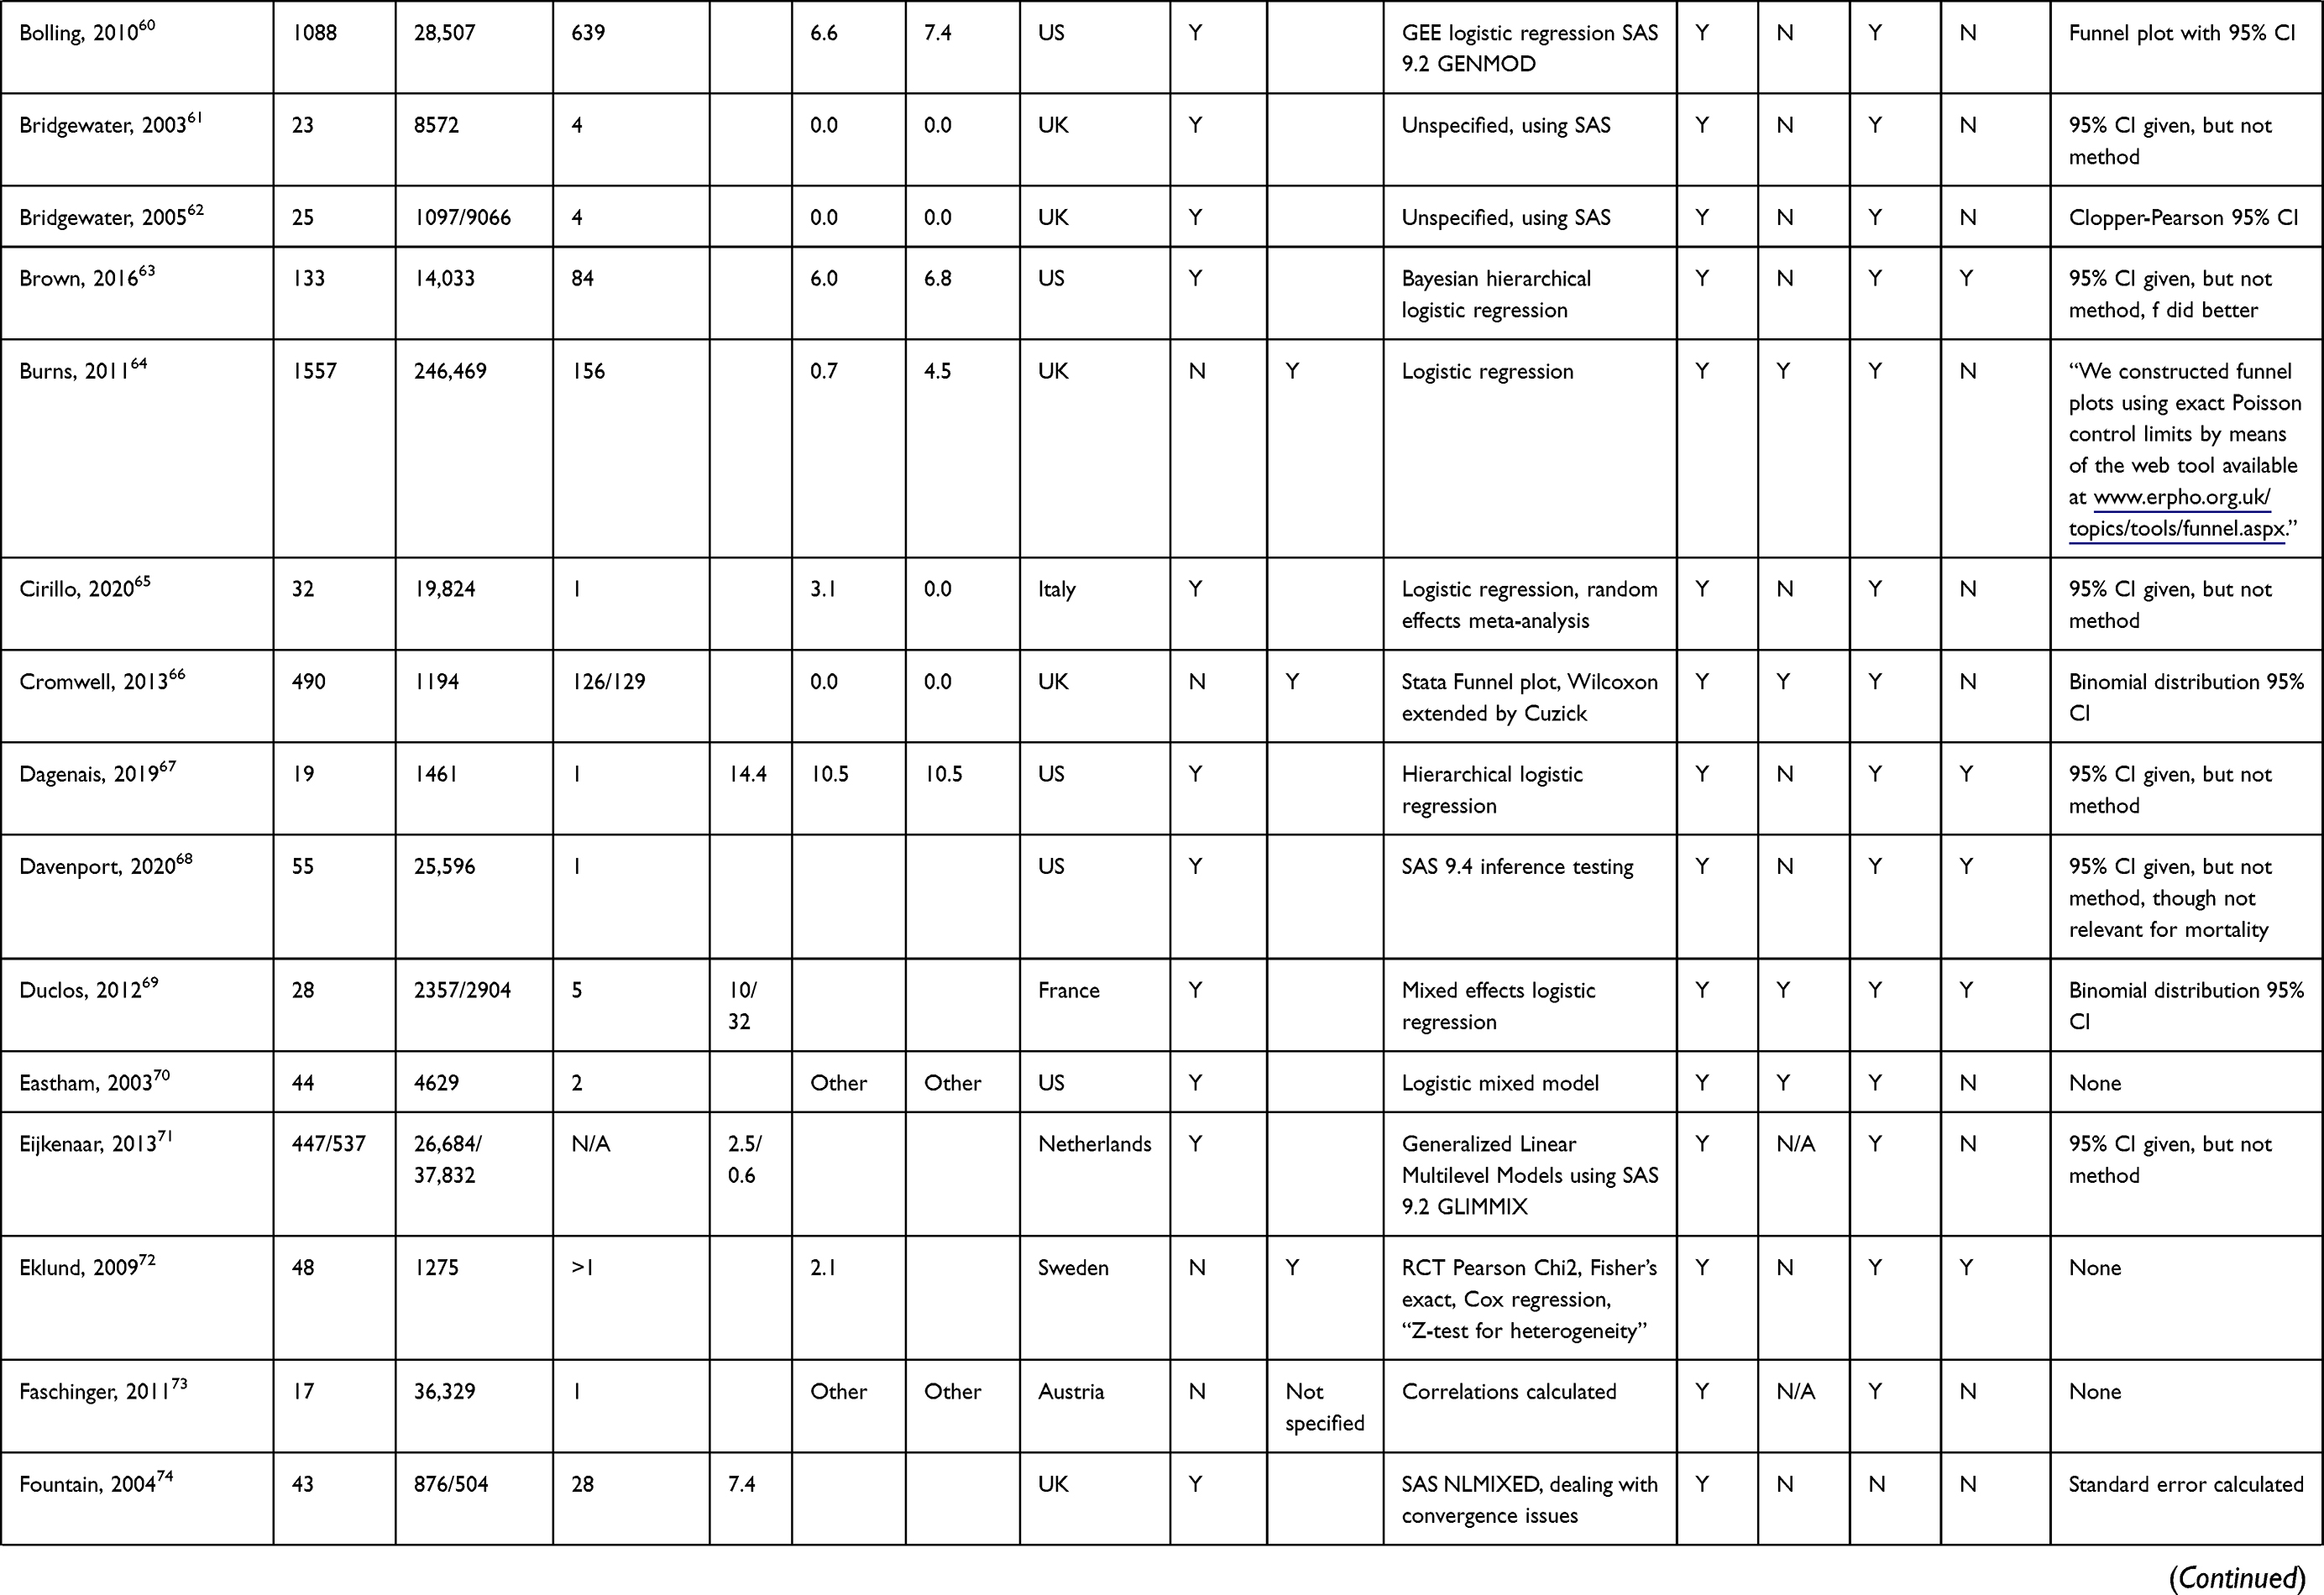 | 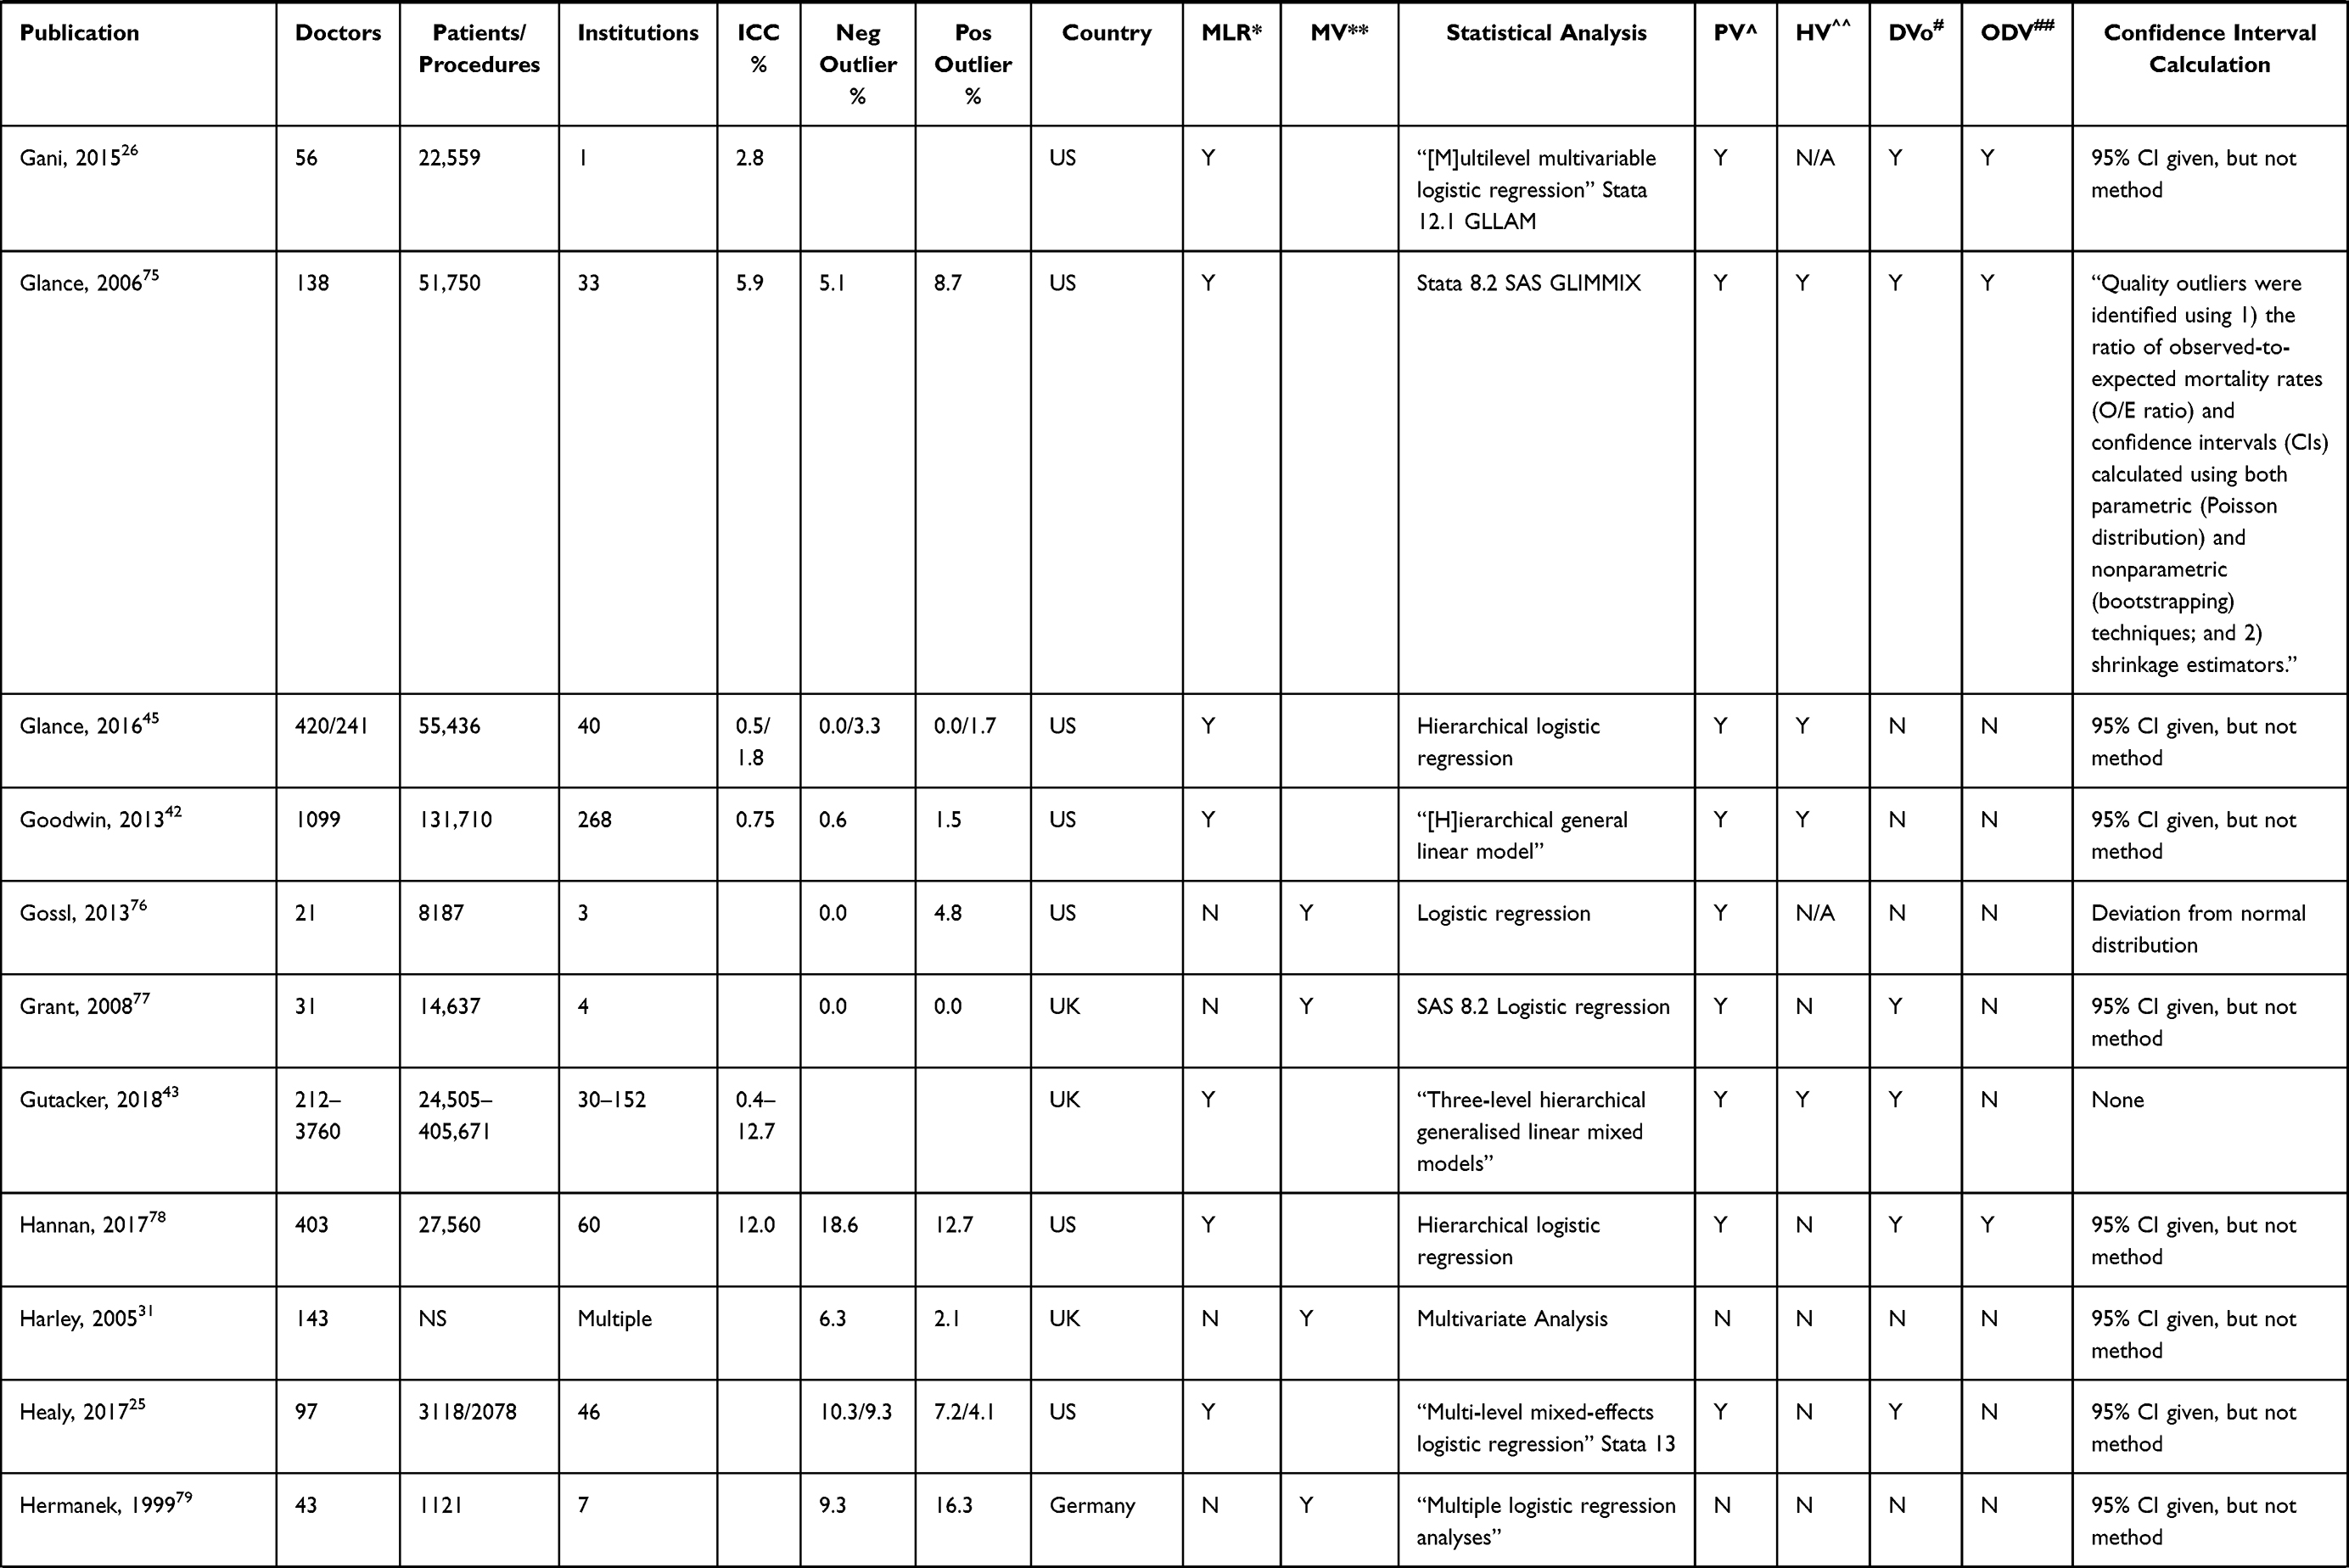 | 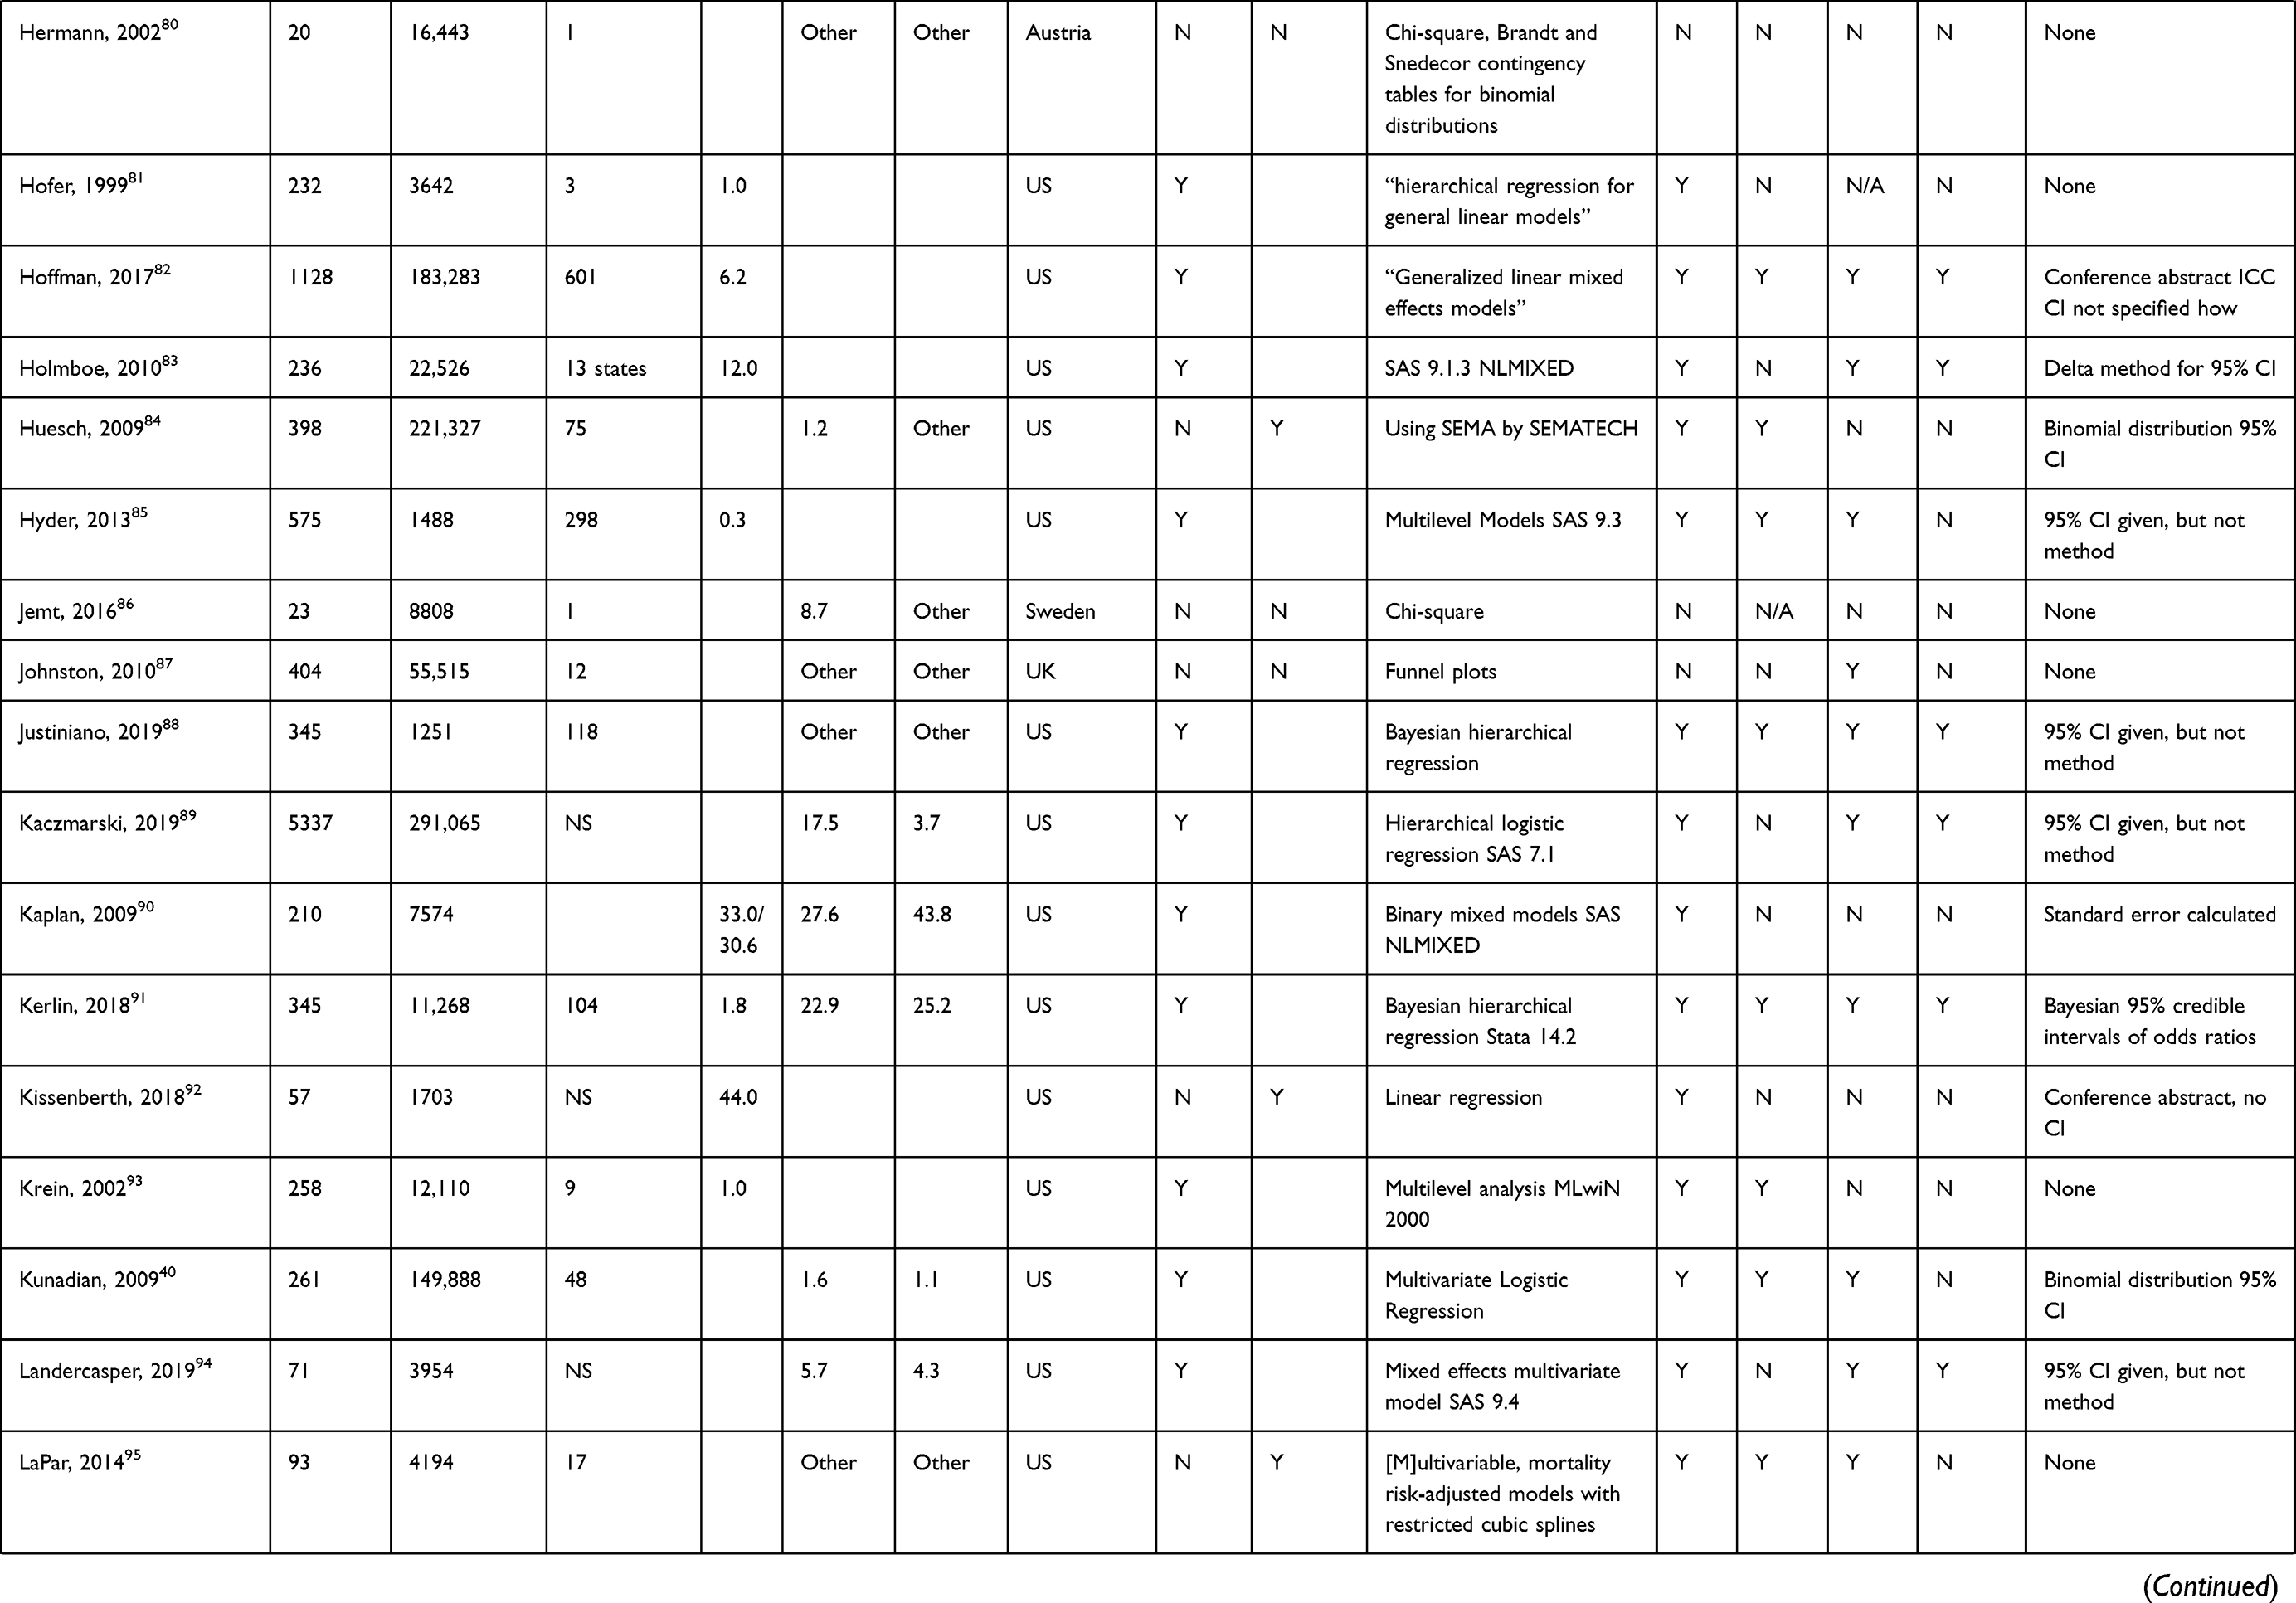 | 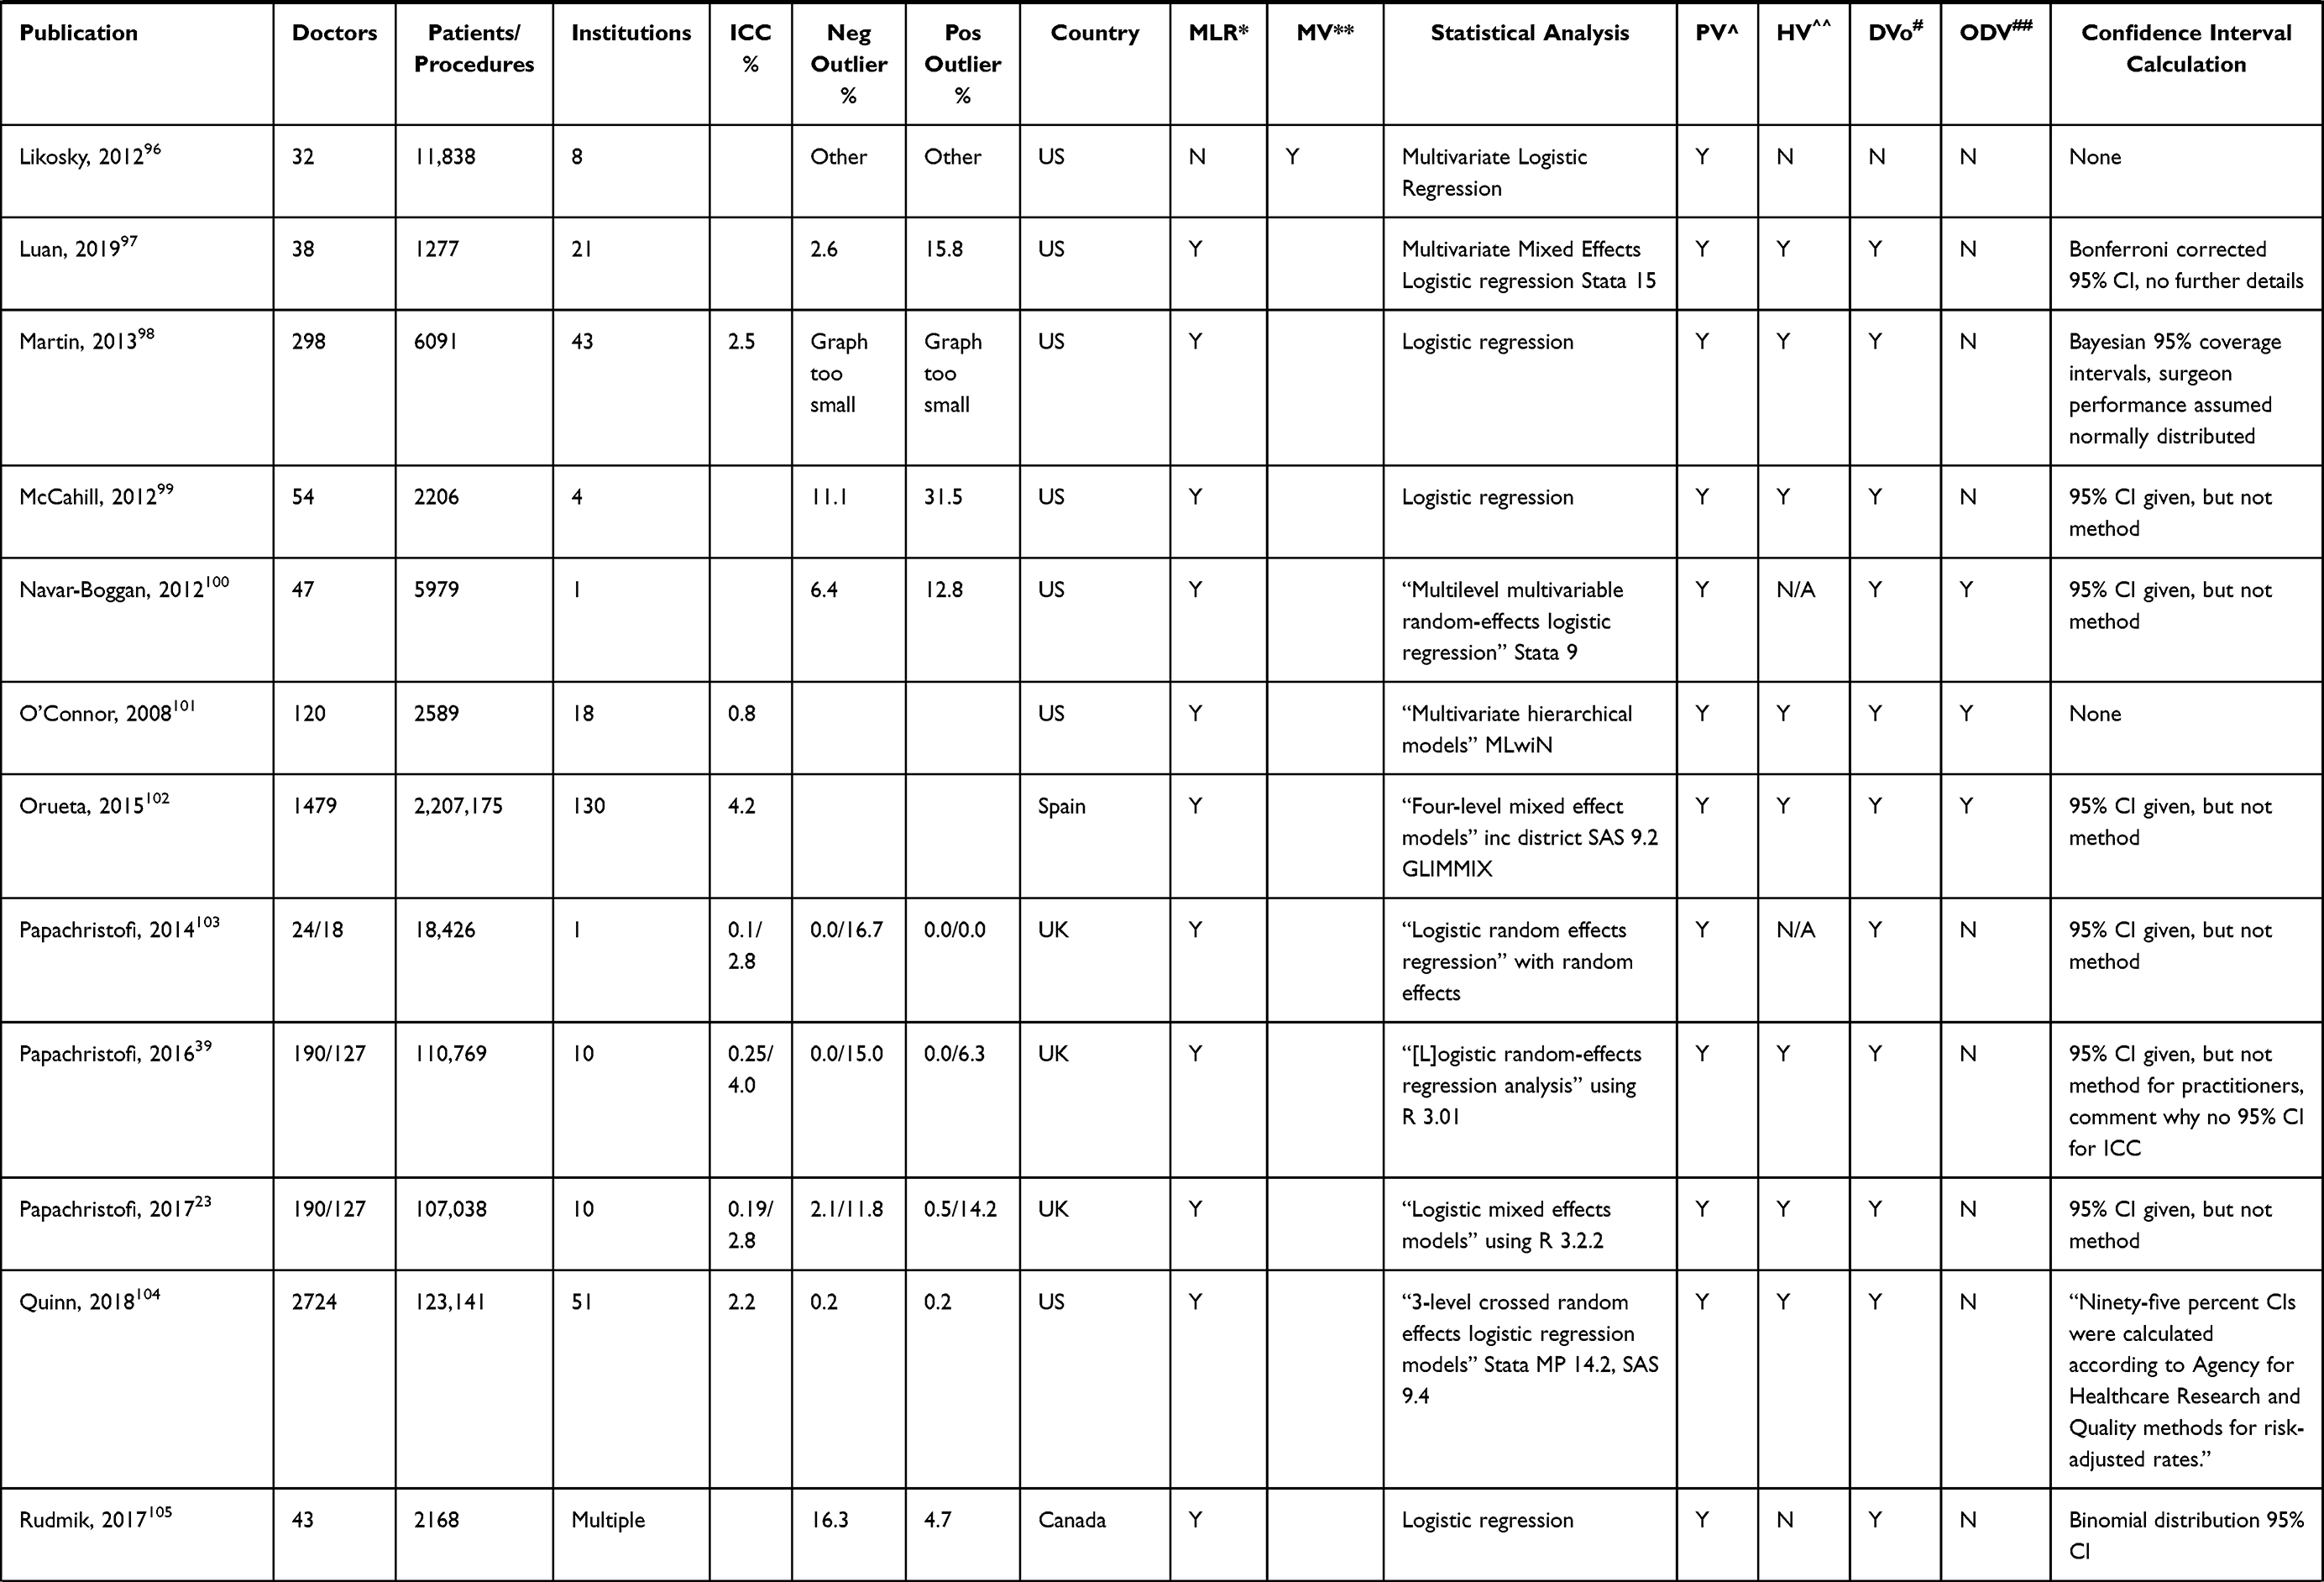 | 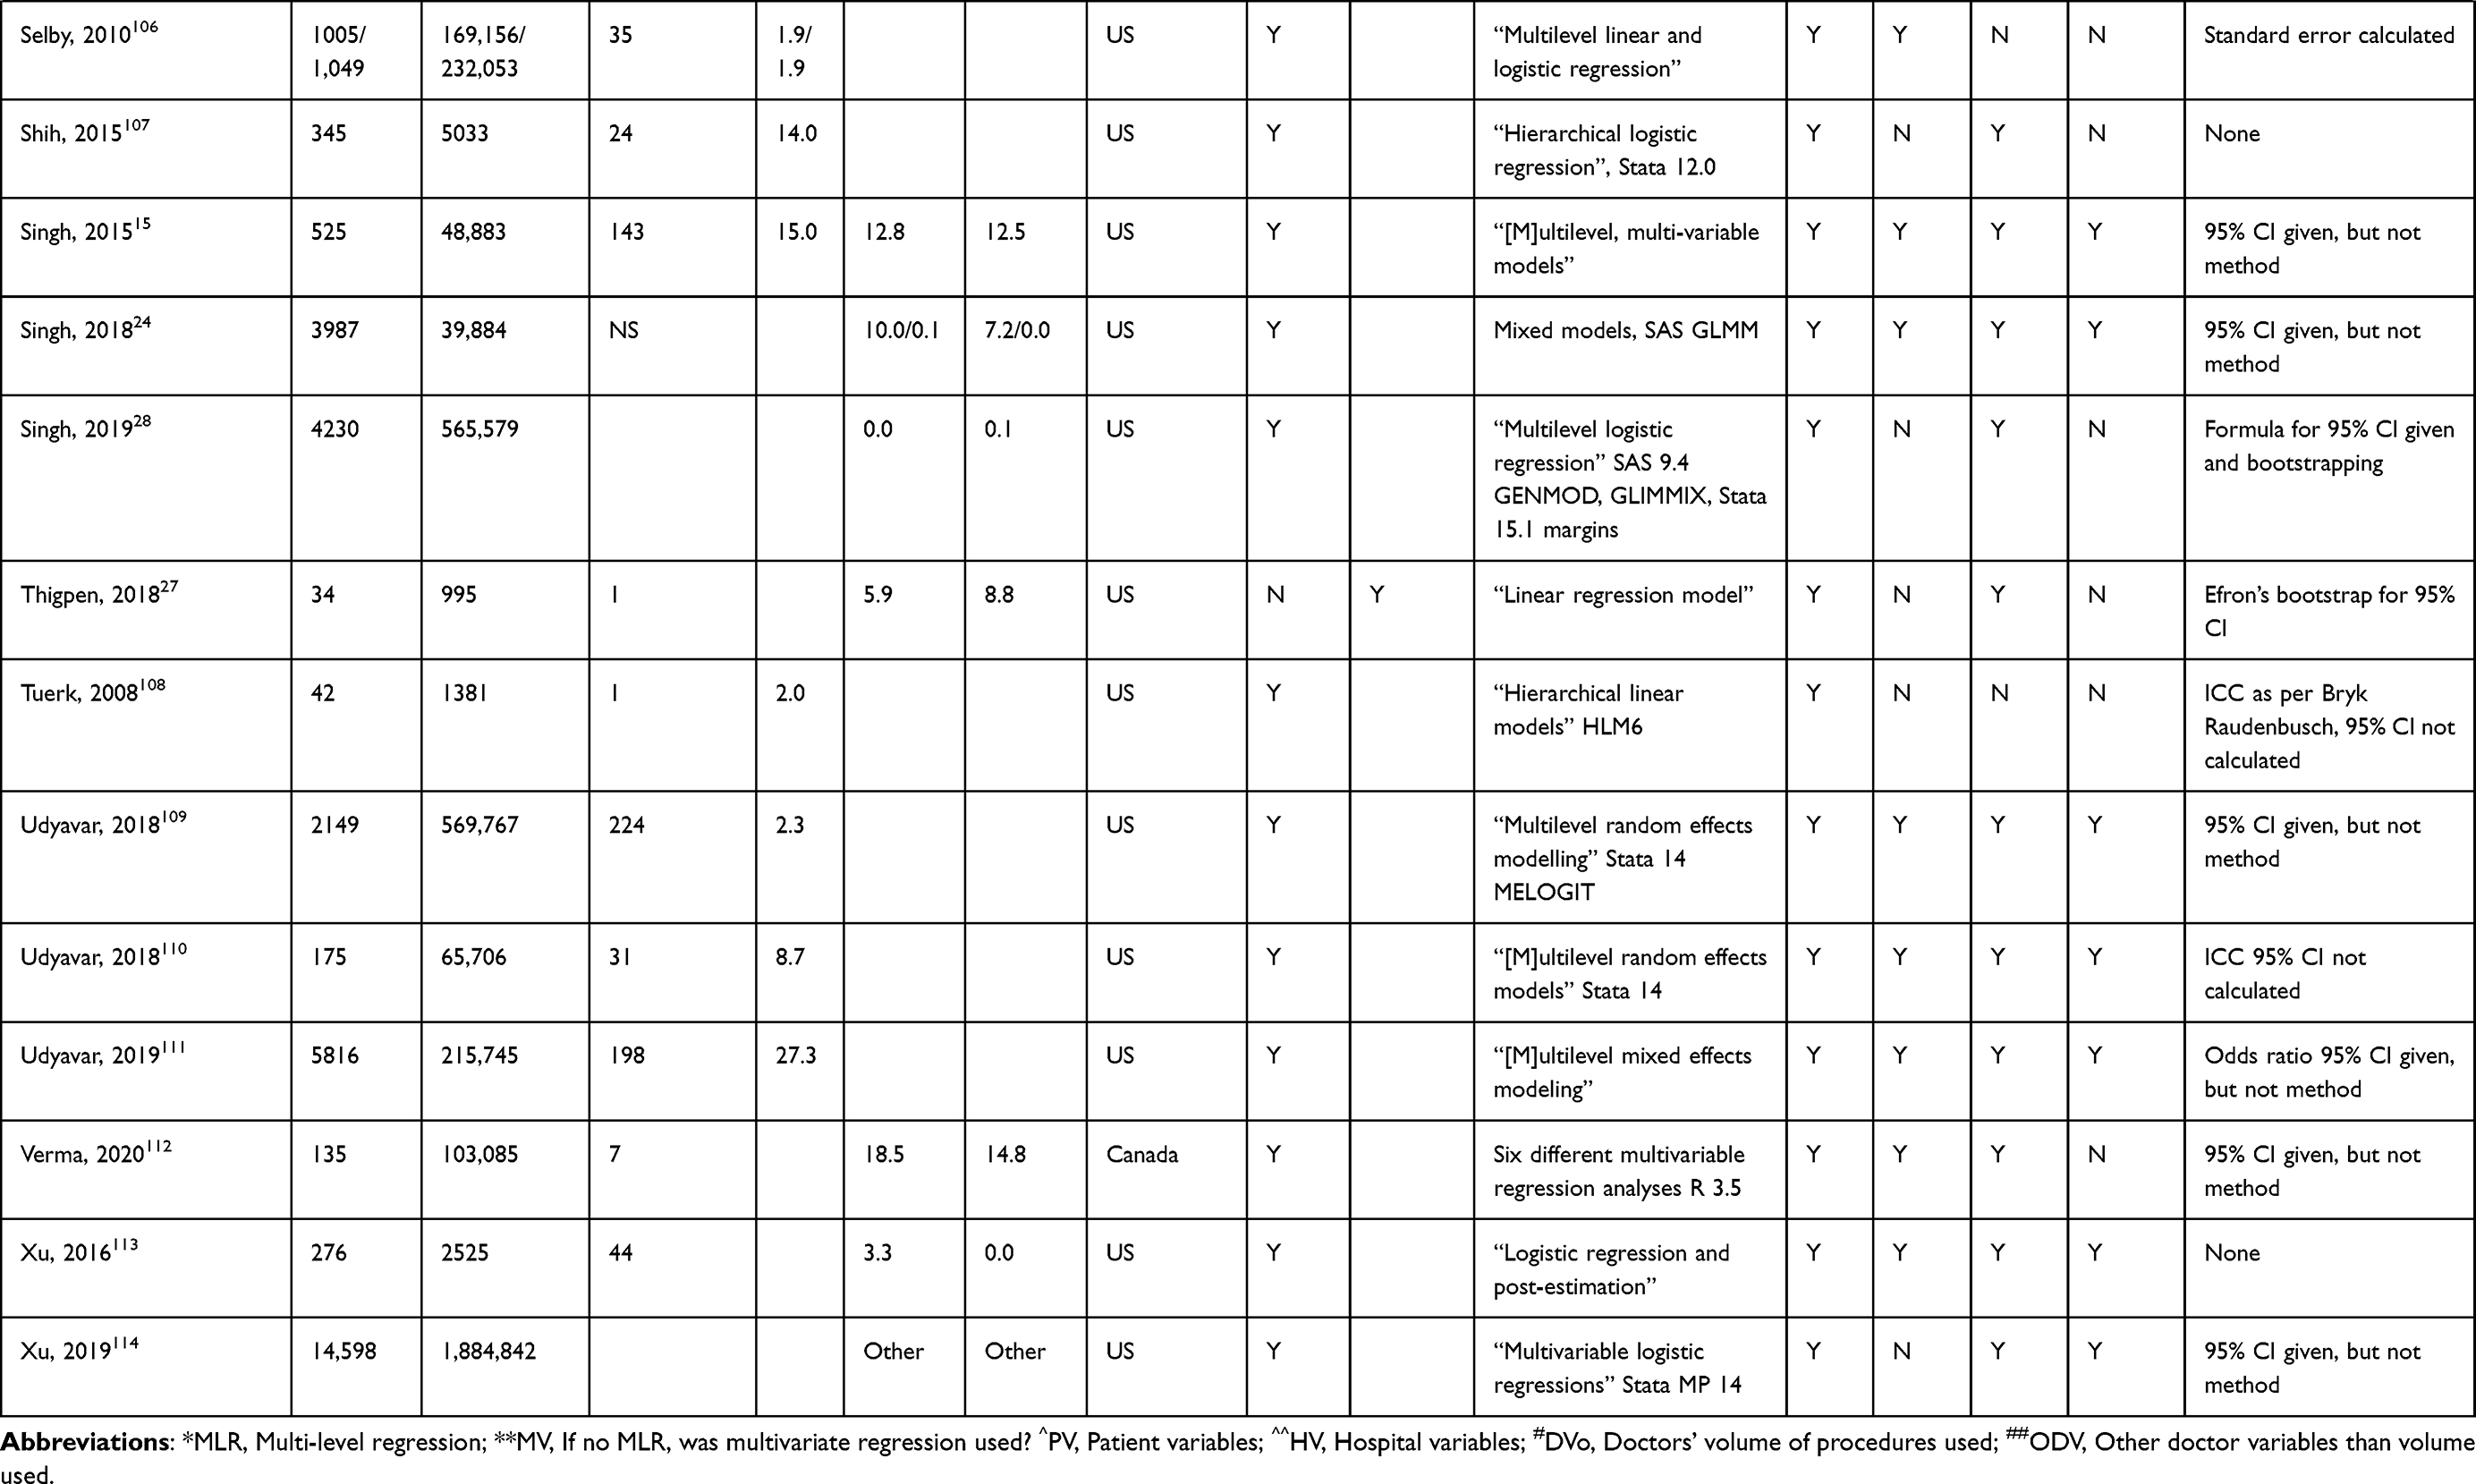 |
Table 2 Detailed Results for Each Study |
Fixed Effects – Grading Doctors by Their Effect
Fixed effects are represented by the range of patient outcomes that doctors are responsible for after all available confounding variables have been accounted for. They are shown visually using a caterpillar plot, which ranks doctors by outcomes from lowest to highest, or a funnel plot, which shows each doctor as a dot and indicates whether doctors are outside a 95% or 99% confidence interval. For example, Papachristofi et al39 showed caterpillar graphs with an ICC of 4.0% (surgeons) and an ICC of 0.25% (anesthetists) (Figure 1), while Kunadian et al40 showed a funnel plot with an ICC of 6.5% (Figure 2), redone at a higher resolution by the authors (Figure 3) and the same data as a caterpillar plot (Figure 4). Measuring fixed effects allows identification of high and low outliers and how heterogeneously doctors perform. They also show whether variation in performance is consistent with chance or whether the variation is more significant than that. Fixed effects are calculated through “modelling fixed provider effects”.41
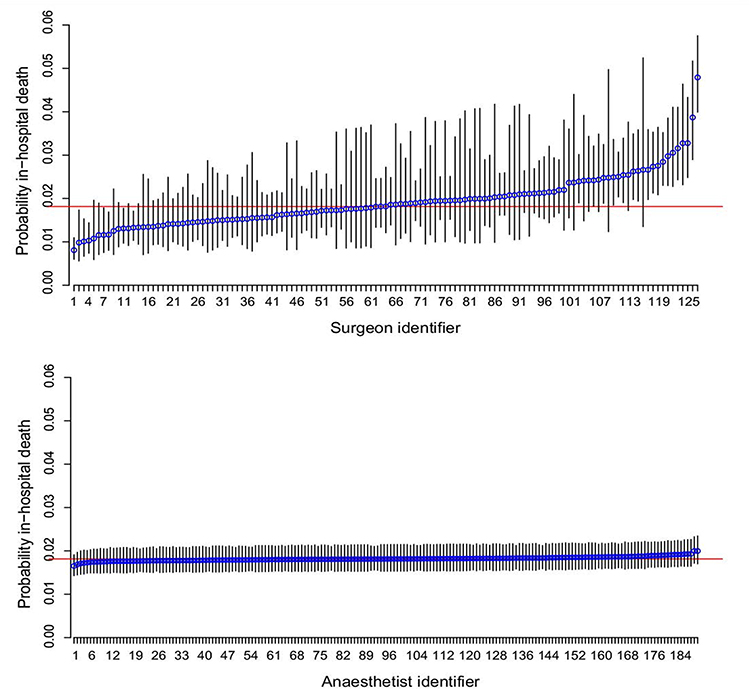 |
Figure 1 Estimated probability of in-hospital death within three months of surgery for a patient with average Euro-SCORE risk: (a) surgeons adjusted for centre and anaesthetist; (c) anaesthetists adjusted for centre and surgeon. The horizontal line is average probability (1.8%) for the study cohort. Error bars = 95% CI. Notes: Reproduced from: Papachristofi O, Sharples LD, Mackay JH, Nashef SAM, Fletcher SN, Klein AA. The contribution of the anaesthetist to risk-adjusted mortality after cardiac surgery. Anaesthesia. 2016;71(2):138–146. doi:10.1111/anae.13291.39 © 2015 The Authors. Anaesthesia published by John Wiley & Sons Ltd on behalf of Association of Anaesthetists of Great Britain and Ireland. Creative Commons CC BY (https://creativecommons.org/about/cclicenses/). |
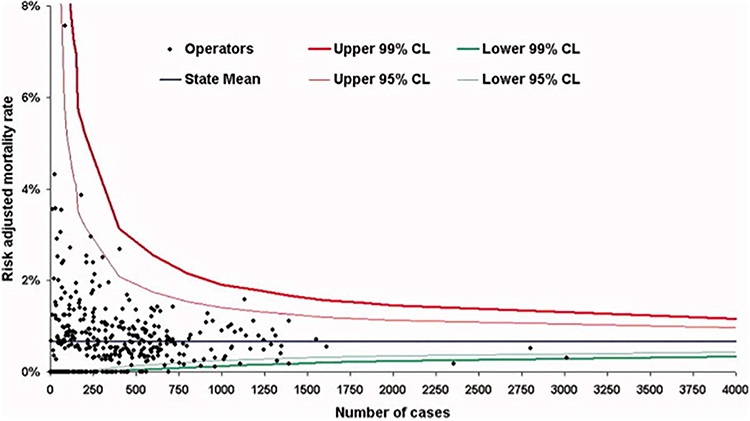 |
Figure 2 A funnel plot with each cardiologist represented by a black dot with 95% and 99% confidence intervals. The grey horizontal line is the average mortality for percutaneous coronary intervention (PCI) in New York State 2002–2004. Notes: Reproduced/used with permission of John Wiley & Sons - Books, from: Kunadian B, Dunning J, Roberts AP, Morley R, de Belder MA. Funnel plots for comparing the performance of PCI performing hospitals and cardiologists: demonstration of utility using the New York hospital mortality data. Catheter Cardiovasc Interv. 2009;73(5):589–94. doi:10.1002/ccd.21893.40 Copyright © 2009 Wiley‐Liss, Inc. Permission conveyed through Copyright Clearance Center, Inc. |
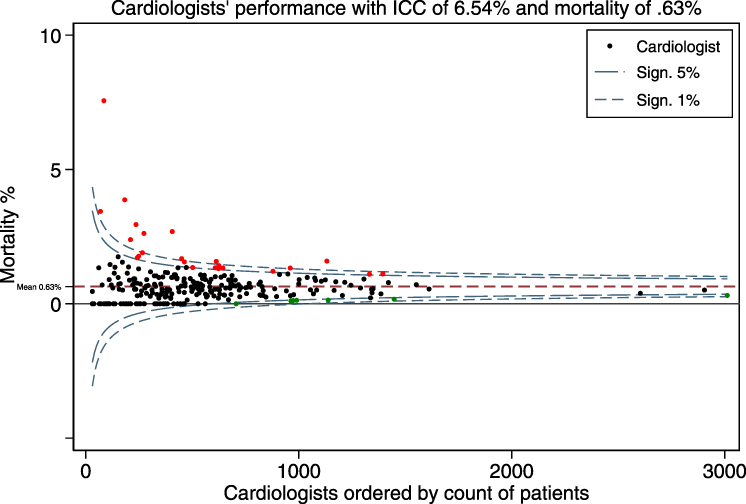 |
Figure 3 This figure was created by the authors and is a higher resolution version of Figure 2 using the same data. It is a funnel plot with each cardiologist represented by a dot with 95% and 99% confidence intervals. Cardiologists whose mortality confidence interval is above the 95% line are marked in red, those below marked in green. Notes: Adapated/used with permission of John Wiley & Sons - Books, from: Kunadian B, Dunning J, Roberts AP, Morley R, de Belder MA. Funnel plots for comparing the performance of PCI performing hospitals and cardiologists: demonstration of utility using the New York hospital mortality data. Catheter Cardiovasc Interv. 2009;73(5):589–94. doi:10.1002/ccd.21893.40 Copyright © 2009 Wiley‐Liss, Inc. Permission conveyed through Copyright Clearance Center, Inc. |
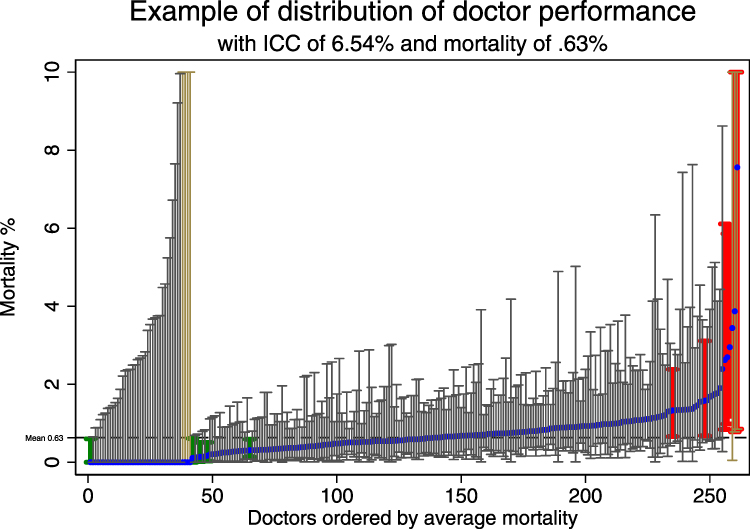 |
Figure 4 A caterpillar plot created by the authors. It uses the same data as Figures 2 and 3. Beige (on left) and brown (on right) confidence intervals have an upper limit above 10%. Green confidence intervals are wholly below average mortality, red confidence intervals wholly above. Notes: Data from this publicly available source117 which is the same one as used by Kunadian et al.40 |
Random Effects – Estimating the Variation Due to the Doctor
Random effects represent a percentage of the total variation in outcomes between patients that the doctors are responsible for. They are estimated via the intra-class correlation coefficient (ICC), which is the proportion of the total variation in the patient outcome attributed to doctors. There are many different ways to describe this effect.37 The ICCs measured and reported in the studies ranged from 0% to 47% with a median of 3%.
Discussion
This methodological review of studies that report a doctors’ effect on a patient's physical outcomes has identified wide variations in how researchers measure and report a doctors’ effect. However, there were 2 broad methods identified: fixed effects that allow doctors to be ranked; and random effects where the proportion of variance attributed to unexplained differences between doctors is estimated. The most common statistical model used in the analyses was a multivariable multilevel regression where the types of confounding variables adjusted for included those assessing patient risk, known doctor attributes, and, to a lesser degree, differences between hospitals or institutions.
Glance et al38 discuss in some detail three approaches of provider profiling for binary outcomes, namely conventional logistic regression, hierarchical logistic regression, and fixed-effects logistic regression. They conclude that hierarchical logistic regression is generally preferred, except in the case where providers have low case volume, where hierarchical logistic regression understates the provider effect. We agree that hierarchical logistic regression is an acceptable method for provider profiling as it allows measurement of the strength of the providers’ effect on physical patient health.
This review identified substantial heterogeneity in how the percentage of the variation due to the doctors is reported. For example, Goodwin et al42 reported the percentage of the variation for the null model as the “ICC” and the variation calculated after taking all available information into account as “partitioned variance”. It is helpful to calculate the variation of the null model as, if there is negligible or no variation, there is no need to include additional levels in the analysis. In both cases, the null and adjusted models, the ICC was calculated. In contrast, Gutacker et al43 referred to the random effect measure as the “variance partition coefficient”.
A crucial element of reporting fixed effects is the calculation of the confidence intervals of each doctors’ performance. Glance et al38,44,45 provide a detailed technical discussion of the respective advantages of using fixed (grading doctors from worst to best) and random effects (calculating the percentage of outcome variation due to the doctor). One pertinent issue discussed is that the smaller the cluster is, ie the fewer patients the doctor has, the greater the shrinkage towards the mean,46,47 reducing the calculated ICC, and leading to an underestimate of the difference in performance between doctors.
Interpreting the Doctor’s Effect
The clinical importance of the findings from the studies assessed in this methodological review depends on how common the outcome assessed is and how varied the doctors’ effect is among practitioners. The more common and the more varied, the more the finding is clinically important. The choice between a doctor with an above or below average effect will have implications for the patients’ health outcomes at different levels of how common the outcome is and how strong the doctors’ effect is. The stronger the doctors' effect and the more important the outcome, the more the choice of doctor matters for the individual. The more common the outcome is, the more the choice of doctor matters for population health.
Table 3 by Baldwin et al,21 originally from Wampold et al,48 and augmented by Kraemer et al,49 shows effect sizes for different ICCs. The intra-class correlation coefficient (ICC) can measure the percentage of the variation in patients’ physical health outcomes due to each component of a medical interaction,21 which is typically the patient, the doctor, the hospital, and the intervention. Table 3 shows a scenario where 50% of the patients recover from an intervention when there is no doctors’ effect, ie for an ICC of zero. However, an ICC of 5.9% is reported to produce a medium-sized effect (Cohen’s d) with a Number Needed to Treat (NNT) of 3.6. Under such circumstances, an ICC of 5.9% can mean that doctors have a clinically significant effect that is greater than many interventions.
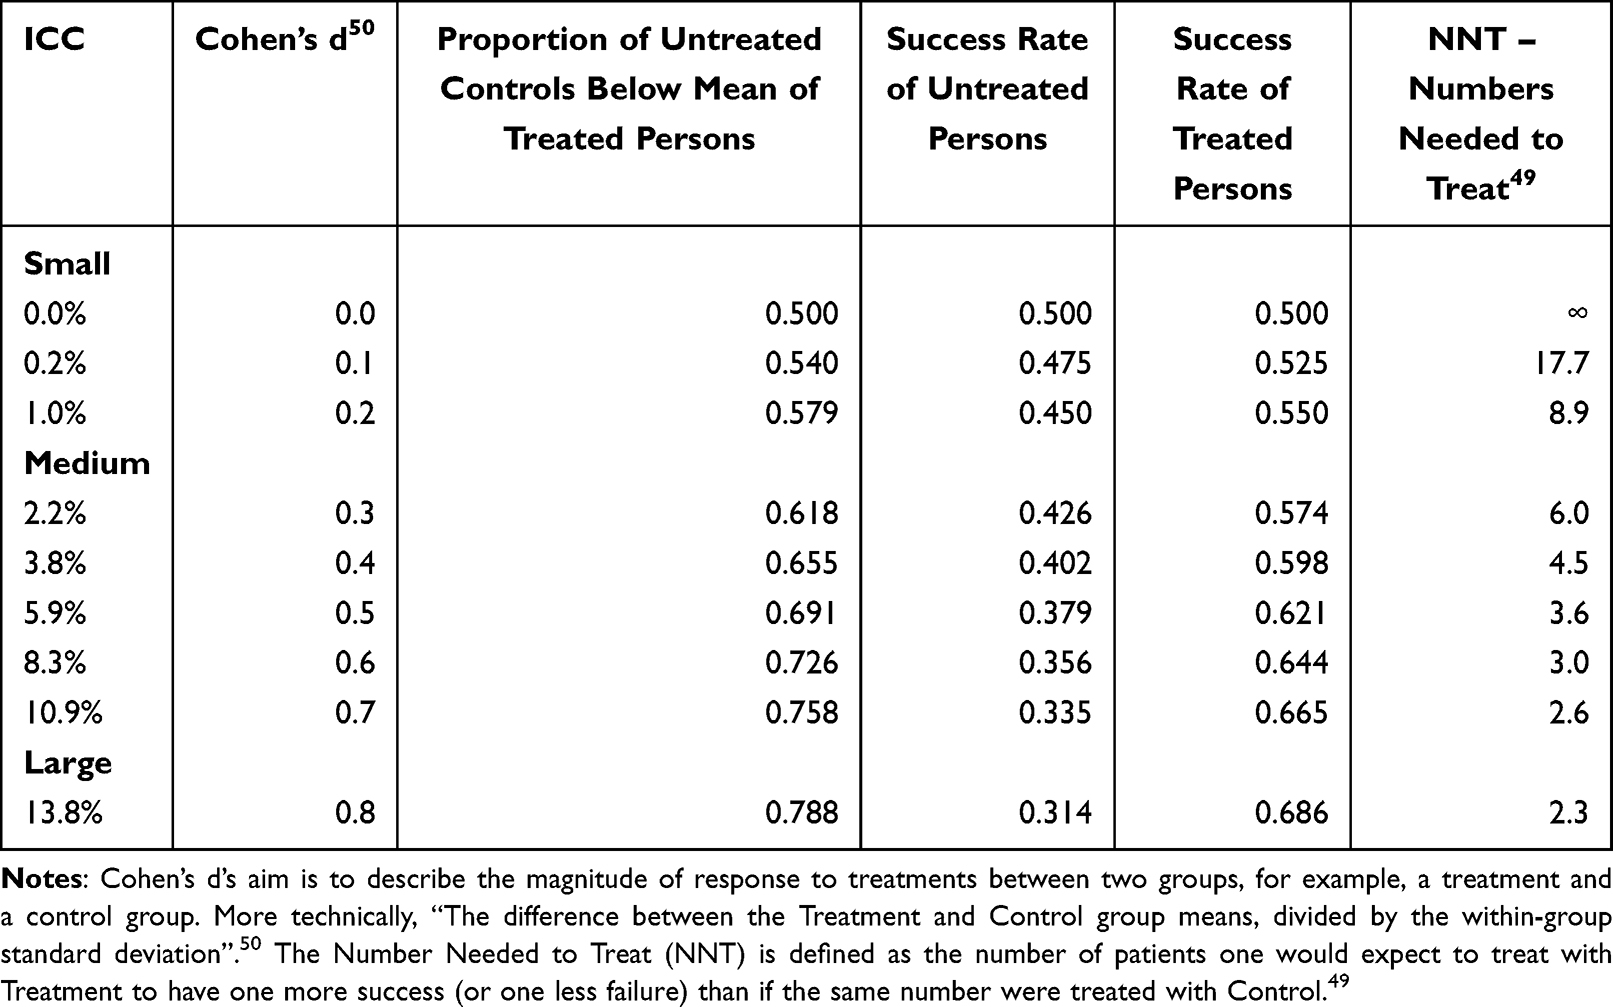 |
Table 3 Relationship Between ICC, Cohen’s d, Success Rates and NNT |
Recommendations
How to Report a Doctors’ Effect
If researchers wish to report a doctors’ effect that has been estimated, we recommend the following:
- Including “doctors” effect’ or “physicians” effect’ in the keywords and optionally in the title or abstract
- Using multivariable multilevel regression for the analysis with adjustments for patient risk, doctor experience, hospital effects, and any other potential confounding variable
- For describing fixed effects – grading doctors from worst to best, showing individual results for each doctor in a Table or a Figure
- For describing random effects, calculation of the intra-class correlation coefficient (ICC), describing the variation with 95% confidence interval and whether the outcome is a binary or continuous variable
- Making the dataset used for the analysis available for other researchers to conduct their own analyses.
What to Report
Observational Studies
We recommend reporting doctor effects after all available confounding variables have been taken into account, either by (a) the percentage of variation in the patient outcomes which is attributed to the doctor but unexplained by known attributes such as their experience, or (b) the ordering of doctors by their patients’ physical health outcomes, or (c) ideally both.
Reporting this data offers the potential to identify both low and high outliers among doctors, as well as how much of an unexplained doctors’ effect there is on patient outcomes.
Data Points to Report
Table 4 lists the data points that are recommended to report. Table 5 shows a specific example of those reported data points employing the dataset used in Kunadian et al.40
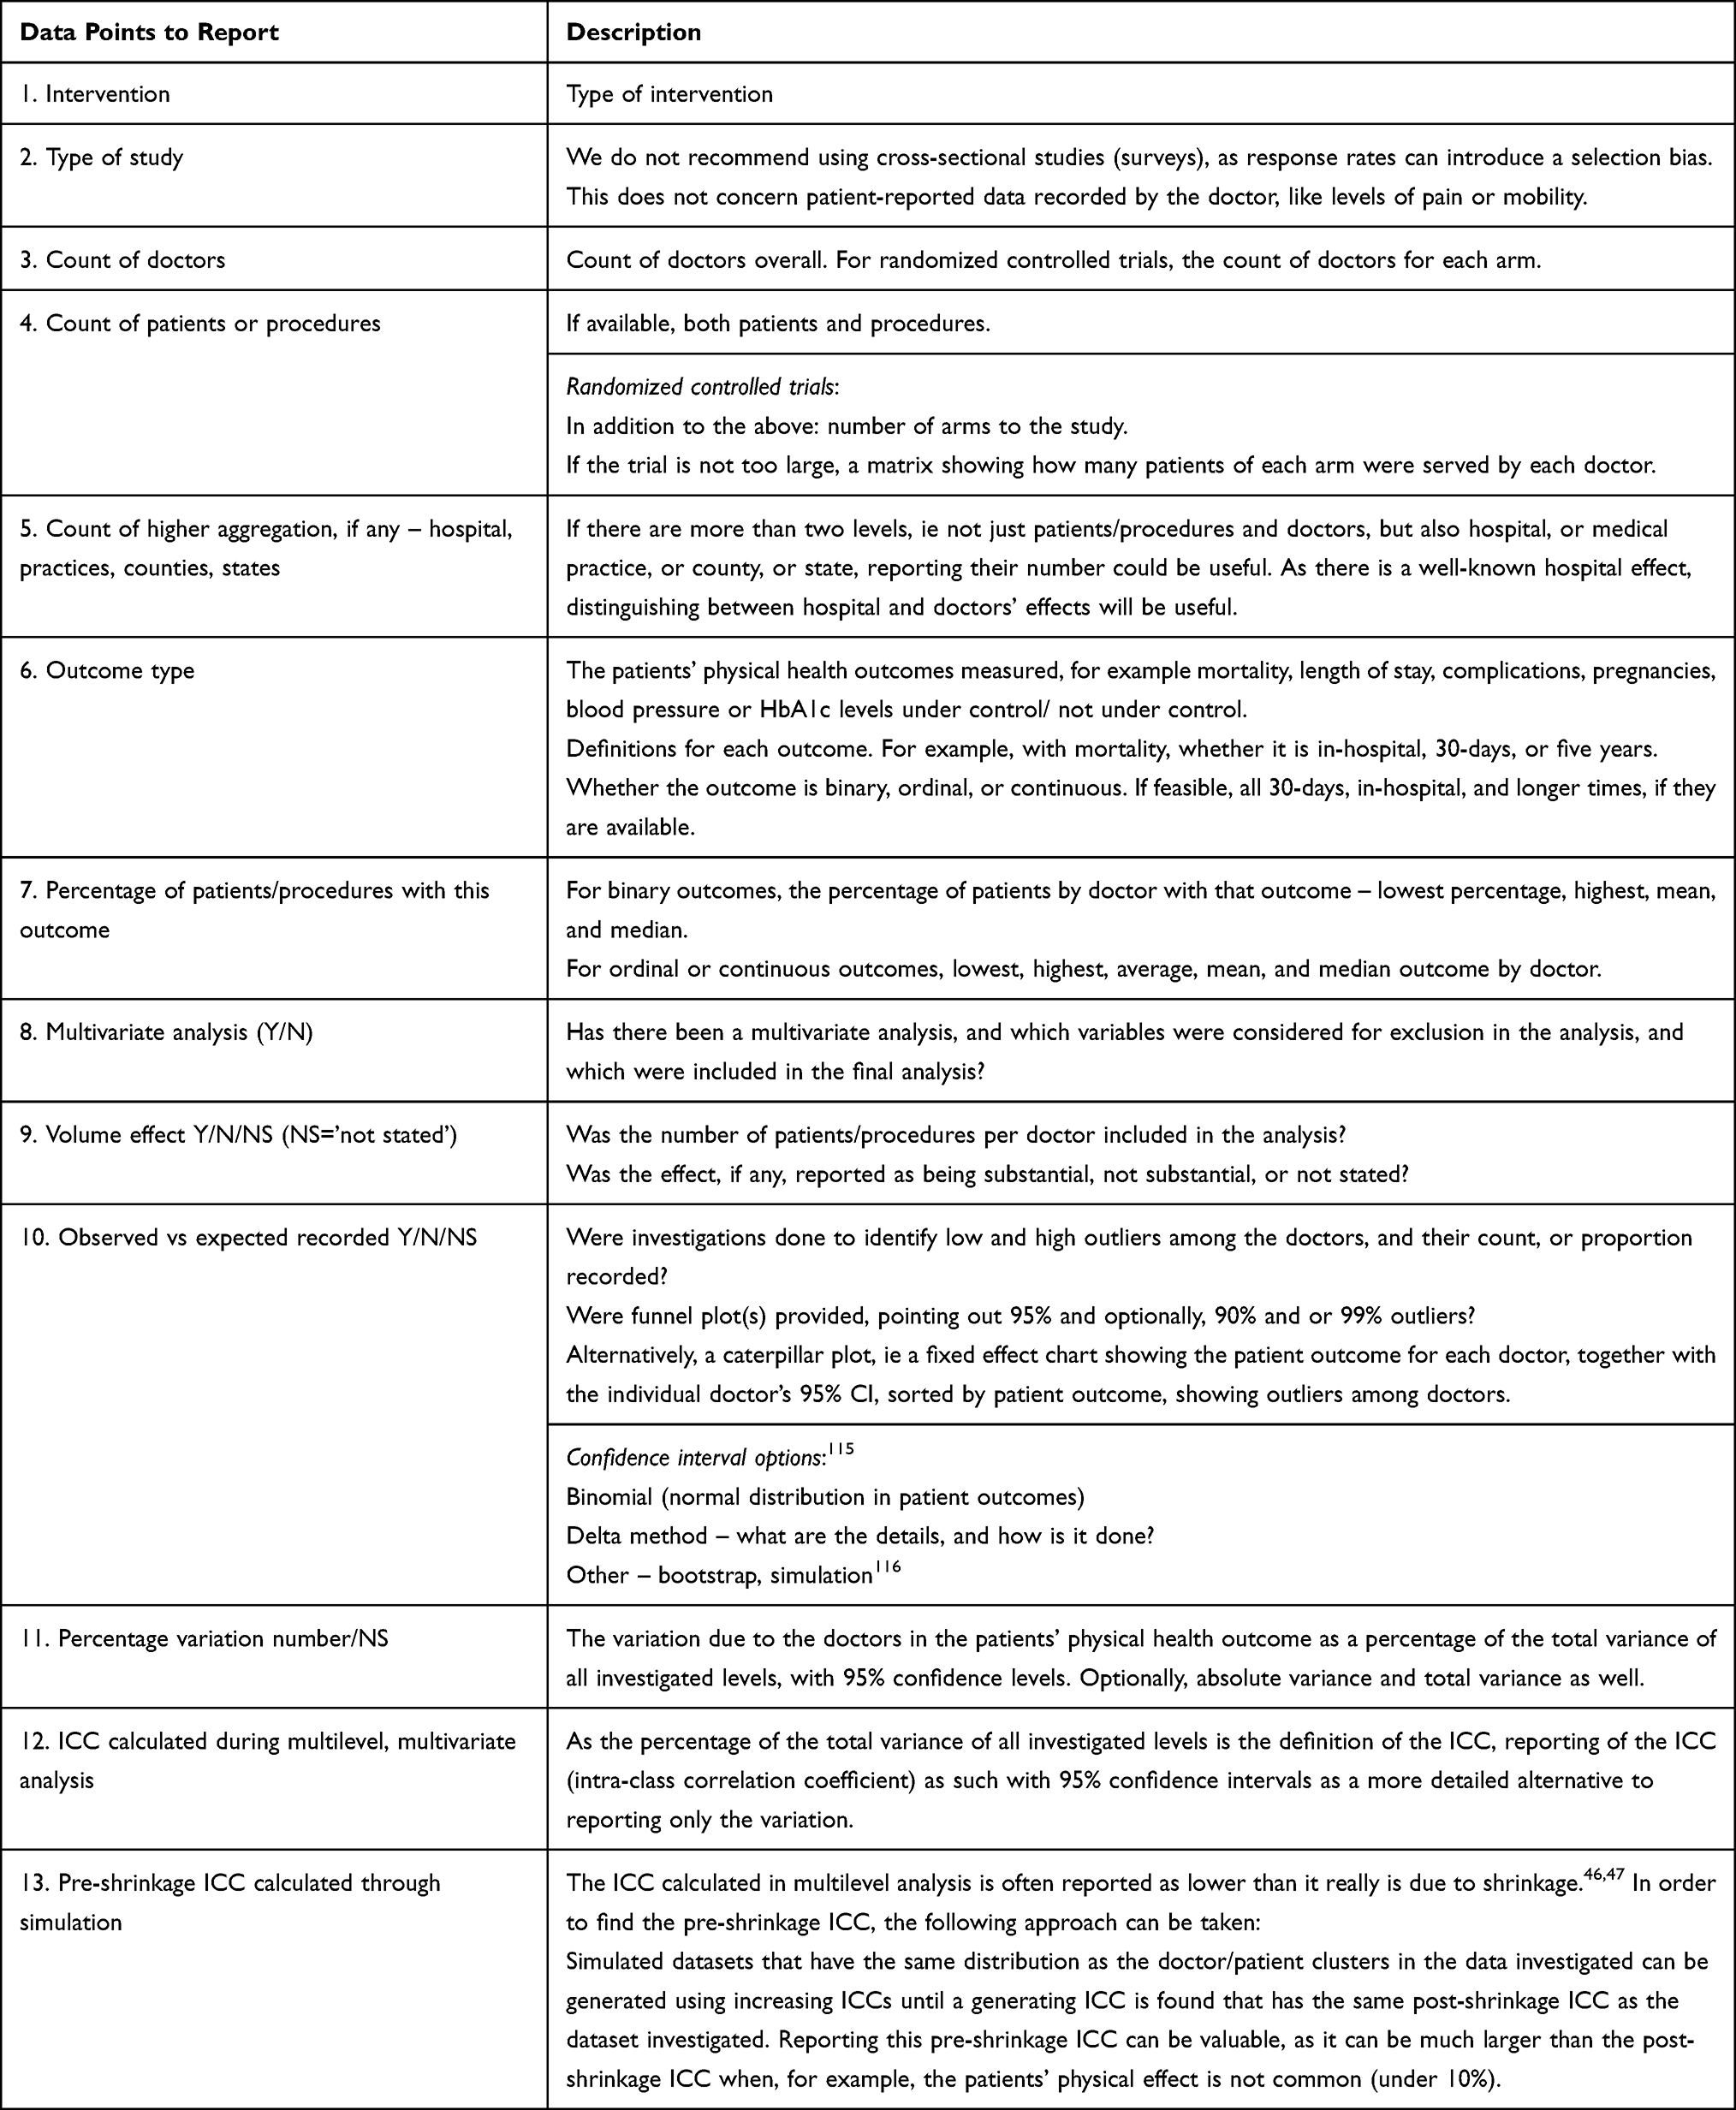 |
Table 4 Data Points to Report |
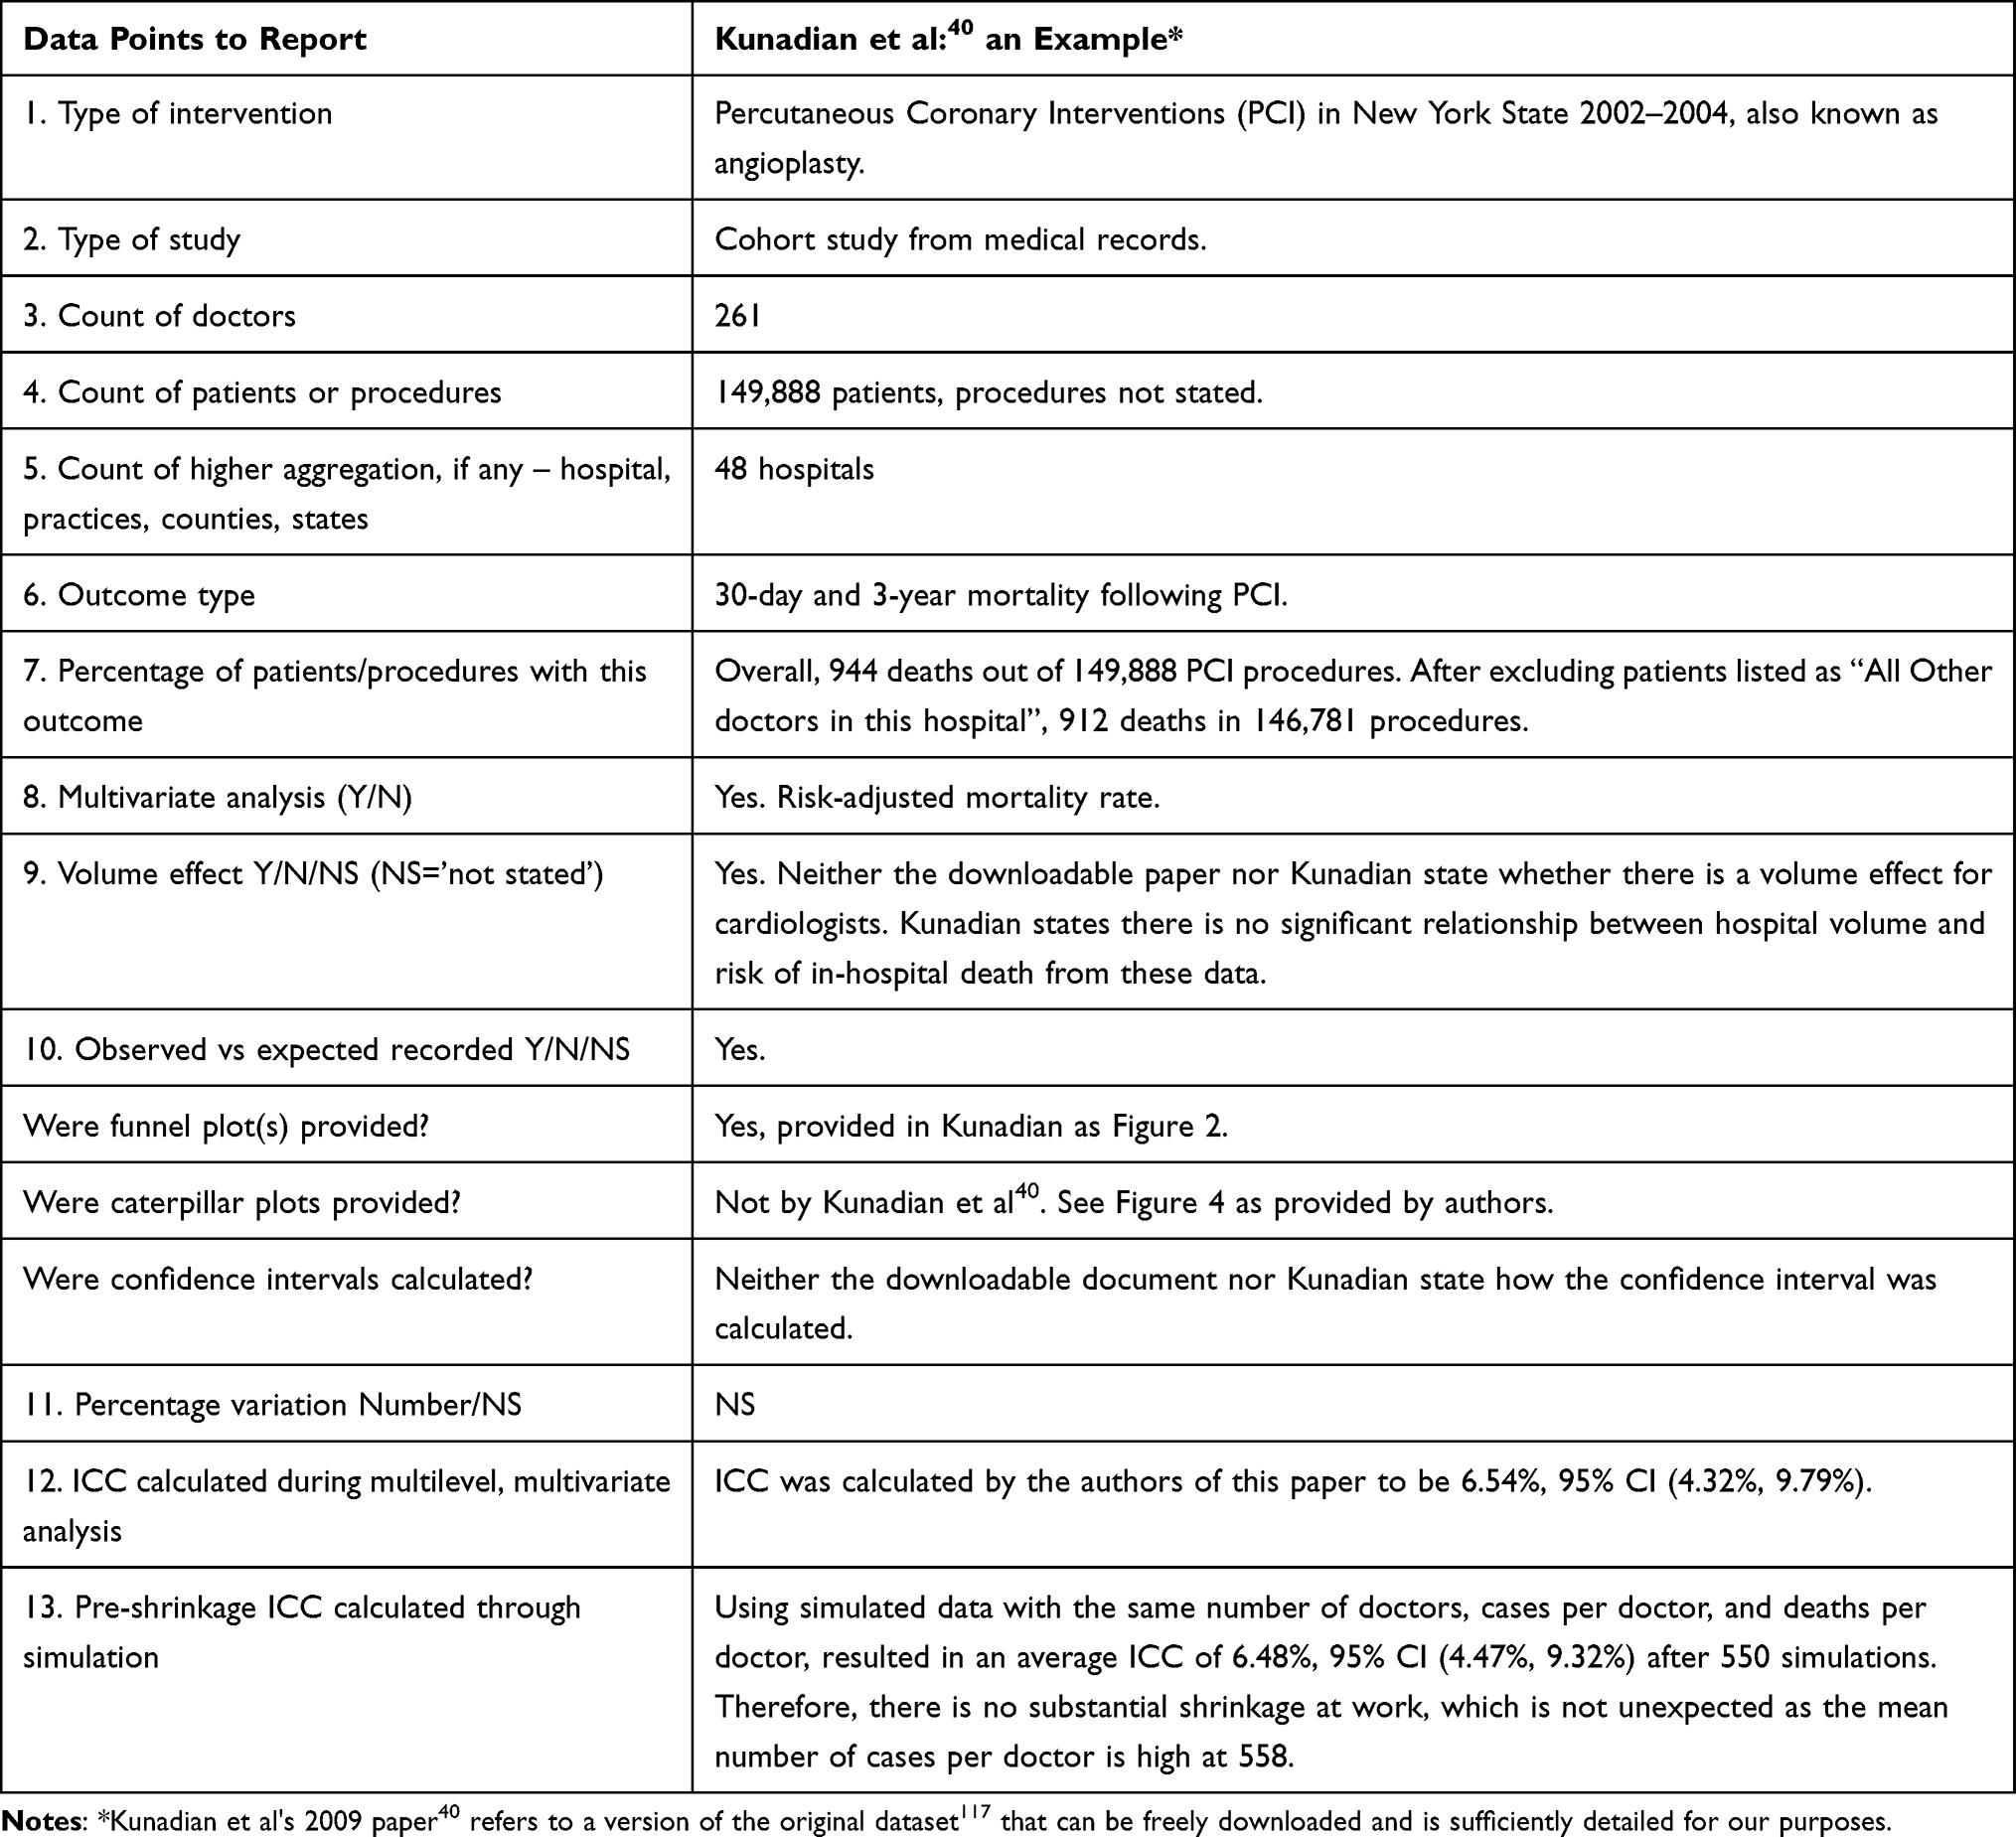 |
Table 5 Data Points Reported by Kunadian et al |
Strengths and Limitations
This is the first methodological review on the reporting of doctors’ effect on patient outcomes. The clarity and simplicity of how doctors’ and surgeons’ effects are described here and the suggested standardization of such reporting should allow meta-analysis to be conducted, allow robust identification of outliers, and make the re-analysis of much existing data feasible. However, a limitation is that, as all of the included studies were conducted in North America or Europe, it is unclear whether the findings can be generalized to other regions, particularly in developing nations.
Conclusion
A doctors’ effect on patients’ physical health can be measured and reported in two ways:
Firstly, by calculating the percentage of variation in patients’ physical health outcomes due to the doctor in the form of the intra-class correlation coefficient (ICC). Secondly, by grading doctors from best to worst patients’ physical health outcomes, assigning a confidence interval to those outcomes, and reporting how many doctors’ confidence intervals fall wholly above or below the overall average. Ideally, both should be reported.
Ethical Approval
As this is a methodological review, no ethical approval was required.
Acknowledgments
The authors thank Dr Aya Ashraf Ali and Tulia Gonzalez Flores for their excellent editorial contributions.
The authors thank Dr Rachel Mascord for her support during the systematic review.
Author Contributions
Both authors made a significant contribution to the work reported, whether that is in the conception, study design, execution, acquisition of data, analysis and interpretation, or in all these areas; took part in drafting, revising or critically reviewing the article; gave final approval of the version to be published; have agreed on the journal to which the article has been submitted; and agree to be accountable for all aspects of the work.
Funding
This research received no specific grant from any funding agency in the public, commercial, or not-for-profit sectors.
Disclosure
All authors have completed the ICMJE uniform disclosure form at www.icmje.org/coi_disclosure.pdf and declare no support from any organization for the submitted work, no financial relationships with any organizations that might have an interest in the submitted work in the previous three years, and no other relationships or activities that could appear to have influenced the submitted work. The lead author affirms that the manuscript is an honest, accurate, and transparent account of the study being reported, that no important aspects of the study have been omitted, and that any discrepancies from the study as originally planned (and, if relevant, registered) have been explained.
References
1. Moreau A, Boussageon R, Girier P, Figon S. Efficacité thérapeutique de “l’effet médecin” en soins primaires. Presse Med. 2006;35(6):967–973. doi:10.1016/S0755-4982(06)74729-7
2. Cook JA, Bruckner T, MacLennan GS, Seiler CM. Clustering in surgical trials - database of intracluster correlations. Trials. 2012;132. doi:10.1186/1745-6215-13-2
3. De Vries EN, Ramrattan MA, Smorenburg SM, Gouma DJ, Boermeester MA. The incidence and nature of in-hospital adverse events: a systematic review. Qual Saf Health Care. 2008;17(3):216–223. doi:10.1136/qshc.2007.023622
4. Tam VC, Knowles SR, Cornish PL, Fine N, Marchesano R, Etchells EE. Frequency, type and clinical importance of medication history errors at admission to hospital: a systematic review. CMAJ. 2005;173(5):510–515. doi:10.1503/cmaj.045311
5. Van Walraven C, Bennett C, Jennings A, Austin PC, Forster AJ. Proportion of hospital readmissions deemed avoidable: a systematic review. CMAJ. 2011;183(7):E391–E402. doi:10.1503/cmaj.101860
6. Leppin AL, Gionfriddo MR, Kessler M, et al. Preventing 30-day hospital readmissions: a systematic review and meta-analysis of randomized trials. JAMA Intern Med. 2014;174(7):1095–1107. doi:10.1001/jamainternmed.2014.1608
7. Tjarda Van Heek N, Kuhlmann KFD, Scholten RJ, et al. Hospital volume and mortality after pancreatic resection: a systematic review and an evaluation of intervention in The Netherlands. Conference Paper. Ann Surg. 2005;242(6):781–790. doi:10.1097/01.sla.0000188462.00249.36
8. Kristensen PK, Merlo J, Ghith N, Leckie G, Johnsen SP. Hospital differences in mortality rates after Hip fracture surgery in Denmark. Clin Epidemiol. 2019;11:605–614. doi:10.2147/CLEP.S213898
9. Nilsen SM, Bjørngaard JH, Carlsen F, et al. Hospitals´ discharge tendency and risk of death-an analysis of 60,000 Norwegian Hip fracture patients. Clin Epidemiol. 2020;12:173–182. doi:10.2147/CLEP.S237060
10. Krell RW, Girotti ME, Dimick JB. Extended length of stay after surgery: complications, inefficient practice, or sick patients? JAMA Surg. 2014;149(8):815–820. doi:10.1001/jamasurg.2014.629
11. Riedl D, Schüßler G. The influence of doctor-patient communication on health outcomes: a systematic review. Z Psychosom Med Psychother. 2017;63(2):131–150. doi:10.13109/zptm.2017.63.2.131
12. Di Blasi Z, Harkness E, Ernst E, Georgiou A, Kleijnen J. Influence of context effects on health outcomes: a systematic review. Lancet. 2001;357(9258):757–762. doi:10.1016/S0140-6736(00
13. Cabana MD, Slish KK, Evans D, et al. Impact of Physician Asthma Care Education on Patient Outcomes. Health Educ Behav. 2014;41(5):509–517. doi:10.1177/1090198114547510
14. Thomas KB. General practice consultations: is there any point in being positive? Br Med J. 1987;294(6581):1200–1202. doi:10.1136/bmj.294.6581.1200
15. Singh S, Lin YL, Nattinger AB, Kuo YF, Goodwin JS. Variation in readmission rates by emergency departments and emergency department providers caring for patients after discharge. J Hospital Med. 2015;10(11):705–710. doi:10.1002/jhm.2407
16. Alruthia Y, Sales I, Almalag H, et al. The relationship between health-related quality of life and trust in primary care physicians among patients with diabetes. Clin Epidemiol. 2020;12:143–151. doi:10.2147/CLEP.S236952
17. Sperl-Hillen J, Beaton S, Fernandes O, et al. Comparative effectiveness of patient education methods for type 2 diabetes: a randomized controlled trial. Arch Intern Med. 2011;171(22):2001–2010. doi:10.1001/archinternmed.2011.507
18. Walwyn R, Roberts C. Therapist variation within randomised trials of psychotherapy: implications for precision, internal and external validity. Stat Methods Med Res. 2010;19(3):291–315. doi:10.1177/0962280209105017
19. Walwyn R, Roberts C. Meta-analysis of absolute mean differences from randomised trials with treatment-related clustering associated with care providers. Stat Med. 2015;34(6):966–983. doi:10.1002/sim.6379
20. Wampold BE, Imel ZE. The Great Psychotherapy Debate: The Evidence for What Makes Psychotherapy Work: Second Edition. Taylor and Francis Inc; 2015:1–323.
21. Baldwin SA, Imel Z. Therapist effects: findings and methods. Bergin Garfield’s Handbook Psychother Behavior Change. 2013;6:258–297.
22. Anderson BR, Ciarleglio AJ, Cohen DJ, et al. The Norwood operation: relative effects of surgeon and institutional volumes on outcomes and resource utilization. Cardiol Young. 2016;26(4):683–692. doi:10.1017/s1047951115001031
23. Papachristofi O, Klein AA, Mackay J, Nashef S, Fletcher N, Sharples LD. Effect of individual patient risk, centre, surgeon and anaesthetist on length of stay in hospital after cardiac surgery: association of Cardiothoracic Anaesthesia and Critical Care (ACTACC) consecutive cases series study of 10 UK specialist centres. BMJ Open. 2017;7(9):e016947. doi:10.1136/bmjopen-2017-016947
24. Singh S, Sparapani R, Wang MC. Variations in 30-day readmissions and length of stay among spine surgeons: a national study of elective spine surgery among US Medicare beneficiaries. J Neurosurg Spine. 2018;29(3):286–291. doi:10.3171/2018.1.Spine171064
25. Healy MA, Regenbogen SE, Kanters AE, et al. Surgeon variation in complications with minimally invasive and open colectomy: results from the Michigan surgical quality collaborative. JAMA Surg. 2017;152(9):860–867. doi:10.1001/jamasurg.2017.1527
26. Gani F, Lucas DJ, Kim Y, Schneider EB, Pawlik TM. Understanding Variation in 30-Day Surgical Readmission in the Era of Accountable Care: effect of the Patient, Surgeon, and Surgical Subspecialties. JAMA Surg. 2015;150(11):1042–1049. doi:10.1001/jamasurg.2015.2215
27. Thigpen CA, Floyd SB, Chapman C, et al. Comparison of surgeon performance of rotator cuff repair: risk adjustment toward a more accurate performance measure. J Bone Joint Surg Am. 2018;100(24):2110–2117. doi:10.2106/jbjs.18.00211
28. Singh S, Goodwin JS, Zhou J, Kuo YF, Nattinger AB. Variation among primary care physicians in 30-day readmissions. Ann Intern Med. 2019;170(11):749–755. doi:10.7326/m18-2526
29. Kerlin MP, Weissman GE, Wonneberger KA, et al. Validation of administrative definitions of invasive mechanical ventilation across 30 intensive care units. Am J Respir Crit Care Med. 2016;194(12):1548–1552. doi:10.1164/rccm.201605-0953LE
30. Beckett DJ, Spears M, Thomson E. Reliable consultant level data from an Acute Medical Unit: a powerful tool for improvement. J R Coll Physicians Edinb. 2018;48(2):108–113. doi:10.4997/jrcpe.2018.202
31. Harley M, Mohammed MA, Hussain S, Yates J, Almasri A. Was Rodney Ledward a statistical outlier? Retrospective analysis using routine hospital data to identify gynaecologists’ performance. Br Med J. 2005;330(7497):929–932. doi:10.1136/bmj.38377.675440.8F
32. Schnelle C, Clark J, Mascord R, Jones M. Is there a surgeons’ effect on patients’ physical health, beyond the intervention, that requires further investigation?. Ther Clin Risk Manag. 2022;1(18):467–490. doi:10.2147/TCRM.S357934
33. Mbuagbaw L, Lawson DO, Puljak L, Allison DB, Thabane L. A tutorial on methodological studies: the what, when, how and why. BMC Med Res Methodol. 2020;20(1):226. doi:10.1186/s12874-020-01107-7
34. Higgins JPT TJ, Chandler J, Cumpston M, Li T, Page MJ, Welch VA Cochrane Handbook for Systematic Reviews of Interventions version 6.1 (updated September 2020); 2020. Available from: https://training.cochrane.org/cochrane-handbook-systematic-reviews-interventions.
35. Wells GA, Shea B, O’Connell D, et al. The Newcastle-Ottawa Scale (NOS) for Assessing the Quality of Nonrandomised Studies in Meta-Analyses. Oxford; 2000.
36. Stang A. Critical evaluation of the Newcastle-Ottawa scale for the assessment of the quality of nonrandomized studies in meta-analyses. Eur J Epidemiol. 2010;25(9):603–605. doi:10.1007/s10654-010-9491-z
37. Allison PD. Fixed Effects Regression Models. Vol 160. (Quantitative Applications in the Social Sciences. SAGE publications; 2009.
38. Glance LG, Dick AW. In Response. Anesth Analg. 2016;122(5):1722–1727. doi:10.1213/ANE.0000000000001194
39. Papachristofi O, Sharples LD, Mackay JH, Nashef SAM, Fletcher SN, Klein AA. The contribution of the anaesthetist to risk-adjusted mortality after cardiac surgery. Anaesthesia. 2016;71(2):138–146. doi:10.1111/anae.13291
40. Kunadian B, Dunning J, Roberts AP, Morley R, de Belder MA. Funnel plots for comparing performance of PCI performing hospitals and cardiologists: demonstration of utility using the New York hospital mortality data. Catheter Cardiovasc Interv. 2009;73(5):589–594. doi:10.1002/ccd.21893
41. DeLong ER, Peterson ED, DeLong DM, Muhlbaier LH, Hackett S, Mark DB. Comparing risk-adjustment methods for provider profiling. Stat Med. 1997;16(23):2645–2664. doi:10.1002/(SICI)1097-0258(19971215)16:23<2645::
42. Goodwin JS, Lin YL, Singh S, Kuo YF. Variation in length of stay and outcomes among hospitalized patients attributable to hospitals and hospitalists. J Gen Intern Med. 2013;28(3):370–376. doi:10.1007/s11606-012-2255-6
43. Gutacker N, Bloor K, Bojke C, Walshe K. Should interventions to reduce variation in care quality target doctors or hospitals? Health Policy. 2018;122(6):660–666. doi:10.1016/j.healthpol.2018.04.004
44. Glance LG, Kellermann AL, Hannan EL, et al. RETRACTED The impact of anesthesiologists on coronary artery bypass graft surgery outcomes. Anesth Analg. 2015;120(3):526–533. doi:10.1213/ANE.0000000000000522
45. Glance LG, Hannan EL, Fleisher LA, et al. Feasibility of Report Cards for Measuring Anesthesiologist Quality for Cardiac Surgery. Anesth Analg. 2016;122(5):1603–1613. doi:10.1213/ane.0000000000001252
46. Hox JJ. Multilevel Analysis: Techniques and Applications: Second Edition. Routledge Taylor & Francis Group; 2010:1–382.
47. Raudenbush SW, Bryk AS. Hierarchical Linear Models: Applications and Data Analysis Methods. Vol. 1. sage; 2002.
48. Wampold BE. The Great Psychotherapy Debate: Models, Methods, and Findings. Lawrence Erlbaum Associates, Inc; 2001.
49. Kraemer HC, Kupfer DJ. Size of treatment effects and their importance to clinical research and practice. Biol Psychiatry. 2006;59(11):990–996. doi:10.1016/j.biopsych.2005.09.014
50. Cohen J. Statistical Power Analysis for the Behavioral Sciences.
51. Aquina C, Probst C, Hensley B, et al. High variability in nosocomial clostridium difficile infection rates among both surgeons and hospitals following colorectal resection. Conference Abstract. Dis Colon Rectum. 2015;58(5):e163. doi:10.1097/01.dcr.0000464773.42498.34
52. Aquina CT, Blumberg N, Probst CP, et al. Significant variation in blood transfusion practice persists following upper gi cancer resection. J Gastrointest Surg. 2015;19(11):1927–1937. doi:10.1007/s11605-015-2903-3
53. Aquina CT, Blumberg N, Probst CP, et al. Large variation in blood transfusion use after colorectal resection: a call to action. Dis Colon Rectum. 2016;59(5):411–418. doi:10.1097/dcr.0000000000000588
54. Aquina CT, Fleming FJ, Becerra AZ, et al. Explaining variation in ventral and inguinal hernia repair outcomes: a population-based analysis. Surgery. 2017;162(3):628–639. doi:10.1016/j.surg.2017.03.013
55. Arvidsson D, Berndsen FH, Larsson LG, et al. Randomized clinical trial comparing 5-year recurrence rate after laparoscopic versus Shouldice repair of primary inguinal hernia. Br J Surg. 2005;92(9):1085–1091. doi:10.1002/bjs.5137
56. Becerra AZ, Aquina CT, Berho M, et al. Surgeon-, pathologist-, and hospital-level variation in suboptimal lymph node examination after colectomy: compartmentalizing quality improvement strategies. Surgery. 2017;161(5):1299–1306. doi:10.1016/j.surg.2016.11.029
57. Begg CB, Riedel ER, Bach PB, et al. Variations in morbidity after radical prostatectomy. N Eng J Med. 2002;346(15):1138–1144. doi:10.1056/NEJMsa011788
58. Bianco FJ, Riedel ER, Begg CB, Kattan MW, Scardino PT. Variations among high volume surgeons in the rate of complications after radical prostatectomy: further evidence that technique matters. J Urol. 2005;173(6):2099–2103. doi:10.1097/01.ju.0000158163.21079.66
59. Bianco JFJ, Vickers AJ, Cronin AM, et al. Variations among experienced surgeons in cancer control after open radical prostatectomy. J Urol. 2010;183(3):977–983. doi:10.1016/j.juro.2009.11.015
60. Bolling SF, Li S, O’Brien SM, Brennan JM, Prager RL, Gammie JS. Predictors of mitral valve repair: clinical and surgeon factors. Ann Thoracic Surgery. 2010;90(6):1904–1911. doi:10.1016/j.athoracsur.2010.07.062
61. Bridgewater B, Grayson AD, Jackson M, et al. Surgeon specific mortality in adult cardiac surgery: comparison between crude and risk stratified data. BMJ. 2003;327(7405):13–17. doi:10.1136/bmj.327.7405.13
62. Bridgewater B. Mortality data in adult cardiac surgery for named surgeons: retrospective examination of prospectively collected data on coronary artery surgery and aortic valve replacement. Br Med J. 2005;330(7490):506–510. doi:10.1136/bmj.330.7490.506
63. Brown EC, Robicsek A, Billings LK, et al. Evaluating Primary Care Physician Performance in Diabetes Glucose Control. Am J Med Qual. 2016;31(5):392–399. doi:10.1177/1062860615585138
64. Burns EM, Bottle A, Aylin P, Darzi A, John Nicholls R, Faiz O. Variation in reoperation after colorectal surgery in England as an indicator of surgical performance: retrospective analysis of Hospital Episode Statistics. BMJ. 2011;343(7820):d4836. doi:10.1136/bmj.d4836
65. Cirillo F, Patrizio P, Baccini M, et al. The human factor: does the operator performing the embryo transfer significantly impact the cycle outcome? Human Reproduction. 2020;35(2):275–282. doi:10.1093/humrep/dez290
66. Cromwell D, Hilton P. Retrospective cohort study on patterns of care and outcomes of surgical treatment for lower urinary-genital tract fistula among English National Health Service hospitals between 2000 and 2009. BJU Int. 2013;111(4 B):E257–E262. doi:10.1111/j.1464-410X.2012.11483.x
67. Dagenais J, Bertolo R, Garisto J, et al. Variability in Partial Nephrectomy Outcomes: does Your Surgeon Matter? Eur Urol. 2019;75(4):628–634. doi:10.1016/j.eururo.2018.10.046
68. Davenport MS, Khalatbari S, Keshavarzi N, et al. Differences in Outcomes Associated With Individual Radiologists for Emergency Department Patients With Headache Imaged With CT: a Retrospective Cohort Study of 25,596 Patients. AJR Am J Roentgenol. 2020:1–8. doi:10.2214/ajr.19.22189
69. Duclos A, Peix JL, Colin C, et al. Influence of experience on performance of individual surgeons in thyroid surgery: prospective cross sectional multicentre study. BMJ. 2012;344(7843):d8041. doi:10.1136/bmj.d8041
70. Eastham JA, Kattan MW, Riedel E, et al. Variations among individual surgeons in the rate of positive surgical margins in radical prostatectomy specimens. J Urol. 2003;170(6):
71. Eijkenaar F, van Vliet RC. Profiling individual physicians using administrative data from a single insurer: variance components, reliability, and implications for performance improvement efforts. Med Care. 2013;51(8):731–739. doi:10.1097/MLR.0b013e3182992bc1
72. Eklund AS, Montgomery AK, Rasmussen IC, Sandbue RP, Bergkvist LÅ, Rudberg CR. Low Recurrence Rate After Laparoscopic (TEP) and Open (Lichtenstein) Inguinal Hernia Repair: a Randomized, Multicenter Trial With 5-Year Follow-Up. Ann Surg. 2009;249(1):33–38. doi:10.1097/SLA.0b013e31819255d0
73. Faschinger C. Quality assessment of cataract surgery of the Department of Ophthalmology, Medical University of Graz. Spektrum Augenheilkd. 2011;25(3):215–219. doi:10.1007/s00717-011-0013-5
74. Fountain J, Gallagher J, Brown J. A practical approach to a multi-level analysis with a sparse binary outcome within a large surgical trial. J Eval Clin Pract. 2004;10(2):323–327. doi:10.1111/j.1365-2753.2003.00462.x
75. Glance LG, Dick A, Osler TM, Li Y, Mukamel DB. Impact of changing the statistical methodology on hospital and surgeon ranking: the case of the New York State cardiac surgery report card. Med Care. 2006;44(4):311–319. doi:10.1097/01.mlr.0000204106.64619.2a
76. Gossl M, Rihal CS, Lennon RJ, Singh M. Assessment of individual operator performance using a risk-adjustment model for percutaneous coronary interventions. Mayo Clin Proc. 2013;88(11):1250–1258. doi:10.1016/j.mayocp.2013.07.017
77. Grant SW, Grayson AD, Jackson M, et al. Does the choice of risk-adjustment model influence the outcome of surgeon-specific mortality analysis? A retrospective analysis of 14 637 patients under 31 surgeons. Heart. 2008;94(8):1044–1049. doi:10.1136/hrt.2006.110478
78. Hannan EL, Zhong Y, Jacobs AK, et al. Incomplete revascularization for percutaneous coronary interventions: variation among operators, and association with operator and hospital characteristics. Am Heart J. 2017;186:118–126. doi:10.1016/j.ahj.2017.01.015
79. Hermanek P. Impact of surgeon’s technique on outcome after treatment of rectal carcinoma. Dis Colon Rectum. 1999;42(5):559–562. doi:10.1007/bf02234128
80. Hermann M, Alk G, Roka R, Glaser K, Freissmuth M. Laryngeal recurrent nerve injury in surgery for benign thyroid diseases: effect of nerve dissection and impact of individual surgeon in more than 27,000 nerves at risk. Ann Surg. 2002;235(2):261–268. doi:10.1097/00000658-200202000-00015
81. Hofer TP, Hayward RA, Greenfield S, Wagner EH, Kaplan SH, Manning WG. The unreliability of individual physician ‘report cards’ for assessing the costs and quality of care of a chronic disease. J Am Med Assoc. 1999;281(22):2098–2105. doi:10.1001/jama.281.22.2098
82. Hoffman RL, Kelz RR, Wirtalla CJ, et al. Variations in surgical outcomes: is it the residency program, the surgeon or the practice venue? Conference Abstract. J Am Coll Surg. 2017;225(4):S185.
83. Holmboe ES, Weng W, Arnold GK, et al. The comprehensive care project: measuring physician performance in ambulatory practice. Health Serv Res. 2010;45(6 Pt 2):1912–1933. doi:10.1111/j.1475-6773.2010.01160.x
84. Huesch MD. Can managed care plans reliably infer the quality of cardiac surgeons’ outcomes? Am J Manag Care. Dec. 2009;15(12):890–896.
85. Hyder O, Dodson RM, Nathan H, et al. Influence of patient, physician, and hospital factors on 30-day readmission following pancreatoduodenectomy in the United States. JAMA Surg. 2013;148(12):1095–1102. doi:10.1001/jamasurg.2013.2509
86. Jemt T, Olsson M, Renouard F, Stenport V, Friberg B. Early Implant Failures Related to Individual Surgeons: an Analysis Covering 11,074 Operations Performed during 28 Years. Clin Implant Dent Relat Res. 2016;18(5):861–872. doi:10.1111/cid.12379
87. Johnston RL, Taylor H, Smith R, Sparrow JM. The Cataract National Dataset electronic multi-centre audit of 55,567 operations: variation in posterior capsule rupture rates between surgeons. Eye. 2010;24(5):888–893. doi:10.1038/eye.2009.195
88. Justiniano CF, Aquina CT, Fleming FJ, et al. Hospital and surgeon variation in positive circumferential resection margin among rectal cancer patients. Am J Surg. 2019;218(5):881–886. doi:10.1016/j.amjsurg.2019.02.029
89. Kaczmarski K, Wang P, Gilmore R, et al. Surgeon re-excision rates after breast-conserving surgery: a measure of low-value care. J Am Coll Surg. 2019;228(4):504–512.e2. doi:10.1016/j.jamcollsurg.2018.12.043
90. Kaplan SH, Griffith JL, Price LL, Pawlson LG, Greenfield S. Improving the reliability of physician performance assessment: identifying the “physician effect” on quality and creating composite measures. Med Care. 2009;47(4):378–387. doi:10.1097/MLR.0b013e31818dce07
91. Prasad-Kerlin MP, Epstein A, Kahn JM, et al. Physician-level variation in outcomes of mechanically ventilated patients. Ann Am Thorac Soc. 2018;15(3):371–379. doi:10.1513/AnnalsATS.201711-867OC
92. Kissenberth M, Thigpen C, Brooks J, Floyd S, Hawkins RJ, Tokish JM. Comparing surgeon performance of rotator cuff repair: risk adjustment toward a fair performance measure. Arthroscopy J Arthroscopic Related Surgery. 2018;34(12):e3. doi:10.1016/j.arthro.2018.10.022
93. Krein SL, Hofer TP, Kerr EA, Hayward RA. Whom should we profile? Examining diabetes care practice variation among primary care providers, provider groups, and health care facilities. Health Serv Res. 2002;37(5):1159–1180. doi:10.1111/1475-6773.01102
94. Landercasper J, Borgert AJ, Fayanju OM, et al. Factors associated with reoperation in breast-conserving surgery for cancer: a prospective study of American society of breast surgeon members. Ann Surg Oncol. 2019;26(10):3321–3336. doi:10.1245/s10434-019-07547-w
95. LaPar DJ, Ailawadi G, Isbell JM, et al. Mitral valve repair rates correlate with surgeon and institutional experience. J Thorac Cardiovasc Surg. 2014;148(3):995–1003. doi:10.1016/j.jtcvs.2014.06.039
96. Likosky DS, Goldberg JB, DiScipio AW, et al. Variability in surgeons’ perioperative practices may influence the incidence of low-output failure after coronary artery bypass grafting surgery. Circ Cardiovasc Qual Outcomes. 2012;5(5):638–644. doi:10.1161/circoutcomes.112.967091
97. Luan WP, Leroux TC, Olsen C, Robb D, Skinner JS, Richard P. Variation in bariatric surgery costs and complication rates in the military health system. Mil Med. 2019. doi:10.1093/milmed/usz454
98. Martin BI, Mirza SK, Franklin GM, Lurie JD, MacKenzie TA, Deyo RA. Hospital and surgeon variation in complications and repeat surgery following incident lumbar fusion for common degenerative diagnoses. Health Serv Res. 2013;48(1):1–25. doi:10.1111/j.1475-6773.2012.01434.x
99. McCahill LE, Single RM, Aiello Bowles EJ, et al. Variability in reexcision following breast conservation surgery. JAMA. 2012;307(5):467–475. doi:10.1001/jama.2012.43
100. Navar-Boggan AM, Boggan JC, Stafford JA, Muhlbaier LH, McCarver C, Peterson ED. Hypertension control among patients followed by cardiologists. Circ Cardiovasc Qual Outcomes. 2012;5(3):352–357. doi:10.1161/circoutcomes.111.963488
101. O’Connor PJ, Rush WA, Davidson G, et al. Variation in quality of diabetes care at the levels of patient, physician, and clinic. Prev Chronic Dis. 2008;5(1):A15.
102. Orueta JF, Garcia-Alvarez A, Grandes G, Nuno-Solinis R. The origin of variation in primary care process and outcome indicators: patients, professionals, centers, and health districts. Medicine. 2015;94(31):e1314. doi:10.1097/md.0000000000001314
103. Papachristofi O, Mackay JH, Powell SJ, Nashef SAM, Sharples L. Impact of the anesthesiologist and surgeon on cardiac surgical outcomes. J Cardiothorac Vasc Anesth. 2014;28(1):103–109. doi:10.1053/j.jvca.2013.07.004
104. Quinn CM, Bilimoria KY, Chung JW, Ko CY, Cohen ME, Stulberg JJ. Creating individual surgeon performance assessments in a statewide hospital surgical quality improvement collaborative. J Am Coll Surg. 2018;227(3):303–312.e3. doi:10.1016/j.jamcollsurg.2018.06.002
105. Rudmik L, Xu Y, Alt JA, et al. Evaluating surgeon-specific performance for endoscopic sinus surgery. JAMA Otolaryngol Head Neck Surg. 2017;143(9):891–898. doi:10.1001/jamaoto.2017.0752
106. Selby JV, Schmittdiel JA, Lee J, et al. Meaningful variation in performance: what does variation in quality tell us about improving quality? Med Care. 2010;48(2):133–139. doi:10.1097/MLR.0b013e3181c15a6e
107. Shih T, Cole AI, Al-Attar PM, et al. Reliability of surgeon-specific reporting of complications after colectomy. Ann Surg. 2015;261(5):920–925. doi:10.1097/sla.0000000000001032
108. Tuerk PW, Mueller M, Egede LE. Estimating physician effects on glycemic control in the treatment of diabetes. Diabetes Care. 2008;31(5):869–873. doi:10.2337/dc07-1662
109. Udyavar R, Cornwell EE, Havens JM, et al. Surgeon-driven variability in emergency general surgery outcomes: does it matter who is on call? Surgery. 2018;164(5):1109–1116. doi:10.1016/j.surg.2018.07.008
110. Udyavar NR, Salim A, Havens JM, et al. The impact of individual physicians on outcomes after trauma: is it the system or the surgeon? J Surg Res. 2018;229:51–57. doi:10.1016/j.jss.2018.02.051
111. Udyavar NR, Salim A, Cornwell EE, et al. Racial differences in complication risk following emergency general surgery: who your surgeon is may matter. J Surg Res. 2019;235:424–431. doi:10.1016/j.jss.2018.05.086
112. Verma AA, Guo Y, Jung HY, et al. Physician-level variation in clinical outcomes and resource use in inpatient general internal medicine: an observational study. BMJ Qual Saf. 2020. doi:10.1136/bmjqs-2019-010425
113. Xu T, Makary MA, Al Kazzi E, Zhou M, Pawlik TM, Hutfless SM. Surgeon-level variation in postoperative complications. J Gastrointest Surg. 2016;20(7):1393–1399. doi:10.1007/s11605-016-3139-6
114. Xu T, Mehta A, Park A, Makary MA, Price DW. Association Between Board Certification, Maintenance of Certification, and Surgical Complications in the United States. Am J Med Qual. 2019;34(6):545–552. doi:10.1177/1062860618822752
115. Ukoumunne OC. A comparison of confidence interval methods for the intraclass correlation coefficient in cluster randomized trials. Stat Med. 2002;21(24):3757–3774. doi:10.1002/sim.1330
116. Carpenter J, Bithell J. Bootstrap confidence intervals: when, which, what? A practical guide for medical statisticians. Stat Med. 2000;19(9):1141–1164. doi:10.1002/(SICI)1097-0258(20000515)19:9<1141::
117. KI Shine. Percutaneous Coronary Interventions (PCI) in New York State 2002-2004. New York State Department of Health; 2006.
 © 2022 The Author(s). This work is published and licensed by Dove Medical Press Limited. The
full terms of this license are available at https://www.dovepress.com/terms
and incorporate the Creative Commons Attribution
- Non Commercial (unported, 3.0) License.
By accessing the work you hereby accept the Terms. Non-commercial uses of the work are permitted
without any further permission from Dove Medical Press Limited, provided the work is properly
attributed. For permission for commercial use of this work, please see paragraphs 4.2 and 5 of our Terms.
© 2022 The Author(s). This work is published and licensed by Dove Medical Press Limited. The
full terms of this license are available at https://www.dovepress.com/terms
and incorporate the Creative Commons Attribution
- Non Commercial (unported, 3.0) License.
By accessing the work you hereby accept the Terms. Non-commercial uses of the work are permitted
without any further permission from Dove Medical Press Limited, provided the work is properly
attributed. For permission for commercial use of this work, please see paragraphs 4.2 and 5 of our Terms.