")
Back to Journals » ClinicoEconomics and Outcomes Research » Volume 7
The costs of fluid overload in the adult intensive care unit: is a small-volume infusion model a proactive solution?
Authors Child D, Cao Z, Seiberlich L, Brown H, Greenberg J, Swanson A, Sewall M, Robinson S
Received 16 August 2014
Accepted for publication 10 October 2014
Published 15 December 2014 Volume 2015:7 Pages 1—8
DOI https://doi.org/10.2147/CEOR.S72776
Checked for plagiarism Yes
Review by Single anonymous peer review
Peer reviewer comments 3
Editor who approved publication: Professor Giorgio L Colombo
Debra L Child,1 Zhun Cao,2 Laura E Seiberlich,1 Harold Brown,2 Jordan Greenberg,1 Anne Swanson,1 Martha R Sewall,1 Scott B Robinson,2
1Smiths Medical, ASD, Inc., St Paul, MN, USA; 2Premier Inc., Charlotte, NC, USA
Purpose: Fluid overload (FO) in critically ill patients remains a challenging clinical dilemma, and many continuous intravenous (IV) medications in the US are being delivered as a dilute solution, adding significantly to a patient's daily intake. This study describes the costs and outcomes of FO in patients receiving multiple continuous infusions.
Materials and methods: A retrospective study was conducted using a hospital administrative database covering >500 US hospitals. An FO cohort included adult intensive care unit (ICU) patients with a central line receiving IV loop diuretics and 2+ continuous IV infusions on 50%+ of their ICU days; a directly matched non-FO cohort included patients without IV diuretic use. The primary outcome of the study was total hospitalization costs per visit. Additional outcomes were ICU costs, mortality, total and ICU length of stay (LOS), 30-day readmission rates, and ventilator use. Unadjusted descriptive analysis was performed using chi-squared or paired t-tests to compare outcomes between the two cohorts.
Results: A total of 63,974 patients were identified in each cohort. The total hospitalization cost per visit for the FO cohort was US$15,344 higher than the non-FO cohort (US$42,386 vs US$27,042), and the ICU cost for the FO cohort was US$5,243 higher than the non-FO cohort (US$10,902 vs US$5,659). FO patients had higher mortality (20% vs 16.8%), prolonged LOS (11.5 vs 8.0 days), longer ICU LOS (6.2 vs 3.6 days), higher risk of 30-day readmission (21.8% vs 21.3%), and ventilator usage (47.7% vs 28.3%) than the non-FO cohort (all P<0.05).
Conclusion: In patients receiving multiple continuous infusions, FO is associated with increased health care resources and costs. Maximally concentrating medications and proactively providing continuous medications in small-volume infusions (SVI) could be a potential solution to prevent iatrogenic FO in critically ill patients. Further prospective research is warranted to assess the impact of the SVI dispensing model on patient outcomes and health care costs.
Keywords: intensive care unit, conservative fluid management, hospital cost, length of stay
Introduction
Limited information regarding the relationship between medication administration and fluid balance appears within clinical literature; however, the importance of fluid balance and the prevention of fluid overload (FO) in many disease states remains a prevalent discussion both clinically and economically.1–19 Fluid restriction via enhanced recovery after surgery (ERAS) or other similar initiatives is considered safe and effective and reported to decrease postoperative complications and hospital length of stay (LOS).1,2,5,8,15,20 In 2005, Brouse et al demonstrated an intensive care unit (ICU) LOS increase of 3.1 days in heart failure patients receiving >1.25 L of fluid per day compared to patients receiving <1.25 L daily.7 Magee and Zbrozek reported similar clinical findings for transfusion-associated FO and demonstrated an adjusted incremental hospital cost of US$14,062 per visit compared to the non-FO patients, concluding that the incidence of FO is underreported, albeit substantial.21
Once diagnosed, FO is treated with diuretics or costly mechanical fluid removal methods such as dialysis or ultrafiltration.18,20,22 Intravenous (IV) loop diuretics are the mainstay of treatment, yet diuretics are associated with numerous complications, most notably renal failure and/or electrolyte disturbances that can lead to cardiac arrhythmias and sudden death.23–25 The replacement of essential electrolytes is also not without risk of serious side effects and further iatrogenic FO.26
To minimize the concern of FO and prevent this vicious treatment cycle, proactive conservative fluid management is recommended.1–5,8,18–20,27 Various techniques exist, but each involves restricting IV fluid volume administered to patients. However, particularly in the US, critical infusions are commonly delivered to adult patients using dilute solutions and a large volume pump. Large-volume drug infusions can significantly contribute to a patient’s daily fluid intake and impose a risk of FO.18
One therapeutic option to achieve conservative fluid management is predicated on the administration of maximally concentrated medications via syringe pump, also known as small-volume infusion (SVI). The SVI delivery method is widely used outside the US, in countries such as the UK, as the main method for adult IV medication administration for drugs with a short half-life or narrow therapeutic margin.28 However, in the US, delivering maximally concentrated continuous medications as standard of care in adult areas is generally limited or only implemented once patients have entered the cycle of FO and diuresis.
While literature on the benefit of conservative fluid management is abundant, there has been little study examining the clinical or economic impacts of iatrogenic FO. Therefore, as an initial step, a retrospective descriptive study was conducted using a large hospital administrative database to describe an FO patient population in the adult ICU that was receiving multiple continuous infusions. The intent was to estimate health care costs and utilization of an FO cohort compared to a non-FO cohort and better understand the potential benefits of conservative fluid management, such as the delivery of concentrated medications.
Materials and methods
Premier database
Data for the study were derived from the Premier Research Database (Premier, Inc., Charlotte, NC, USA). The database is the largest US hospital clinical and economic database, and contains data from more than 445 million patient encounters across 581 hospitals, representing approximately one in every five discharges in the US. It contains data from hospital discharge files, including a patient’s demographics and diagnoses, all services billed while at a hospital, such as medications charged as administered, and all procedures performed. Drug utilization information was available by day of stay and included quantity, dosing, strength used, and cost; however, the database did not include clinical information such as dilutions performed by the hospital pharmacy or amounts received by the patient. Information on hospital characteristics, including geographic location, bed size, and type (eg, community, academic) were also obtained.
Patient identification and selection criteria
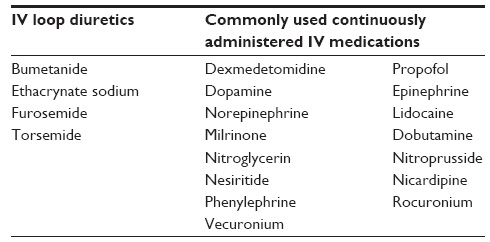
A cohort of adult ICU patients with FO were defined using the following criteria: 1) at least 18 years at admission, 2) an ICU visit occurring between January 1, 2010 and December 31, 2012, 3) the use of at least one IV loop diuretic (Table 1) on at least 50% of ICU days, 4) a central line in place, and 5) the use of at least two commonly used continuously administered IV drugs on at least 50% of ICU days (Table 1). When a patient had more than one discharge during the study window that met the inclusion criteria, the earliest discharge was retained as the index discharge for the study.
In addition, a cohort of non-FO patients was identified that matched the FO cohort inclusion criteria but did not have any IV diuretic use during the ICU stay. Patients in the FO cohort were directly matched 1:1 to the non-FO cohort on: 1) age group, 2) sex, 3) Major Diagnosis Categories (MDCs), and 4) patient severity as measured by Charlson comorbidity index (CCI)29 categories. Only the patients in the matched FO and non-FO cohorts were included in the study analysis.
 | Table 1 Study infusions and diuretics |
Outcomes
The primary outcome for the study was total hospital cost per visit as reported by the hospital, and a secondary outcome was ICU cost. The cost data were extracted and summed from the hospital billing records, while the ICU cost calculation was based upon line items associated with an ICU departmental code. Additional secondary outcomes included hospital LOS, ICU LOS, inpatient mortality, readmissions, number of days on a ventilator per visit, and prevalence of the complications ventilator-associated pneumonia (VAP; International Classification of Diseases, Ninth Revision, Clinical Modification [ICD-9 CM] Diagnosis 997.31), central line-acquired bloodstream infection (CLABSI; ICD-9-CM Diagnosis 999.31), and Clostridium difficile (C. diff; ICD-9 CM Diagnosis 008.45).
Statistical analysis
Unadjusted descriptive statistics were used to characterize the patients meeting the selection criteria. Data measured on a continuous scale were expressed as mean and standard deviation. Since some continuous variables such as costs, LOS, and number of days on ventilation did not follow a normal distribution, median and interquartile range (IQR) were reported for those variables as well. Categorical data were expressed as counts and percentages of patients within the categories. Bivariate analysis was performed to compare variables between the FO and non-FO groups. Paired t-tests were performed to test for determination of statistical differences in continuous variables as appropriate. Chi-squared tests were used to test for statistical differences in categorical variables. Statistical analysis was performed using SAS statistical software (v9.2; SAS Institute Inc., Cary, NC, USA).
Results
There were 64,132 patients with FO evidenced by the use of IV loop diuretics, and 131,223 met the comparison cohort definition. After the 1:1 direct match, 63,974 patients remained in each of the two cohorts. The patient attrition is depicted in Figure 1.
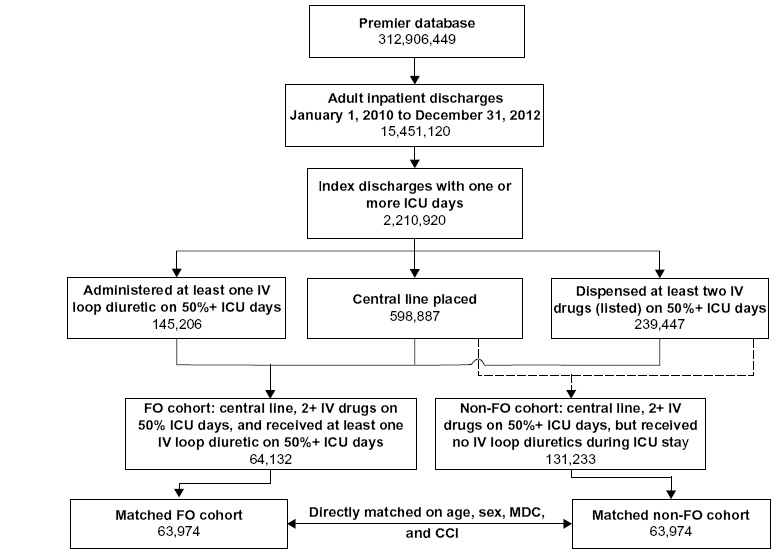 | Figure 1 Patient attrition for the FO and non-FO cohorts. |
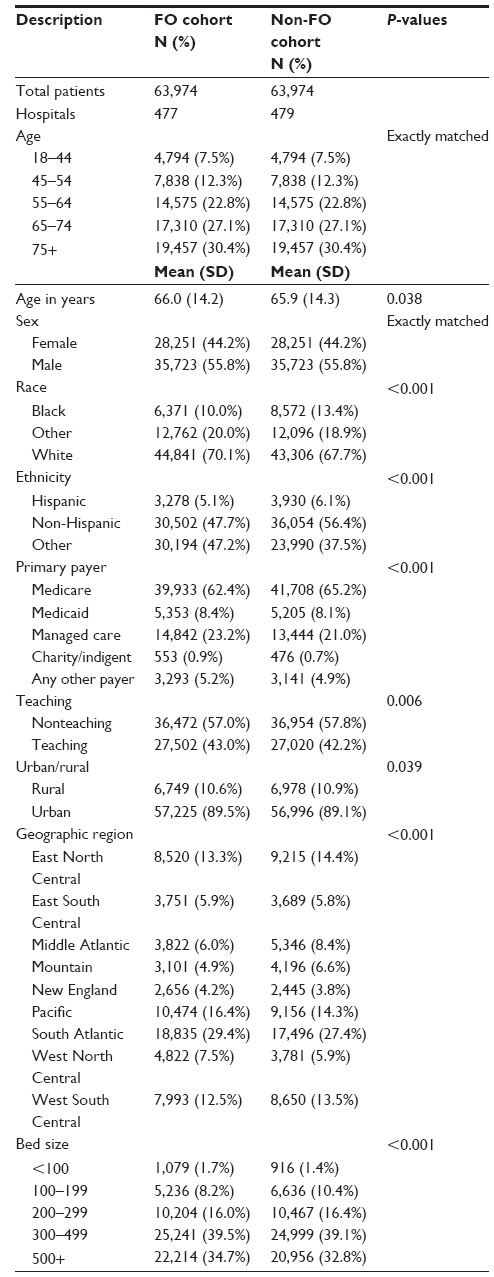
Demographic and hospital characteristics for the FO and non-FO cohorts are reported in Table 2. The majority of the patients were elderly with a mean age of 66 years; therefore, Medicare was the largest primary payer (62.4% and 65.2%, respectively). The majority of the FO cohort was identified from hospitals that were non-teaching (57.0%), located in an urban area (89.5%), and from hospitals with >300 beds (74.2%). Similarly, the non-FO cohort was also primarily identified from non-teaching hospitals (57.8%), urban areas (89.1%), and from hospitals with >300 beds (71.9%). Although the distribution of age categories, sex, CCI categories, and MDCs of the non-FO cohort were matched exactly to the FO cohort, there were still differences in the distribution of race, ethnicity, and hospital characteristics.
 | Table 2 Demographics and hospital characteristics of the matched FO and non-FO cohorts |
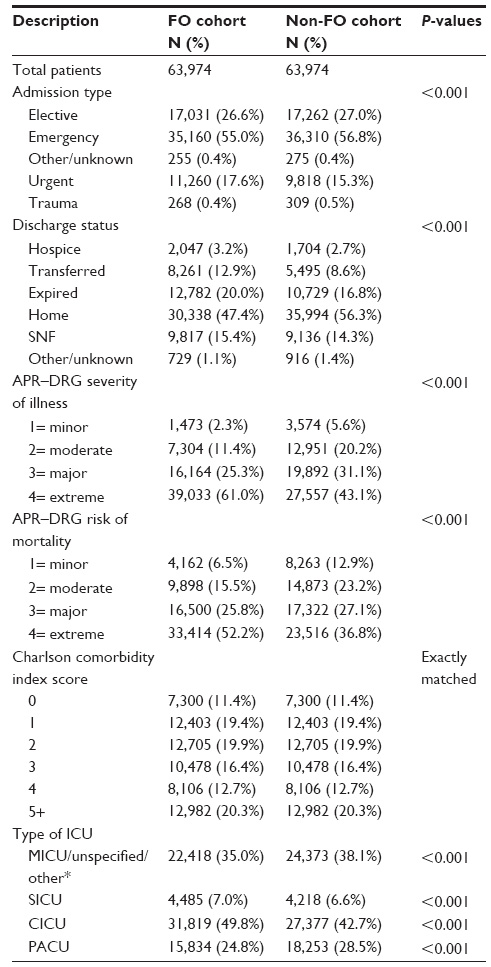
Table 3 presents the distribution of clinical characteristics. The FO patients were less likely to be discharged home, were more severe as measured by all patient refined–diagnosis-related group (APR–DRG) severity,30 and had higher risk of mortality compared to the non-FO cohort. In addition, the FO patients had more IV potassium chloride use than the non-FO patients (29.0 vs 18.4%, P<0.001; Table 4) and were more likely to be treated in cardiac ICUs (49.8% vs 42.7%, P<0.001). While specific diagnoses varied, 94.4% of the FO patients and 91.2% of non-FO patients had a cardiac-related discharge diagnosis during their hospitalizations.
 | Table 3 Clinical characteristics of the matched FO and non-FO cohorts |
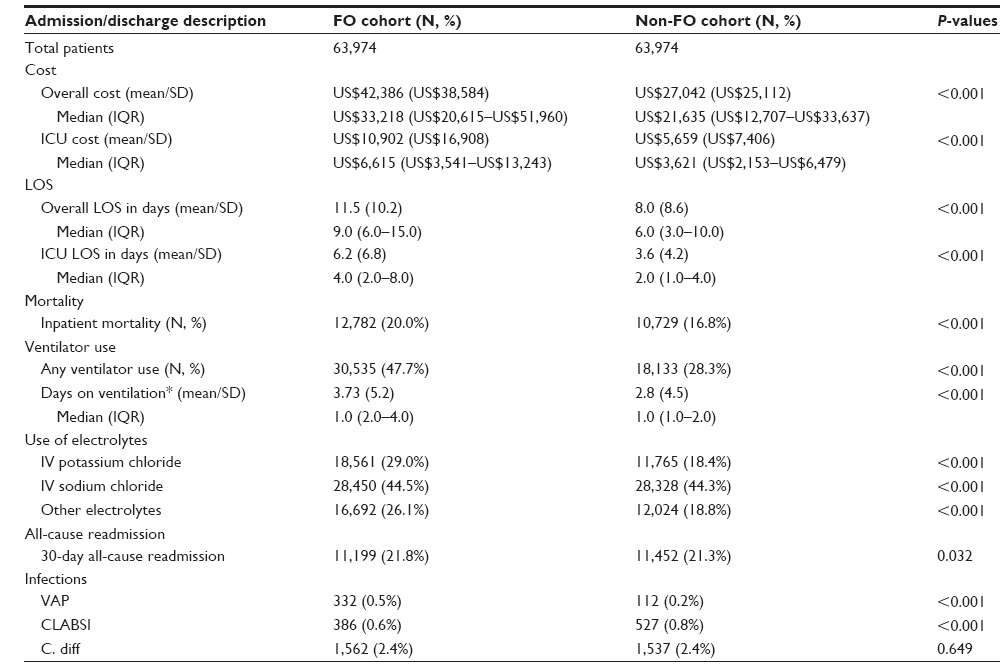 | Table 4 Outcomes of the matched FO and non-FO cohorts |
The unadjusted descriptive statistics of the outcomes are reported in Table 4. The average total hospital cost per visit of the FO cohort was US$15,344, or 56.7% higher, than that of the non-FO cohort (US$42,386 vs US$27,042, P<0.001). In particular, the average ICU cost per FO visit (US$10,902) was almost twice as much as the average ICU cost per non-FO visit (US$5,659, P<0.001). The overall and ICU LOS were also longer in the FO cohort as compared to the non-FO cohort (overall LOS: 11.5 days vs 8.0 days, ICU LOS: 6.2 days vs 3.6 days, P<0.001).
As shown in Table 4, the FO cohort had a significantly higher inpatient mortality rate than the non-FO patients (20.0% vs 16.8%, P<0.001). FO patients were also more likely to use ventilators during their stay (47.7% vs 28.3%, P<0.001). Among those with ventilator use, FO patients spent more days on a ventilator on average than non-FO patients (3.7 days vs 2.8 days, P<0.001).
Additional secondary outcomes were compared between the two cohorts, such as 30-day readmission rates, days to readmission, and prevalence of complications (data not shown). The 30-day readmission rate in the FO cohort (21.8%) was higher than the non-FO patients (21.3%, P=0.032). Furthermore, among those with readmission, the patients in the non-FO cohort had readmissions 3.5 days later compared to FO patients (30.5 days vs 34.0, respectively, P<0.001).
Discussion
Optimal fluid management remains a key issue in the treatment of patients from the surgical realm to the ICU. Programs such as ERAS and early goal-directed therapy (EGDT) demonstrate the benefits of conservative fluid management.1,2,4,15,20,31 Specifically, Hübner et al reported both decreased patient morbidity postoperatively and a shorter mean hospital LOS of 5 days versus 9 days (P<0.001) through the judicious use of fluids and careful prescription of vasopressors in an ERAS setting.1 Other trials demonstrate significantly decreased postoperative complication rates and no increased patient harm using restrictive perioperative fluids.8,14
The high costs of FO exhibited in both the current study and others highlight the importance of conservative fluid management in all areas of fluid delivery, including medications. Because all patients within the study were receiving at least two continuous infusions on at least half of their ICU days, medication administration was included as a part of their daily fluid intake. One potential approach to implement proactive conservative fluid management is to shift from dilute solutions to the SVI model. Due to the continuity of flow of syringe-driven pumps compared to pumps with a peristaltic delivery mechanism, syringe pumps can accurately deliver IV medications in small volumes and achieve a constant blood concentration of the drug.26 This model will allow medical providers to further conservative fluid management efforts, thereby decreasing the risk of FO and potentially helping to reduce health care costs.
The medications patients received in this study were selected under the assumption that the drugs were being delivered continuously in dilute solutions, and thus would be appropriate for delivery by an SVI model. Using maximal concentrations described in literature, for example, as much as 1,012 mL of fluid per day could be saved for an 80 kg patient continuously receiving norepinephrine at an average dose of 15 μg/minute.32,33 Additional medications not delivered continuously, such as antibiotics, could also have the ability to be concentrated to further decrease a patient’s fluid intake, allowing clinicians to focus on nutrition and maintaining a patient’s fluid balance.
Although this study did not directly examine the effect of concentrated medication delivery on health care costs, it demonstrated that an FO group receiving continuous infusions was associated with prolonged hospital stay, higher costs, and higher mortality in ICU patients using a large US hospital database. In a 3-year period, the 63,974 FO patients cost US$984 million (M) more than the non-FO patients, or US$328 M annually for the 477 hospitals included in the study. If implementation of the SVI model could have prevented even a portion of the patients from experiencing FO, there would be significant savings in health care costs. These findings were consistent with previous studies that examined the effects of FO in patients with specific diseases such as acute decompensated heart failure, acute kidney injury, or patients receiving fresh frozen plasma.5,7,21 Moreover, this study included patients in all disease states who were treated in hospital ICUs, showing evidence that FO can affect patients with a wide range of diseases, and that improvement in fluid management practices could have a positive effect hospital-wide on both clinical and economic outcomes.
However, this study is limited in several aspects. The definition of FO was based on the evidence of IV loop diuretic use during 50% or more ICU days, which should be clinically validated. As the database was charge-based, many clinical indicators such as laboratory values, patient weights, and fluid intake/output were not available. The fluid volume information was also not complete in the hospital billing records; therefore, examination was not possible for the specific volume of fluid for every patient in the study. As such, a clear distinction between general FO and iatrogenic-induced FO cannot be made.
As in all retrospective observational studies, the patients in the FO cohort and non-FO cohort were not randomly assigned; therefore, there is a potential bias due to the difference in patients’ severity and unmeasured confounders. Although direct matching was performed using patients’ age group, sex, and MDC and CCI categories, an unadjusted descriptive analysis was conducted in the study that did not include additional adjustments for potential selection bias or confounding. Therefore, estimates described may be either over- or under-estimated because the two cohorts differed on characteristics that were not statistically controlled, but still provides an overview of FO patients compared to non-FO patients. These data do not establish a causal relationship between FO and increased costs and LOS, only an association. The difference observed may entirely be due to the critical illness of the patients and the burden of the ICU stay.
Finally, as only a limited list of commonly used IV medications was included in the study, all patients with potential iatrogenic FO may not have been captured. Many other drugs are available and the use varies based upon hospital formulary, availability, and physician preference.
Conclusion
This study serves as an initial attempt to characterize patients with FO who are receiving multiple continuous infusions and the associated economic burden placed on the US health care system. The findings of the study are hypothesis-generating, and further research is warranted to assess the impact of medication delivery on FO. As a next step, a prospective study comparing critically ill adult patients receiving standard of care infusions to those receiving maximally concentrated medications could directly examine the effect of a small-volume infusion model on clinical and economic outcomes.
Acknowledgment
The authors would like to thank Elizabeth Behringer, MD, for her review and commentary on the manuscript.
Disclosure
This study was supported by Smiths Medical, ASD, Inc., and the authors Debra Child, Laura Seiberlich, Jordan Greenberg, Anne Swanson, and Martha Sewall are employees of the company. Zhun Cao, Scott Robinson, and Harold Brown are employees of Premier Research Services, which received funding from Smiths Medical to conduct this analysis. The authors report no other conflicts of interest in this work.
References
Hübner M, Schäfer M, Demartines N, et al; Zurich Fast Track Study Group. Impact of restrictive intravenous fluid replacement and combined epidural analgesia on perioperative volume balance and renal function within a Fast Track program. J Surg Res. 2012;173(1):68–74. | |
Adesanya A, Rosero E, Timaran C, Clagett P, Johnston WE. Intraoperative fluid restriction predicts improved outcomes in major vascular surgery. Vasc Endovascular Surg. 2008;42(6):531–536. | |
Lobo DN, Bostock KA, Neal KR, Perkins AC, Rowlands BJ, Allison SP. Effect of salt and water balance on recovery of gastrointestinal function after elective colonic resection: a randomised controlled trial. Lancet. 2002;359(9320):1812–1818. | |
Schrier RW. Fluid administration in critically ill patients with acute kidney injury. Clin J Am Soc Nephrol. 2010;5(4):733–739. | |
National Heart, Lung, and Blood Institute Acute Respiratory Distress Syndrome (ARDS) Clinical Trials Network; Wiedemann HP, Wheeler AP, Bernard GR, et al. Comparison of two fluid-management strategies in acute lung injury. N Engl J Med. 2006;354(24):2564–2575. | |
Alsous F, Khamiees M, DeGirolamo A, Amoateng-Adjepong Y, Manthous CA. Negative fluid balance predicts survival in patients with septic shock: a retrospective pilot study. Chest. 2000;117(6): 1749–1754. | |
Brouse SD, Leff RD, Vu KL. Clinical outcomes following fluid restriction in heart failure exacerbation. Crit Care Med. 2005;33(12):A58. | |
Brandstrup B, Tønnesen H, Beier-Holgersen R, et al; Danish Study Group on Perioperative Fluid Therapy. Effects of intravenous fluid restriction on postoperative complications: comparison of two perioperative fluid regimens: a randomized assessor-blinded multicenter trial. Ann Surg. 2003;238(5):641–648. | |
Stein A, de Souza LV, Belettini CR, et al. Fluid overload and changes in serum creatinine after cardiac surgery: predictors of mortality and longer intensive care stay. A prospective cohort study. Crit Care. 2012;16(3):R99. | |
Bouchard J, Soroko SB, Chertow GM, et al; Program to Improve Care in Acute Renal Disease (PICARD) Study Group. Fluid accumulation, survival and recovery of kidney function in critically ill patients with acute kidney injury. Kidney Int. 2009;76(4):422–427. | |
Schuller D, Mitchell JP, Calandrino FS, Schuster DP. Fluid balance during pulmonary edema. Is fluid gain a marker or a cause of poor outcome? Chest. 1991;100(4):1068–1075. | |
Payen D, de Pont AC, Sakr Y, Spies C, Reinhart K, Vincent JL; Sepsis Occurrence in Acutely Ill Patients (SOAP) Investigators. A positive fluid balance is associated with a worse outcome in patients with acute renal failure. Crit Care. 2008;12(3):R74. | |
Boyd JH, Forbes J, Nakada TA, Walley KR, Russell JA. Fluid resuscitation in septic shock: a positive fluid balance and elevated central venous pressure are associated with increased mortality. Crit Care Med. 2011;39(2):259–265. | |
Lobo DN, Macafee DA, Allison SP. How perioperative fluid balance influences postoperative outcomes. Best Pract Res Clin Anaesthesiol. 2006;20(3):439–455. | |
Rahbari NN, Zimmermann JB, Schmidt T, Koch M, Weigand MA, Weitz J. Meta-analysis of standard, restrictive and supplemental fluid administration in colorectal surgery. Br J Surg. 2009;96(4):331–341. | |
Lowell JA, Schifferdecker C, Driscoll DF, Benotti PN, Bistrian BR. Postoperative fluid overload: not a benign problem. Crit Care Med. 1990;18(7):728–733. | |
Bouchard J, Mehta RL. Fluid balance issues in the critically ill patient. Contrib Nephrol. 2010;164:69–78. | |
Ronco C, Kaushik M, Valle R, Aspromonte N, Peacock WF 4th. Diagnosis and management of fluid overload in heart failure and cardio-renal syndrome: the “5B” approach. Semin Nephrol. 2012;32(1):129–141. | |
Monnet T, Teboul JL. Assessment of volume responsiveness during mechanical ventilation: recent advances. Crit Care. 2013;17(2):217. | |
Aditianingsih D, George YW. Guiding principles of fluid and volume therapy. Best Pract Res Clin Anaesthesiol. 2014;28(3):249–260. | |
Magee G, Zbrozek A. Fluid overload is associated with increases in length of stay and hospital costs: pooled analysis of data from more than 600 US hospitals. Clinicoecon Outcomes Res. 2013;5:289–296. | |
Albert N. Fluid management strategies in heart failure. Crit Care Nurse. 2012;32(2):20–32; quiz 34. | |
Peacock WF, Costanzo MR, De Marco T, et al; ADHERE Scientific Advisory Committee and Investigators. Impact of intravenous loop diuretics on outcomes of patients hospitalized with acute decompensated heart failure: insights from the ADHERE registry. Cardiology. 2009; 113(1):12–19. | |
Wehling MJ. Morbus diureticus in the elderly: epidemic overuse of a widely applied group of drugs. Am Med Dir Assoc. 2013;14(6): 437–442. | |
Joseph SM, Cedars AM, Ewald GA, Geltman EM, Mann DL. Acute decompensated heart failure, contemporary medical management. Tex Heart Inst J. 2009;36(6):510–520. | |
Lacy CF, Armstrong LL, Goldman MP, Lance LL. Drug Information Handbook: A Comprehensive Resource for All Clinicians and Healthcare Professionals. Hudson, OH: Lexi-Comp Incorporated; 2013. | |
Sweeney RM, McKendry RA, Bedi A. Perioperative intravenous fluid therapy for adults. Ulster Med J. 2013;82(3):171–178. | |
Medicines and Healthcare Products Regulatory Agency (MHRA). Infusion Systems Device Bulletin. v2.0; 2010:pp6. Available from: http://www.mhra.gov.uk/home/groups/dts-iac/documents/publication/con007322.pdf. Accessed December 6, 2013. | |
Charlson M, Szatrowski TP, Peterson J, Gold J. Validation of a combined comorbidity index. J Clin Epidemiol. 1994;47(11):1245–1251. | |
Healthcare Cost and Utilization Project (HCUP). 3M™ APR DRG Classification System, Methodology Overview. Available from: http://www.hcup-us.ahrq.gov/db/nation/nis/v261_aprdrg_meth_ovrview.pdf. Accessed December 6, 2013. | |
Akhtar S. IV fluid administration and the elderly. Clin Anesthesiol. 2011;37:3. | |
Peddicord TE, Olsen KM, ZumBrunnen TL, Warner DJ, Webb L. Stability of high-concentration dopamine hydrochloride, norepinephrine bitartrate, epinephrine hydrochloride, and nitroglycerin in 5% dextrose injection. Am J Health Syst Pharm. 1997;54(12):1417–1419. | |
Philips MS. Standardizing iv infusion concentrations: National survey results. Am J Health Syst Pharm. 2011;68(22):2176–2182. |
 © 2014 The Author(s). This work is published and licensed by Dove Medical Press Limited. The full terms of this license are available at https://www.dovepress.com/terms.php and incorporate the Creative Commons Attribution - Non Commercial (unported, v3.0) License.
By accessing the work you hereby accept the Terms. Non-commercial uses of the work are permitted without any further permission from Dove Medical Press Limited, provided the work is properly attributed. For permission for commercial use of this work, please see paragraphs 4.2 and 5 of our Terms.
© 2014 The Author(s). This work is published and licensed by Dove Medical Press Limited. The full terms of this license are available at https://www.dovepress.com/terms.php and incorporate the Creative Commons Attribution - Non Commercial (unported, v3.0) License.
By accessing the work you hereby accept the Terms. Non-commercial uses of the work are permitted without any further permission from Dove Medical Press Limited, provided the work is properly attributed. For permission for commercial use of this work, please see paragraphs 4.2 and 5 of our Terms.