Back to Journals » Infection and Drug Resistance » Volume 15
The Correlation Between Triglyceride-Glucose Index and SARS-CoV-2 RNA Re-Positive in Discharged COVID-19 Patients
Authors Zheng Y, Wang J, Ding X, Chen S, Li J, Shen B ![]()
Received 30 March 2022
Accepted for publication 6 July 2022
Published 17 July 2022 Volume 2022:15 Pages 3815—3828
DOI https://doi.org/10.2147/IDR.S368568
Checked for plagiarism Yes
Review by Single anonymous peer review
Peer reviewer comments 2
Editor who approved publication: Professor Suresh Antony
Yufen Zheng,* Jing Wang,* Xianhong Ding,* Shiyong Chen, Jun Li, Bo Shen
Department of Laboratory Medicine, Taizhou Hospital of Zhejiang Province Affiliated to Wenzhou Medical University, Taizhou, Zhejiang, People’s Republic of China
*These authors contributed equally to this work
Correspondence: Bo Shen, Department of Laboratory Medicine, Taizhou Hospital of Zhejiang Province Affiliated to Wenzhou Medical University, Taizhou, Zhejiang, People’s Republic of China, Tel/Fax +86 576 85226374, Email [email protected]
Objective: Facing the challenge to manage the SARS-CoV-2 RNA re-positive in discharged COVID-19 patients, it is necessary to explore the limited early risk factors for identifying SARS-CoV-2 RNA re-positive. The triglyceride and glucose index (TyG) has been developed as a surrogate marker of insulin resistance. This study aims to evaluate the correlation of the TyG index with the re-positive of COVID-19.
Methods: A total of 144 COVID-19 patients from Taizhou Hospital of Zhejiang Province Affiliated to Wenzhou Medical University (China) were enrolled in this study. All of them were discharged after recovery according to the guidelines. We compared the clinical characteristics and laboratory indexes of re-positive and non-re-positive COVID-19 patients, and analyzed the early risk factors for identifying SARS-CoV-2 RNA re-positive.
Results: During the follow-up, a total of 18 patients were tested re-positive for SARS-CoV-2 RNA. Re-positive COVID-19 patients had higher proportion of abidol (P=0.018), antibiotic use (P=0.024) and hepatitis-based diseases (P=0.042), and higher heart rate (P=0.011) at admission (P=0.026), while lower TyG index (P=0.036), eGFR (P=0.034), TG (P=0.015) and C1q (P=0.023). Multivariate logistic regression analysis showed that TyG index was an independent risk factor for the re-positive of SARS-CoV-2 RNA (P=0.005). TyG index was significantly correlated with Glu (P< 0.001), TG (P< 0.001) and HDL-C (P< 0.001). In addition, it was found that TyG index decreased at SARS-CoV-2 RNA positive stage and increased at negative stage (P< 0.05).
Conclusion: TyG index may be a valuable marker for identifying the re-positive of COVID-19 patients and may play a role in determining the stage of the patient’s disease. We hope to provide a reliable theoretical basis for clinical prediction and effective control of re-positive episodes, and to provide a breakthrough for further research on the causes of re-positive episodes and the immune mechanism of the virus.
Keywords: COVID-19, re-positive, TyG index, correlation
Graphical Abstract:

Introduction
Since December 2019, COVID-19 caused by SARS-CoV-2 has caused a global pandemic.1 As of December 1, 2021, 265 million confirmed COVID-19 patients and 5.25 million deaths have been reported worldwide.2 At the same time, most COVID-19 patients were recovered and discharged. However, it has been reported that some recovered COVID-19 patients were found to be SARS-CoV-2 RNA re-positive (hereinafter referred to as the re-positive),3,4 which increased the complexity of disease control and attracted extensive attention globally. Among the COVID-19 patients discharged from hospitals, the re-positive accounted for 10.6% to 21.4%.5–7 Although most re-positive patients are asymptomatic, previous reports of strong human-to-human transmission of SARS-CoV-2 in asymptomatic patients raise public concern.8,9 Unfortunately, the mechanism leading to the re-positive of these recovered COVID-19 patients remains unclear. Therefore, the early identification of re-positive discharged patients is significant to facilitate the determination on the isolation time and their clinical plan.
Recently, the triglyceride-glucose (TyG) index, a product of triglycerides and glucose, is widely used as a reliable surrogate marker of insulin resistance (IR).10–12 Several previous studies indicated that clinical markers of insulin resistance should be included as prognostic markers in assessment of COVID-19.13 Studies have shown that patients with insulin resistance may have an increased SARS-CoV-2 viral load, because of insulin increases membrane expression of ACE2, which acts as a dock for the virus to enter cells.14 But, so far, no previous study has investigated the relationship between TyG index and re-positive of discharged COVID-19 patients. Therefore, we evaluated the relation between TyG index and re-positive in recovered COVID-19 patients. It can provide a reliable basis for clinical treatment and effective control of the re-positive, and insights for further study on the causes and mechanism of the re-positive.
Materials and Methods
Study Design and Participants
A total of 144 COVID-19 patients from Taizhou Hospital of Zhejiang Province Affiliated to Wenzhou Medical University (China) were enrolled in this study. All patients were recovered and discharged before March 11, 2020. All of them were discharged according to the criteria of the Diagnosis and Treatment Protocol for COVID-19 (Sixth Edition) in China: the body temperature has returned to normal for more than 3 days; the respiratory symptoms have been improved significantly; pulmonary imaging shows that acute exudation lesions were significantly improved, and nucleic acid tests negative for respiratory tract pathogen twice consecutively (sampling interval being at least 1 day). After discharge, the patient continued to be isolated at home for 14 days and was monitored for health. Then, they returned to the hospital for follow-up examination after the 2 weeks’ isolation, including clinical symptoms, SARS-CoV-2 RNA, blood routine and blood biochemistry. As of August 28, 2020, a total of 18 patients were tested re-positive for SARS-CoV-2 RNA during the follow-up period (Figure 1). Re-positive of SARS-CoV-2 RNA means that the nasal swab or pharyngeal swab, or sputum sample of the recovered COVID-19 patient is tested positive by RT-PCR during the follow-up after discharge. Continuous SARS-CoV-2 RNA detection was performed at an interval of 24–48 hours during the readmission. The ethics committee approved this study protocol of Taizhou hospital, Zhejiang Province (Ethics No.K20200211). All study participants or their representatives had provided the informed consent in written form before they are enrolled in the study.
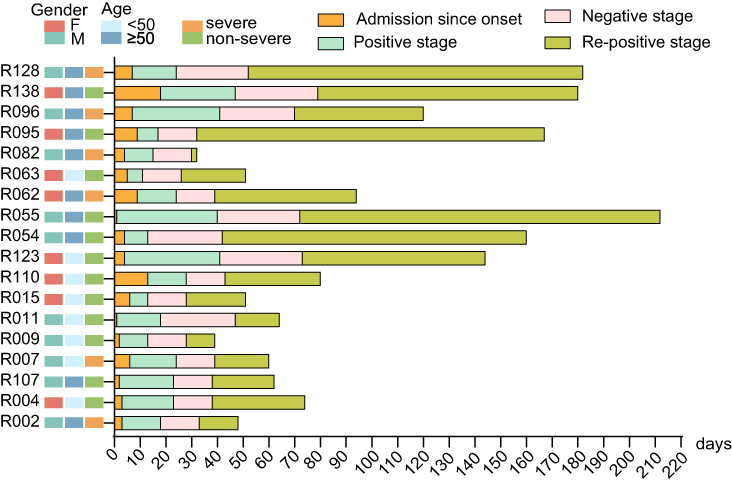 |
Figure 1 Baseline information of 18 re-positive COVID-19 patients. |
Data Collection
We collected the clinical data of 144 COVID-19 patients from electronic medical records, including their general characteristics (age, gender, BMI), vital signs (heart rate, respiratory rate), admission since onset, length of hospitalization, severity of disease, clinical symptoms (fever, cough), comorbidities (hypertension, diabetes mellitus, hepatitis), lung CT (lung lobes, patchy/GGO, consolidation, fibrous stripes), treatment (abidol, antibiotic, oseltamivir, immunoglobulin, methylprednisolone, interferon, kaletra), laboratory data (SARS-CoV-2 RNA, complete blood count, inflammatory indexes, renal function, lipoprotein, immune indexes). All data were collected independently by two researchers and recorded into the database, and a third researcher conducted the final review of the data. The triglyceride-glucose index (TyG index) was calculated as formula: ln [fasting triglycerides (mg/dL)×fasting plasma glucose (mg/dL)/2].12,15
SARS-CoV-2 RNA Analysis
Reverse transcription polymerase chain reaction (RT-PCR) was used to confirm SARS-CoV-2 RNA infection and the re-positive. The SARS-CoV-2 RNA test uses throat swabs, nasopharyngeal swabs, and sputum specimens. The sample nucleic acids were extracted by nucleic acid extraction reagent (REG. NO: SFDA(I)20180492, Lot number P20200201, Zhijiang Biological, Shanghai, China) and extraction equipment (REG. NO: SFDA(I)20180492, ZJ Bio-Tech-EX3600, Shanghai, China), using the SARS-CoV-2 nucleic acid detection kit (fluorescence PCR method) (REG. NO: SFDA(I)20203400057, Lot number P20200105, Zhijiang Bio-Tech, Shanghai, China) and amplification instrument ((REG. NO: SFDA(I)20163400767, Thermo Bio-Tech, ABI 7500, USA) to detect the target gene. The kit uses one-step RT-PCR combined with TaqMan technology to detect RdRp, E, and N genes. RNA-positive would be confirmed if the RdRp gene was positive (cycle time <43 s), and E or/and N gene was also positive (cycle time <43 s).
Statistical Analysis
Statistical analysis was performed using SPSS (22.0) and R software (version 3.5.1). Categorical variables were expressed as numbers and percentages, continuous variables with non-normal distribution were expressed as median [quartile (IQR)]. Chi-square test and Mann–Whitney U-test were used to compare the differences between the re-positive group and non-re-positive group in discharged COVID-19 patients. Variables of P<0.05 in the univariate logistic regression were used as candidate for multivariate analysis. Multivariate logistic regression models were used to identify the early risk factors of SARS-CoV-2 RNA re-positive in discharged COVID-19 patients. Spearman’s coefficient analyzed the correlation between TyG index and lipoprotein, inflammatory index and immune index. Paired t-test was used to analyze the differences of TyG index, Urea and IL-2 in the SARS-CoV-2 RNA positive stage, re-positive stage and negative stage. P value <0.05 was considered statistically significant.
Results
Demographic and Epidemiological Characteristics
A total of 144 COVID-19 patients were recovered and discharged, and they were followed up for at least 14 days after isolation. As of August 28, 2020, a total of 18 SARS-CoV-2 RNA re-positive patients were found, including 10 males (55.6%) and 8 females (44.4%), with a median age of 52.00 (43.50–63.75) years. Among the non-re-positive rehabilitation patients, there were 67 males (53.2%) and 59 females (46.8%), with a median age of 46.50 (37.00–56.00) years. There was no significant difference in age, sex and BMI between the re-positive group and the non-re-positive group (all P>0.05). Among re-positive patients, there were 6 (33.3%) severe cases, 13 (72.2%) cases with fever and 6 (33.3%) cases with cough, 4 (22.2%) cases with a history of hypertension, 3 (16.7%) cases with a history of diabetes, in these aspects, there was no significant difference between re-positive and non-re-positive group. But the proportion of patients with hepatitis history in the re-positive group was higher (16.7% vs 3.2%) (P=0.042). In addition, there was no significant difference in admission since onset (4.50 days vs 6.00 days) and in length of hospitalization (21.50 days vs 21.50 days) between re-positive and non-re-positive patients (all P>0.05) (Table 1).
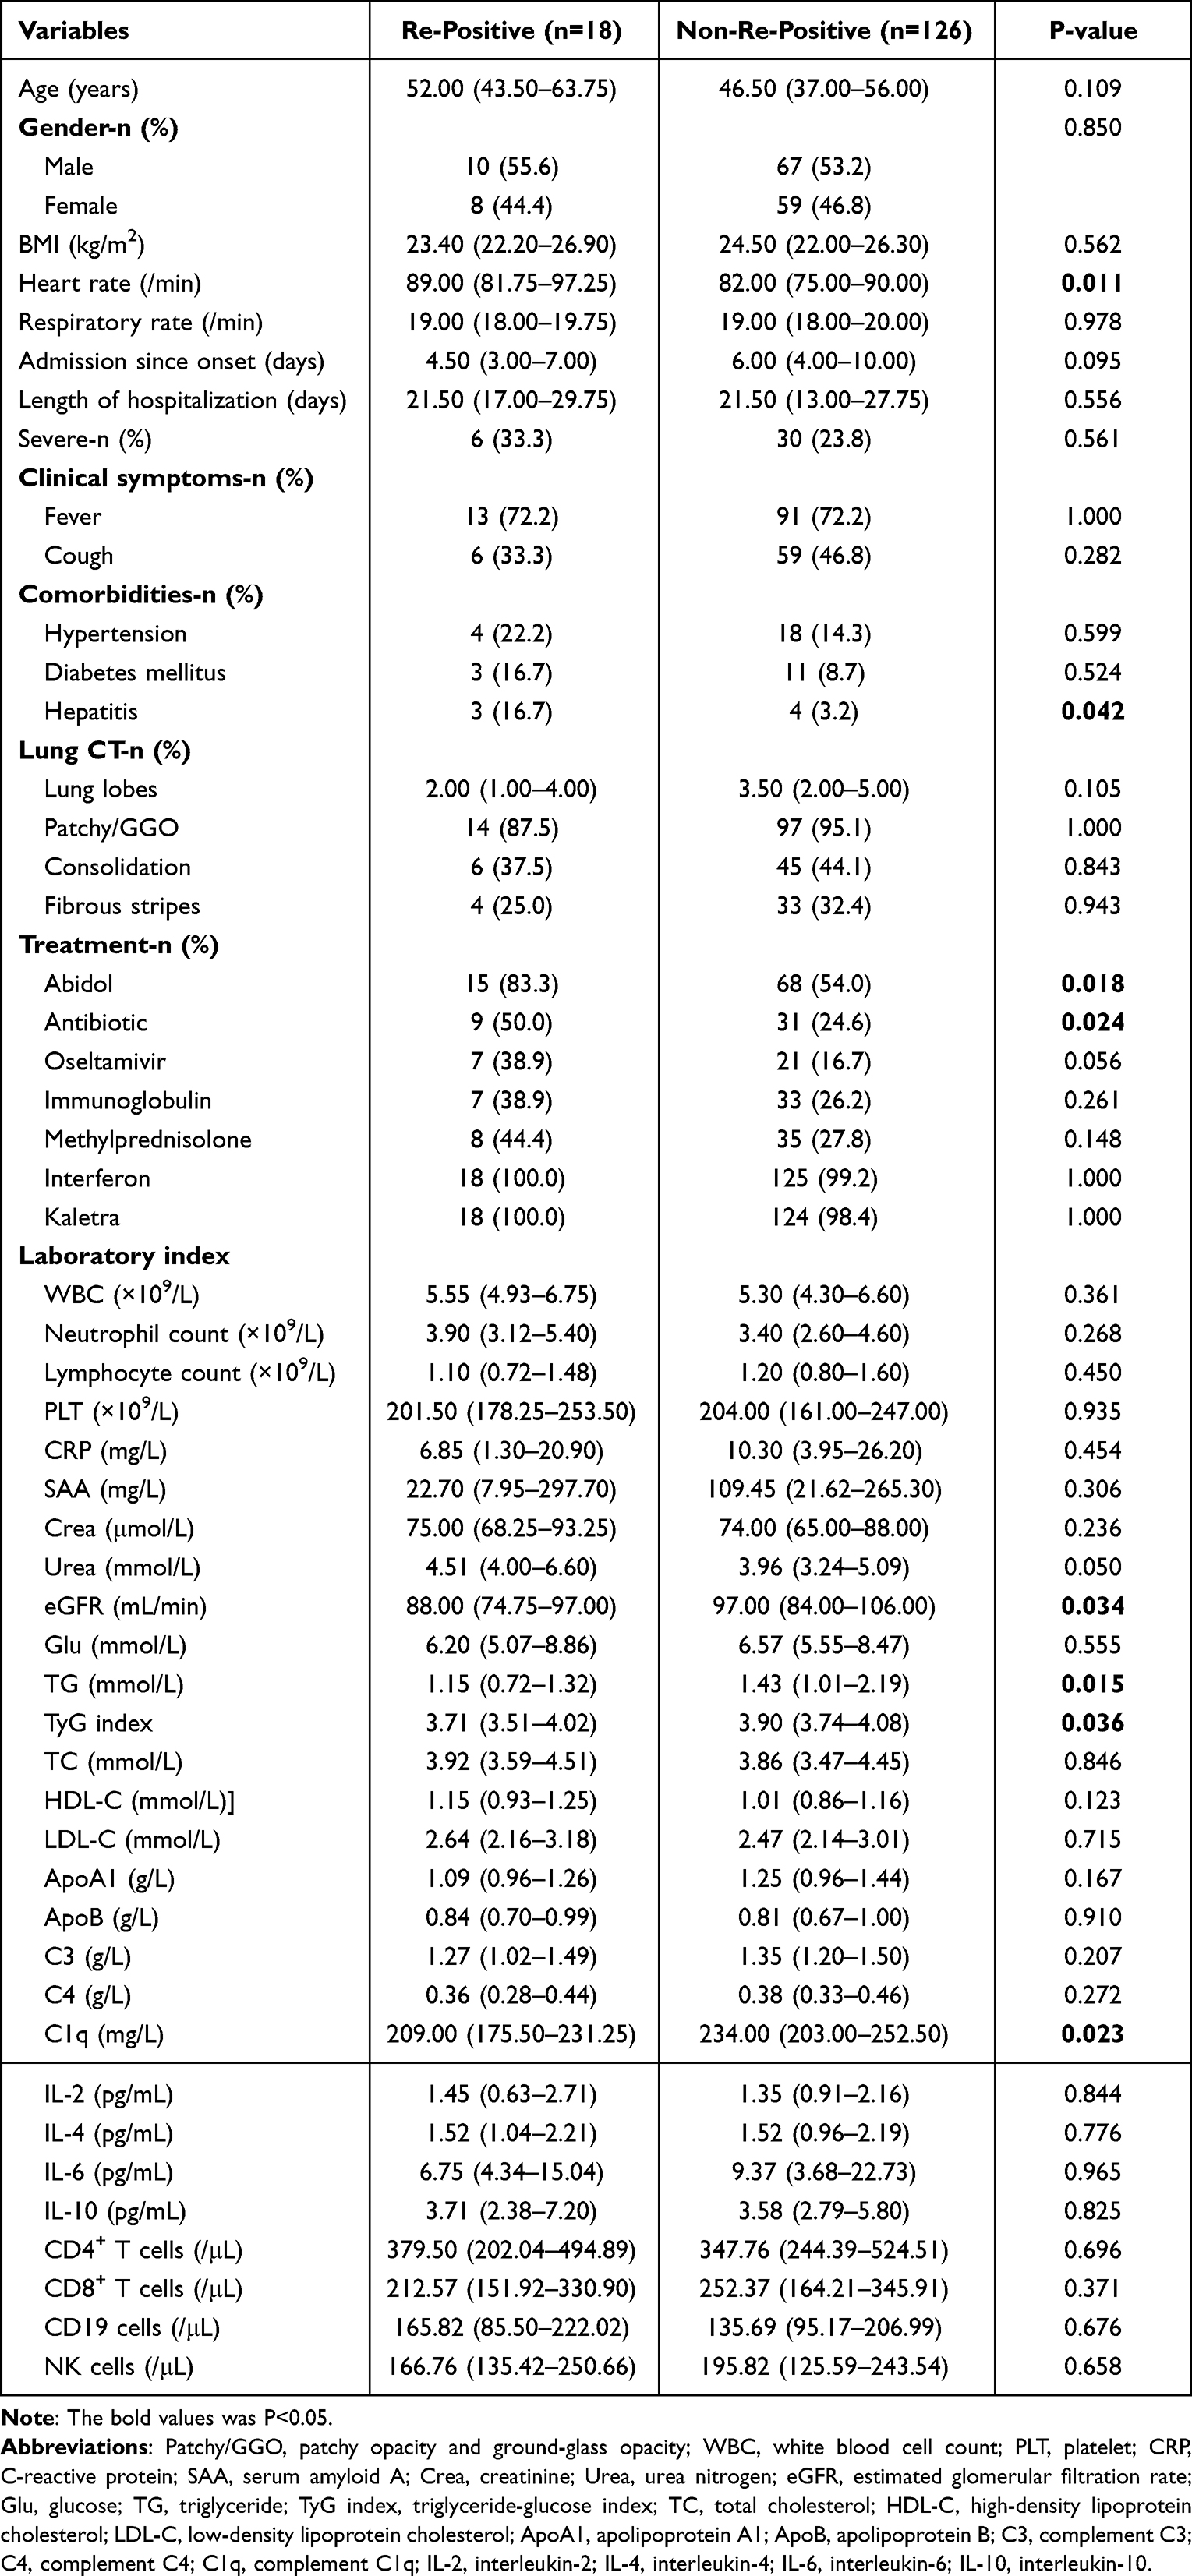 |
Table 1 Baseline Characteristics, Clinical and Laboratory Indicators of Patients with COVID-19 |
Differences Between Re-Positive and Non-Re-Positive Patients
In order to study the differences between re-positive and non-re-positive patients, we compared and analyzed the pulmonary imaging features, inflammatory indexes, renal function, lipoprotein and immune indexes and medication during hospitalization. It was found that re-positive patients had higher heart rate (89/min vs 82/min; P=0.011), while lower eGFR (88mL/min vs 97 mL/min; P=0.034), triglyceride (1.15mmol/L vs 1.43mmol/L; P=0.015), TyG index (3.71 vs 3.90; P=0.036) and C1q (209 mg/L vs 234mg/L; P=0.023). In addition, abidol (83.3% vs 54.0%; P=0.018) and antibiotic (50.0% vs 24.6%; P=0.024) were used more frequently during their hospitalization in re-positive patients. There was no significant difference in other indicators between re-positive and non-re-positive patients (all P<0.05) (Table 1, Figure 2).
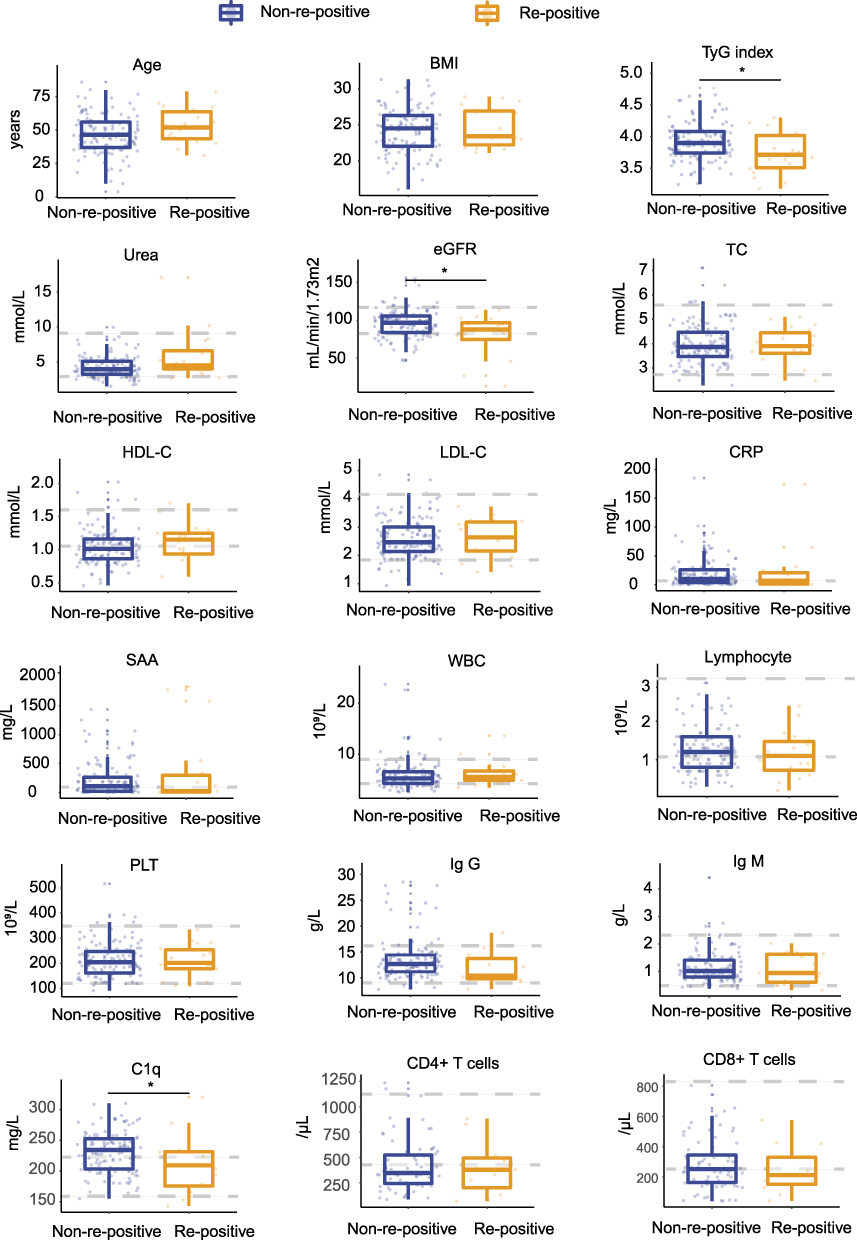 |
Figure 2 Boxplots of inflammatory indexes, renal function, lipoprotein and immune indexes between non-re-positive and re-positive COVID-19 patients. Abbreviations: TyG index, triglyceride-glucose index; Urea, urea nitrogen; eGFR, estimated glomerular filtration rate; TC, total cholesterol; HDL-C, high-density lipoprotein cholesterol; LDL-C, low-density lipoprotein cholesterol; CRP, C-reactive protein; SAA, serum amyloid A; WBC, white blood cell count; PLT, platelet; IgG, serum immunoglobulin G; IgM, serum immunoglobulin M; C1q, complement C1q. Note: *P value <0.05. |
Risk Factors for Identifying the Re-Positive in COVID-19 Patients After Discharge
Univariate logistic regression analysis shows that COVID-19 patients using abidol, antibiotic and oseltamivir during hospitalization have a higher risk of SARS-CoV-2 RNA re-positive after discharge. IL-2, Urea, eGFR, TyG index and C1q at admission are also risk factors for SARS-CoV-2 RNA re-positive after discharge. Multivariate logistic regression analysis shows that higher levels of IL-2 [odds ratio (OR)=1.686, 95% confidence interval (CI): 1.065–2.670; P=0.026], Urea [OR=1.568, 95% CI: 1.087–2.262; P=0.016] and lower levels of TyG index [OR=0.023, 95% CI: 0.002–0.324; P=0.005] were independent risk factors for SARS-CoV-2 RNA re-positive in recovered COVID-19 patients after discharge (Table 2, Figure 3).
 |
Table 2 Univariate and Multivariate Logistic Regression Analysis of Factors Associated with the Re-Positive Patients with COVID-19 (n=144) |
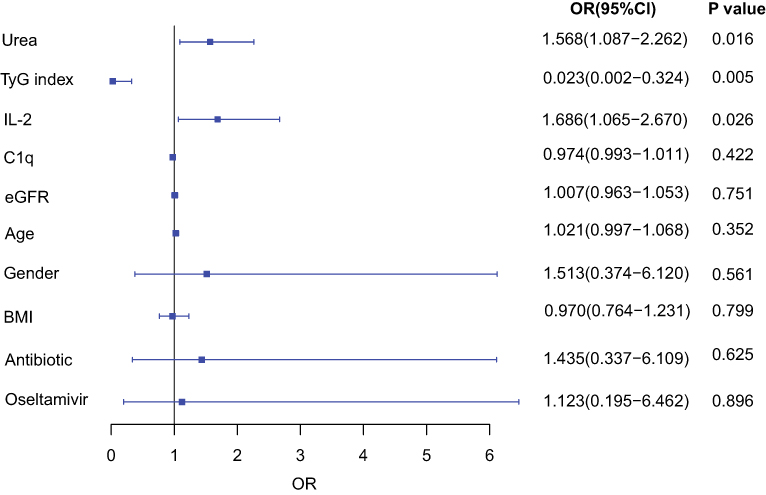 |
Figure 3 Risk factors for re-positive COVID-19 patients. Multivariate logistic regression was applied to compute p-values. Abbreviations: Urea, urea nitrogen; TyG index, triglyceride-glucose index; IL-2, interleukin-2; C1q, complement C1q; eGFR, estimated glomerular filtration rate; OR, odds ratio. |
Correlation Between TyG Index and Inflammatory Indexes, Renal Function, Lipoprotein and Immune Indexes
In terms of inflammatory indexes, TyG index was positively correlated with SAA (P=0.026), WBC (P<0.001) and neutrophil (P<0.001). In terms of lipoprotein, TyG index was positively correlated with TG (P<0.001) and ApoB (P=0.001), but negatively correlated with HDL-C and ApoA1 (all P<0.001). In terms of renal function, TyG index was positively correlated with Urea (P<0.001), negatively correlated with eGFR (P=0.005). In terms of immune indexes, TyG index was positively correlated with C3 (P<0.001). In addition, TyG index was positively correlated with Glu (P<0.001) (Figure 4).
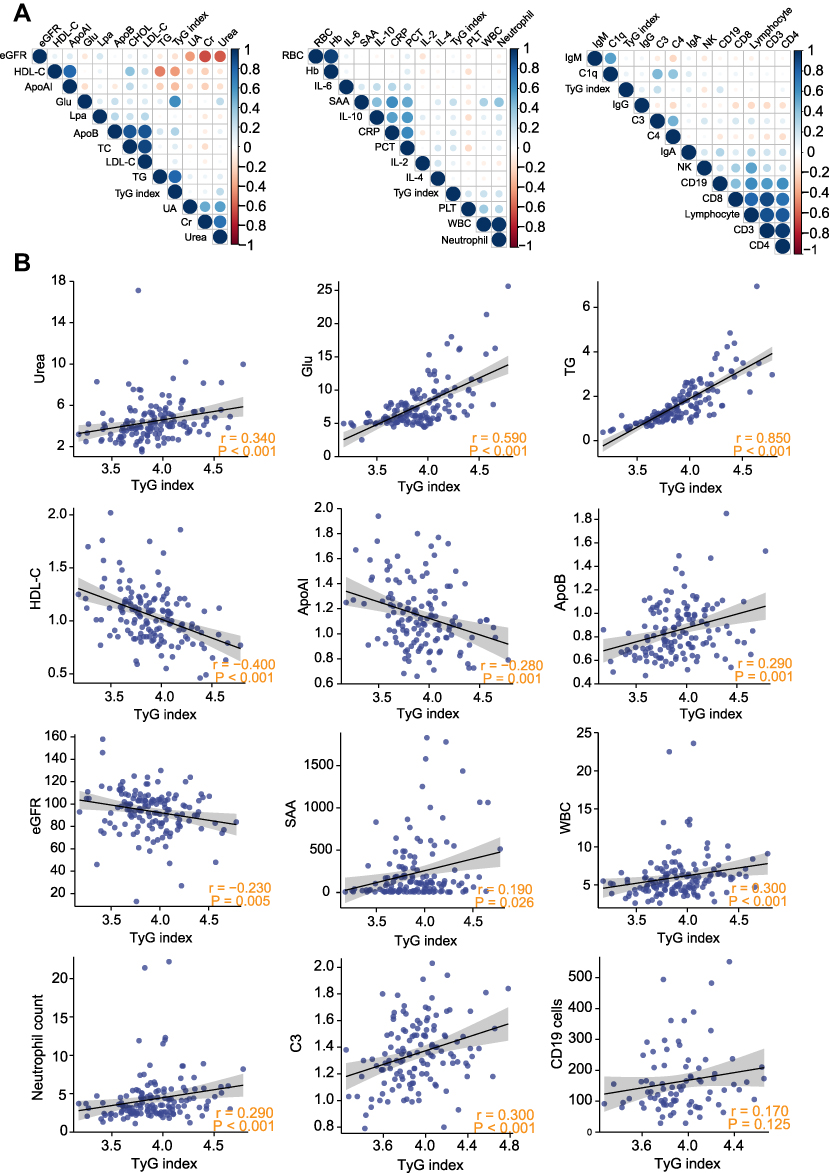 |
Figure 4 Correlation of TyG index with lipoprotein, renal function, inflammatory indexes and immune indexes in non-re-positive and re-positive COVID-19 patients. (A) Heatmap of correlation between TyG index and lipoprotein, renal function, inflammatory indexes and immune indexes. (B) Correlation between 12 selected clinical indicators and TyG index. Abbreviations: eGFR, estimated glomerular filtration rate; HDL-C, high-density lipoprotein cholesterol; ApoA1, apolipoprotein A1; Glu, glucose; Lpa, lipoprotein a; ApoB, apolipoprotein B; TC, total cholesterol; LDL-C, low-density lipoprotein cholesterol; TG, triglyceride; TyG index, triglyceride-glucose index; UA, uric acid; Crea, creatinine; Urea, urea nitrogen; RBC, red blood cell; Hb, hemoglobin; IL-6, interleukin-6; SAA, serum amyloid A; IL-10, interleukin-10; CRP, C-reactive protein; PCT, procalcitonin; IL-2, interleukin-2; IL-4, interleukin-4; PLT, platelet; WBC, white blood cell count; IgM, serum immunoglobulin M; C1q, complement C1q; IgG, serum immunoglobulin G; C3, complement C3; C4, complement C4; IgA, serum immunoglobulin A; NK, natural killer cell; CD19, cluster of differentiation 19; CD8,CD8+T cells; CD3,CD3+T cells; CD4,CD4+T cells. |
Dynamic Changes of Laboratory Indexes in Re-Positive COVID-19 Patients
We analyzed the three indexes (TyG index, Urea and IL-2) in 18 re-positive patients in their four stages [admission (SARS-CoV-2 RNA positive stage), discharge (SARS-CoV-2 RNA negative stage), follow-up (SARS-CoV-2 RNA re-positive stage) and follow-up (SARS-CoV-2 RNA negative stage)]. It was found that TyG index decreased at SARS-CoV-2 RNA positive stage and re-positive stage, and increased at the negative stage, with significant difference (P<0.05), while there was no difference between Urea and IL-2 at these four stages (P>0.05) (Figure 5). These results suggest that TyG index may be an important indicator to identify SARS-CoV-2 RNA re-positive and the progress of the disease course in COVID-19 patients.
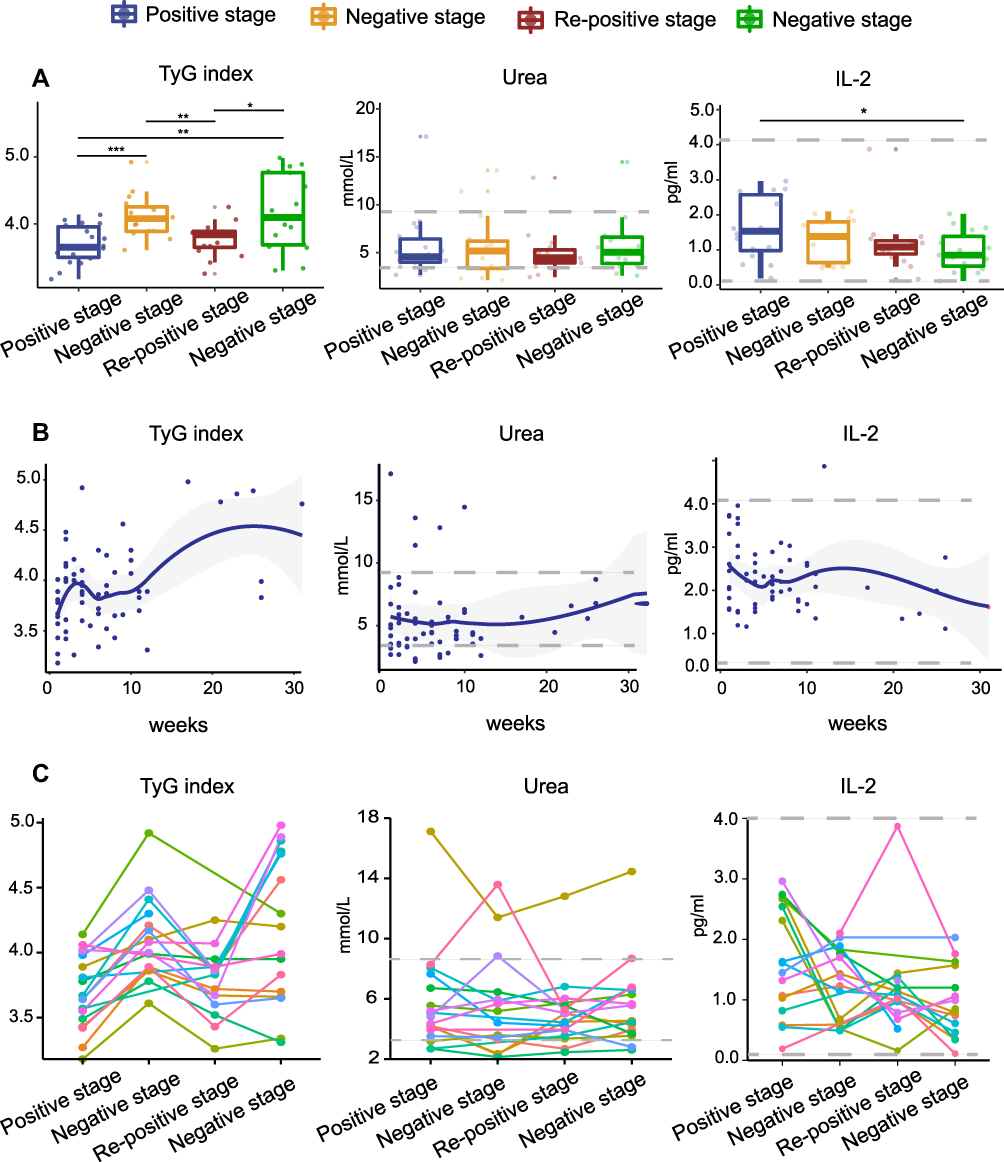 |
Figure 5 TyG index, Urea, and IL-2 in re-positive patients of COVID-19 at different stages. (A) TyG index, Urea, and IL-2 at different stages of the COVID-19 patients. The TyG index of the re-positive patients at positive and re-positive stage was lower than that of the negative stage, and the difference was statistically significant. The X-axis represents the stage of the patient’s course, which is segmented based on RT-PCR results, and the Y-axis is the value of the index. (B) Thirty-weeks temporal expressions of TyG index, Urea, and IL-2. The X-axis represents the time from onset to nucleic acid testing and the Y-axis is the value of the index. (C) Dynamic changes of TyG index, Urea, and IL-2 in re-positive patients of COVID-19 at different stages. The X-axis represents the stage of the patient’s course, which is segmented based on RT-PCR results, and the Y-axis is the value of the index. Abbreviations: TyG index, triglyceride-glucose index; Urea, urea nitrogen; IL-2, interleukin-2. Notes: *P value <0.05. **P value <0.01. ***P value <0.005. |
Discussion
The pandemic of COVID-19 is still ongoing, and the number of cases is increasing rapidly. The re-positive of SARS-CoV-2 RNA in recovered patients has raised public concern. However, the mechanism leading to the re-positive of these patients is still unclear. Therefore, the monitoring indicators for early identification of SARS-CoV-2 RNA re-positive in discharged patients are critical. In our study, we firstly identified a significant association between the TyG index and SARS-CoV-2 RNA re-positive in recovered COVID-19 patients after discharge, and found that TyG index decreased at the positive and re-positive SARS-CoV-2 RNA stages and increased at the negative stage. This suggests that TyG index may be a valuable marker for identifying the re-positive of COVID-19 patients and may play a role in determining the stage of the patient’s disease.
All patients with COVID-19 included in the study were treated and discharged in accordance with the Diagnosis and Treatment Protocol for COVID-19 (Sixth Edition) in China. All patients were strictly isolated and monitored after discharge, so the possibility of being infected again was ruled out. During the follow-up of at least 5.5 months after discharge, it was found that the re-positive rate was 12.5%, which was lower than the re-positive rates of 14.1%,16 19.8%17 and 16.7%18 reported in previous research, and the follow-up time was much longer (1 or 2 months in most studies).19,20
So far, the mechanism of SARS-CoV-2 RNA re-positive in recovered COVID-19 patients is still unclear. The possible reasons suggested by other researchers are as follows: (1) Intermittent virus shedding: the virus may have an intermittent dormancy period. Though the patient has recovered, the virus may continue to exist, resulting in SARS-CoV-2 RNA positive later. Studies demonstrated that the virus shedding time lasted more than 14 days in 6604 COVID-19 patients.21 In our research, the time from negative SARS-CoV-2 RNA before discharge to re-positive at follow-up after discharge was 15–32 days, and the duration of the re-positive stage was 2–140 days, which could be the result of the continuous release of virus from respiratory tract. However, the dormancy and clearance characteristics of SARS-CoV-2 in vivo are still unclear. (2) The course of drug treatment was insufficient and virus clearance was incomplete: the re-positive patients once inhibited virus replication during hospitalization for the medication used, reducing the virus load to display negative test results. Nevertheless, the actual virus may hide in the body, and may not be completely cleared. After discharge, without sustained medication, it may lead to virus proliferation and SARS-CoV-2 RNA re-positive. In this study, the frequency of abidol and antibiotic use was higher in the re-positive group during hospitalization, suggesting that these drugs may inhibit virus replication and lead to negative test results. (3) Sampling error: viral infection initially appears in the upper respiratory tract, so nasopharyngeal swab is the most commonly used method to get the specimen. A false-negative result may occur if the swab is not inserted deep enough to collect enough virus particles. In addition, with the progression of the infection, the virus will appear in the lower respiratory tract or other sites, the virus concentration in the upper respiratory tract specimens decreases, even under the detection limit of reagent analysis, which also can cause false-negative results.
Studies have shown that insulin resistance (IR) could increase COVID-19 infection susceptibility.14 Increased IR leads to increased pancreatic expression of ACE2 receptors, creating more affinity for the spike protein to bind thereby predisposing those with IR to increased vulnerability COVID-19 infections.22 TyG index is recognized as an insulin resistance marker.23 Recent studies have suggested that TyG index is an independent predictor of the development of hypertension,24 diabetes,25 and non-alcoholic fatty liver disease,26 and can also predict the progression of cardiovascular events.27 Previous studies demonstrated that TyG index could predict the severity and mortality of COVID-19.28 Acute viral respiratory infection is suggested to be related to the rapid development of transient insulin resistance in overweight and obese individuals.29 Virus induce insulin resistance by increasing inflammation and immune dysfunction through a variety of mechanisms. The liver and skeletal muscle are primarily responsible for insulin-induced glucose disposal, and their function will be influenced by a large number of inflammatory cells and inflammatory factors.30 It has been reported that COVID-19 patients have a diffuse alveolar injury, inflammatory cell infiltration in lung and liver, and high levels of inflammatory markers in serum, such as IFN-γ, IL-6, ferritin and D-dimer. These results suggest that inflammation caused by SARS-CoV-2 infection increases insulin resistance.31,32 In our study, we found that TyG index decreased at SARS-CoV-2 RNA positive stage and re-positive stage, and increased at negative stage, suggesting that TyG index may be a reliable marker to predict the re-positive of COVID-19 patients, and may play a role in determining the stage of the patient’s disease. The dynamic change of the TyG index may be due to the aggravation of insulin resistance caused by continuous infection of SARS-CoV-2, and remind physicians that more intensive attention should be paid to COVID-19 patients with dynamic variation rule of the TyG index.
Limitations of the Study
Our research has the following limitations: firstly, it is a single-center research with a relatively small sample, which may affect the promotion and application of research in multi centers. Secondly, this study is retrospective, missing the possibility to detect the virus sequence information. For the future study, a comprehensive and in-depth research could be conducted to include more re-positive patients and detect the virus sequence accordingly. In this way, the predictive value of TyG index for re-positive patients can be more reliably confirmed, and the characteristics of re-positive patients can be more comprehensively analyzed and mastered by clinicians. Thirdly, we did not collect samples continuously from the discharged patients, resulting in potential deviations in the duration from discharge to the first re-positive SARS-CoV-2 RNA and when the re-positive turned negative.
Conclusion
In this study, we found that there was no significant difference in age, gender, complications, disease severity, pulmonary imaging and clinical symptoms between re-positive and non-re-positive COVID-19 patients. At the time of admission, there were significant differences in TyG index, eGFR, Urea and C1q between re-positive and non-re-positive patients. In addition, TyG index decreased at the positive and re-positive SARS-CoV-2 RNA stages, and increased at the negative stage, showing a significant difference, suggesting that TyG index may be a reliable indicator for identifying re-positive of COVID-19 patients and may play a role in determining the stage of the patient’s disease, but the mechanism of action in re-positive patients needs to be further studied.
Data Sharing Statement
The data presented in this study are available on request from the corresponding author.
Ethical Approval Information
The study was conducted according to the guidelines of the Declaration of Helsinki and approved by the Institutional Medical Ethics Review Board of Taizhou Hospital of Zhejiang Province (No: K20200211; date of approval: 25 February 2020).
Acknowledgments
We acknowledge all participating hospitals and affiliated researchers for their contribution and support.
Author Contributions
All authors made a significant contribution to the work reported, whether that is in the conception, study design, execution, acquisition of data, analysis and interpretation, or in all these areas; took part in drafting, revising or critically reviewing the article; gave final approval of the version to be published; have agreed on the journal to which the article has been submitted; and agree to be accountable for all aspects of the work. Yufen Zheng, Jing Wang, and Xianhong Ding contributed equally to this work and share first authorship.
Funding
This work was supported by the Medical Science and Technology Project of Zhejiang Province (2021KY394).
Disclosure
The authors declare no conflicts of interest in relation to this work. The funders had no role in the design of the study; in the collection, analyses, or interpretation of data; in the writing of the manuscript, or in the decision to publish the results.
References
1. Li Q, Guan X, Wu P, et al. Early transmission dynamics in Wuhan, China, of novel coronavirus–infected pneumonia. N Engl J Med. 2020;382:1199–1207. doi:10.1056/NEJMoa2001316
2. Worldometer. COVID-19 coronavirus pandemic. Available online at: https://www.worldometers.info/coronavirus. Accessed December 1, 2021.
3. Chen D, Xu W, Lei Z, et al. Recurrence of positive SARS-CoV-2 RNA in COVID-19: a case report. Int J Infect Dis. 2020;93:297–299. doi:10.1016/j.ijid.2020.03.003
4. Li Y, Hu Y, Yu Y, et al. Positive result of Sars‐Cov‐2 in faeces and sputum from discharged patients with COVID‐19 in Yiwu, China. J Med Virol. 2020;92(10):1938–1947. doi:10.1002/jmv.25905
5. Deng W, Guang T-W, Yang M, et al. Positive results for patients with COVID-19 discharged form hospital in Chongqing, China. BMC Infect Dis. 2020;20(1):1–6. doi:10.1186/s12879-020-05151-y
6. Xiao AT, Tong YX, Zhang SJ. False‐negative of RT‐PCR and prolonged nucleic acid conversion in COVID‐19: rather than recurrence. J Med Virol. 2020;92:1755–1756. doi:10.1002/jmv.25855
7. Yuan J, Kou S, Liang Y, Zeng J, Pan Y, Liu L. Polymerase chain reaction assays reverted to positive in 25 discharged patients with COVID-19. Clin Infect Dis. 2020. 71(16):2230–2232. doi:10.1093/cid/ciaa398
8. Li C, Ji F, Wang L, et al. Asymptomatic and human-to-human transmission of SARS-CoV-2 in a 2-family cluster, Xuzhou, China. Emerg Infect Dis. 2020;26(7):1626-1628. doi:10.3201/eid2607.200718
9. Kenyon C. The prominence of asymptomatic superspreaders in transmission mean universal face masking should be part of COVID-19 de-escalation strategies. Int J Infect Dis. 2020;97:21–22. doi:10.1016/j.ijid.2020.05.102
10. Simental-Mendía LE, Rodríguez-Morán M, Guerrero-Romero F. The product of fasting glucose and triglycerides as surrogate for identifying insulin resistance in apparently healthy subjects. Metab Syndr Relat Disord. 2008;6(4):299–304. doi:10.1089/met.2008.0034
11. Vasques ACJ, Novaes FS, de Oliveira MD, et al. TyG index performs better than HOMA in a Brazilian population: a hyperglycemic clamp validated study. Diabetes Res Clin Pract. 2011;93(3):e98–e100. doi:10.1016/j.diabres.2011.05.030
12. Guerrero-Romero F, Villalobos-Molina R, Jiménez-Flores JR, et al. Fasting triglycerides and glucose index as a diagnostic test for insulin resistance in young adults. Arch Med Res. 2016;47(5):382–387. doi:10.1016/j.arcmed.2016.08.012
13. Gangadharan C, Ahluwalia R, Sigamani A. Diabetes and COVID-19: role of insulin resistance as a risk factor for COVID-19 severity. World J Diabetes. 2021;12(9):1550-1562. doi:10.4239/wjd.v12.i9.1550
14. Govender N, Khaliq OP, Moodley J, et al. Insulin resistance in COVID-19 and diabetes. Prim Care Diabetes. 2021;15(4):629–634. doi:10.1016/j.pcd.2021.04.004
15. Guerrero-Romero F, Simental-Mendía LE, González-Ortiz M, et al. The product of triglycerides and glucose, a simple measure of insulin sensitivity. Comparison with the euglycemic-hyperinsulinemic clamp. J Clin Endocrinol Metab. 2010;95(7):3347–3351. doi:10.1210/jc.2010-0288
16. Lu J, Peng J, Xiong Q, et al. Clinical, immunological and virological characterization of COVID-19 patients that test re-positive for SARS-CoV-2 by RT-PCR. EBioMedicine. 2020;59:102960. doi:10.1016/j.ebiom.2020.102960
17. Habibzadeh P, Sajadi MM, Emami A, et al. Rate of re-positive RT-PCR test among patients recovered from COVID-19. Biochem Med. 2020;30(3):030401. doi:10.11613/BM.2020.030401
18. Landi F, Carfì A, Benvenuto F, et al. Predictive factors for a new positive nasopharyngeal swab among patients recovered from covid-19. Am J Prev Med. 2021;60(1):13–19. doi:10.1016/j.amepre.2020.08.014
19. Zheng J, Zhou R, Chen F, et al. Incidence, clinical course and risk factor for recurrent PCR positivity in discharged COVID-19 patients in Guangzhou, China: a prospective cohort study. PLoS Negl Trop Dis. 2020;14(8):e0008648. doi:10.1371/journal.pntd.0008648
20. Tao W, Wang X, Zhang G, et al. Re-detectable positive SARS-CoV-2 RNA tests in patients who recovered from COVID-19 with intestinal infection. Protein Cell. 2021;12(3):230–235. doi:10.1007/s13238-020-00778-8
21. Phillips SP, Wei X, Kwong JC, et al. Duration of SARS-CoV-2 shedding: a population-based, Canadian study. PLoS One. 2021;16(6):e0252217. doi:10.1371/journal.pone.0252217
22. Roca-Ho H, Riera M, Palau V, Pascual J, Soler MJ. Characterization of ACE and ACE2 expression within different organs of the NOD mouse. Int J Mol Sci. 2017;18(3):563. doi:10.3390/ijms18030563
23. Du T, Yuan G, Zhang M, Zhou X, Sun X, Yu X. Clinical usefulness of lipid ratios, visceral adiposity indicators, and the triglycerides and glucose index as risk markers of insulin resistance. Cardiovasc Diabetol. 2014;13(1):1–10. doi:10.1186/s12933-014-0146-3
24. Sánchez-íñigo L, Navarro-González D, Pastrana-Delgado J, Fernández-Montero A, Martínez JA. Association of triglycerides and new lipid markers with the incidence of hypertension in a Spanish cohort. J Hypertens. 2016;34(7):1257–1265. doi:10.1097/HJH.0000000000000941
25. Zhang M, Wang B, Liu Y, et al. Cumulative increased risk of incident type 2 diabetes mellitus with increasing triglyceride glucose index in normal-weight people: the Rural Chinese cohort study. Cardiovasc Diabetol. 2017;16(1):1–11. doi:10.1186/s12933-017-0514-x
26. Zhang S, Du T, Zhang J, et al. The triglyceride and glucose index (TyG) is an effective biomarker to identify nonalcoholic fatty liver disease. Lipids Health Dis. 2017;16(1):1–8. doi:10.1186/s12944-017-0409-6
27. Sánchez‐íñigo L, Navarro‐González D, Fernández‐Montero A, Pastrana‐Delgado J, Martínez JA. The TyG index may predict the development of cardiovascular events. Eur J Clin Invest. 2016;46(2):189–197. doi:10.1111/eci.12583
28. Ren H, Yang Y, Wang F, et al. Association of the insulin resistance marker TyG index with the severity and mortality of COVID-19. Cardiovasc Diabetol. 2020;19:1–8. doi:10.1186/s12933-020-01035-2
29. Šestan M, Marinović S, Kavazović I, et al. Virus-induced interferon-γ causes insulin resistance in skeletal muscle and derails glycemic control in obesity. Immunity. 2018;49(1):
30. Groop LC, Bonadonna RC, DelPrato S, et al. Glucose and free fatty acid metabolism in non-insulin-dependent diabetes mellitus. Evidence for multiple sites of insulin resistance. J Clin Invest. 1989;84(1):205–213. doi:10.1172/JCI114142
31. Eketunde AO, Mellacheruvu SP, Oreoluwa P. A review of postmortem findings in patients with COVID-19. Cureus. 2020;12(7):e9438. doi:10.7759/cureus.9438
32. Huang C, Wang Y, Li X, et al. Clinical features of patients infected with 2019 novel coronavirus in Wuhan, China. Lancet. 2020;395(10223):497–506. doi:10.1016/S0140-6736(20)30183-5
 © 2022 The Author(s). This work is published and licensed by Dove Medical Press Limited. The
full terms of this license are available at https://www.dovepress.com/terms
and incorporate the Creative Commons Attribution
- Non Commercial (unported, 3.0) License.
By accessing the work you hereby accept the Terms. Non-commercial uses of the work are permitted
without any further permission from Dove Medical Press Limited, provided the work is properly
attributed. For permission for commercial use of this work, please see paragraphs 4.2 and 5 of our Terms.
© 2022 The Author(s). This work is published and licensed by Dove Medical Press Limited. The
full terms of this license are available at https://www.dovepress.com/terms
and incorporate the Creative Commons Attribution
- Non Commercial (unported, 3.0) License.
By accessing the work you hereby accept the Terms. Non-commercial uses of the work are permitted
without any further permission from Dove Medical Press Limited, provided the work is properly
attributed. For permission for commercial use of this work, please see paragraphs 4.2 and 5 of our Terms.