Back to Journals » Diabetes, Metabolic Syndrome and Obesity » Volume 15
The Correlation Between Estimated Glucose Disposal Rate and Coagulation Indexes in Type 2 Diabetes Mellitus
Authors Li Z, Qi C, Jia Z, Zhen R ![]() , Ren L, Jia Y, Chen S
, Ren L, Jia Y, Chen S
Received 27 April 2022
Accepted for publication 16 August 2022
Published 31 August 2022 Volume 2022:15 Pages 2643—2652
DOI https://doi.org/10.2147/DMSO.S371457
Checked for plagiarism Yes
Review by Single anonymous peer review
Peer reviewer comments 3
Editor who approved publication: Prof. Dr. Juei-Tang Cheng
Zelin Li,1,2 Cuijuan Qi,1 Zhuoya Jia,1,2 Ruoxi Zhen,1,2 Lin Ren,1,3 Yujiao Jia,1,2 Shuchun Chen1,2,4
1Graduate School of Hebei Medical University, People’s Republic of China; 2Department of Endocrinology, Hebei General Hospital, People’s Republic of China; 3North China University of Science and Technology, People’s Republic of China; 4Hebei Key Laboratory of Metabolic Diseases, People’s Republic of China
Correspondence: Shuchun Chen, Department of Endocrinology, Hebei General Hospital, 348 Heping West Road, 050051, People’s Republic of China, Tel +86 031185988406, Fax +86 031185988406, Email [email protected]
Purpose: To study the correlation between estimated glucose disposition rate (eGDR) and coagulation parameters in type 2 diabetes patients (T2DM).
Materials and Methods: A total of 948 patients suffering from T2DM were enrolled for this research. Various blood coagulation parameters including prothrombin time (PT), activated partial thromboplastin time (APTT), and fibrinogen (FIB) were assessed. Body mass index (BMI), hypertension, and the levels of glycated hemoglobin (HbA1c) were used to calculate the patients’ eGDRs. All patients were sorted into two groups: those with high eGDRs (eGDR≥ 7.5) and those with low eGDRs (eGDR< 7.5). The patients were then separated into groups of men and women. The connection between eGDR and coagulation indexes was examined using Spearman correlation, Pearson correlation, and multiple linear regression analysis.
Results: In comparison to the high-eGDR group, reduced PT and APTT levels with increased FIB levels were observed in the low-eGDR group (P =0.006, P < 0.001, and P = 0.035, respectively). The eGDR showed a positive relation with APTT (r = 0.142, P < 0.001), a negative relation with FIB (r = − 0.082, P = 0.012), and no correlation with PT (r =0.064, P =0.050) in the all patients. As well as, the eGDR demonstrated a positive relation with APTT (r = 0.173, P < 0.001), a negative relation with FIB (r = − 0.093, P = 0.03), and no relation with PT (r = 0.045, P = 0.300) in the male subgroups. Additionally, this correlation persisted following the adjustment of other factors in multilinear regression analysis. However, the female subgroup demonstrated no correlation among eGDR and PT, APTT or FIB (r = 0.086, P = 0.083, r = 0.097, P = 0.05;r = − 0.058, P = 0.240, respectively).
Conclusion: Our study is the first to prove that eGDR demonstrates a correlation with coagulation indexes in T2DM patients. And, this correlation is gender-specific.
Keywords: estimated glucose disposal rate, coagulation indexes, type 2 diabetes mellitus
Introduction
A highly prevalent endocrine disorder in clinical practice is Type 2 diabetes mellitus (T2DM), which may cause a series of complications, including coronary diabetic nephropathy, diabetic peripheral neuropathy, and diabetic retinopathy. The primary pathophysiology of T2DM is believed to be insulin resistance (IR), and almost all T2DM patients suffer from IR.1 Currently, For IR measurement, the hyperinsulinemic-euglycemic clamp is considered the gold standard.2 But, the high glucose clamp test is an invasive procedure and is not appropriate for clinicians. The Homeostasis Model Assessment of IR (HOMA-IR) was employed in clinics to evaluate IR. But the utilization of exogenous insulin makes this index have some errors.
Therefore, the Estimated Glucose Disposal Rate (eGDR), a simple, calculated based on three clinical factors was developed to assess insulin resistance in diabetic patients.3 On the basis of glycated hemoglobin (HbA1c) levels, BMI, and the presence of hypertension, the eGDRs of the patients were computed. Previously, eGDR was employed for assessing the IR in patients suffering from type 1 diabetes mellitus (T1DM). Therefore, eGDR can be employed to evaluate IR in patients using insulin. It was found that in patients suffering from type 1 diabetes (T1DM), lower eGDR levels were correlated to elevated diabetic microvascular complications, macrovascular complications, and mortality.2,4–5 Lately, Alexander Zabala et al revealed that eGDR also can reflect IR in patients with type 2 diabetes.6 Moreover, eGDR also has a predictive value. Several studies have found that low eGDR levels are an independent predictor of increased risk of death in patients with T2DM.6,7 Patients were considered to have IR when the level of eGDR value was <7.5.8 eGDR is a continuous index, and it is simple and easy to obtain. In clinical, it is an indicator to assess IR in patients with T2DM, than HOMA-IR, insulin requirement.
Atherosclerotic thrombosis is the predominant cause of death in patients suffering from T2DM, with approximately 80–90% of deaths due to thrombotic complications and 75% deaths due to cardiovascular complications.9 There are many risk factors that can promote thromboses, such as hypercoagulable state and vascular injury. Prothrombin time (PT), activated partial thrombin time (APTT), and fibrinogen (FIB) tests are standard screening tests for coagulation system function. Clinically, PT, APTT, and FIB should be detected in all suspected abnormal coagulation patients with T2DM. Studies have found that the pro-thrombotic state was associated with IR in patients with T2DM.10,11 And, there are conflicting results on the correlation between IR and coagulation indexes. A study has found that insulin sensitivity showed a positive correlation with APTT and a negative correlation with FIB, but there was no correlation between insulin sensitivity and PT.12 Further, studies found that HOMA-IR was positively correlated with FIB,13,14 but one study found no correlation between HOMA-IR and FIB.15
To date, no study explored the correlation between eGDR and PT, APTT, and FIB among patients with T2DM. This study verified the correlation between eGDR and coagulation indexes and investigated whether eGDR could be employed for assessing pro-thrombotic status in T2DM patients.
Materials and Methods
Study Population
This cross-sectional research was executed at the Hebei General Hospital between December 2019 and December 2021. Nine hundred forty-eight T2DM patients who met the WHO (1999) diagnostic criteria for DM were included.16 Patients suffering from renal or hepatic dysfunction and/or with a malignant tumor, and those consuming drugs affecting coagulation function were excluded. This research conforms to the Declaration of Helsinki. All the patients were informed about the study and procedures and they voluntarily provided signed consent prior to enrollment in the research. The study was performed according to the declaration of Helsinki and was approved by the medical ethics committee of Hebei General Hospital.
Information and Biomarkers Collection
A questionnaire was completed by each participant in order to gather fundamental information, such as gender, age, and length of illness. A professional took two measurements of the subject’s height and weight, recording the average. Blood samples from the patients were obtained following an 8-hour fast. The levels of aspartate aminotransferase (AST), alanine aminotransferase (ALT), total cholesterol (TC), triglyceride (TG), high-density lipoprotein cholesterol (HDL-C), low-density lipoprotein cholesterol (LDL-C), serum creatinine (Scr), blood urea nitrogen (BUN), fasting blood glucose (FBG), HbA1c, PT, APTT and FIB were measured.
Calculation of Parameters
Body mass index (BMI) = weight(Kg)/ height (m)2;
The below given formulas were used to determine eGDR utilizing a composite of BMI, HbA1c, and hypertensive status: eGDR = 19.02 - [0.22 × BMI (Kg/m2)] - (3.26 × HTN) - (0.61 × HbA1c (%)], wherein HTN represents hypertension (1 = yes, 0 = no).7 Systolic blood pressure (BP) of more than or equal to 140 mmHg and diastolic BO of more than or equal to 90 mmHg were considered indicators of hypertension.17
Statistical Analysis
Statistical Product and Service Solutions (SPSS V.25.0) was used for statistical analysis during this study. The Kolmogorov–Smirnov test was used to assess the distribution normality. Continuous data were represented as mean ± standard deviation (SD) or median (interquartile range) values. Data were presented as numbers for categorical variables (percentages). The Mann–Whitney test or Student’s t-test was employed for comparing the biochemical parameters among the two groups. For comparing the categorical variables, a χ2 test was utilized. Spearman or Pearson correlation analysis analyzed the correlation between variables and eGDR. The Multiple linear regression analysis was employed for studying the correlation between variables and eGDR. P-values less than 0.05 were regarded as statistically significant.
Results
Clinical Characteristics of All Participants
This research included 948 patients suffering from T2DM (409 men and 539 women). The median age was 58.00 years, the median diabetes duration was 8 years, and the median BMI was 26.03 Kg/m2. The low-eGDR group (eGDR<7.5) has 585 patients and the high-eGDR group (eGDR≥7.5) has 363 patients. The median PT level of 10.60s, the median APTT level of 25.80s, and the median FIB level of 2.84 g/L (Table 1).
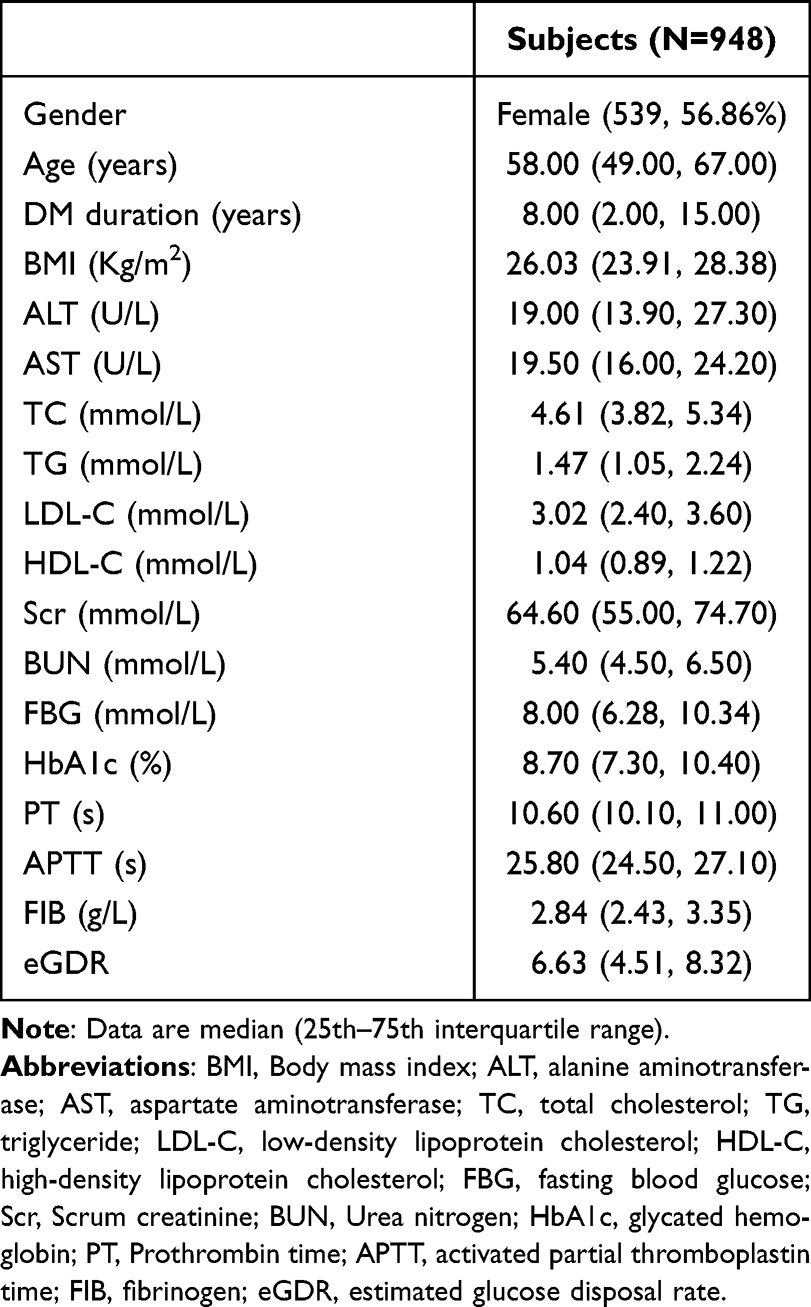 |
Table 1 Clinical Characteristics of All Participants |
Comparison of Basic Parameters Among the Low and High-eGDR Groups
The PT and APTT levels were considerably reduced in the low- eGDR group in comparison to the high-eGDR group (P =0.006, P <0.001, respectively), while the FIB levels were substantially elevated (P = 0.035). Figure 1 demonstrates the variation in coagulation index among the low- and high-eGDR groups.
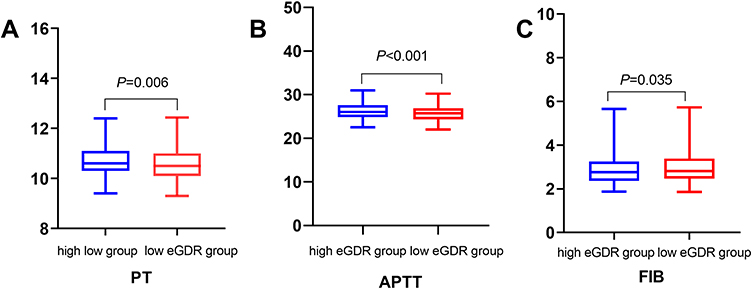 |
Figure 1 Comparison of coagulation indexes between low eGDR group and high eGDR group. (A) Comparison of the levels of PT between low eGDR group and high eGDR group. (B) Comparison of the levels of APTT between low eGDR group and high eGDR group. (C) Comparison of the levels of FIB between low eGDR group and high eGDR group. |
In comparison to the low-eGDR group, the high-eGDR group had lower FBG and HbA1c levels and higher TC, TG, and LDL-C levels (Table 2).
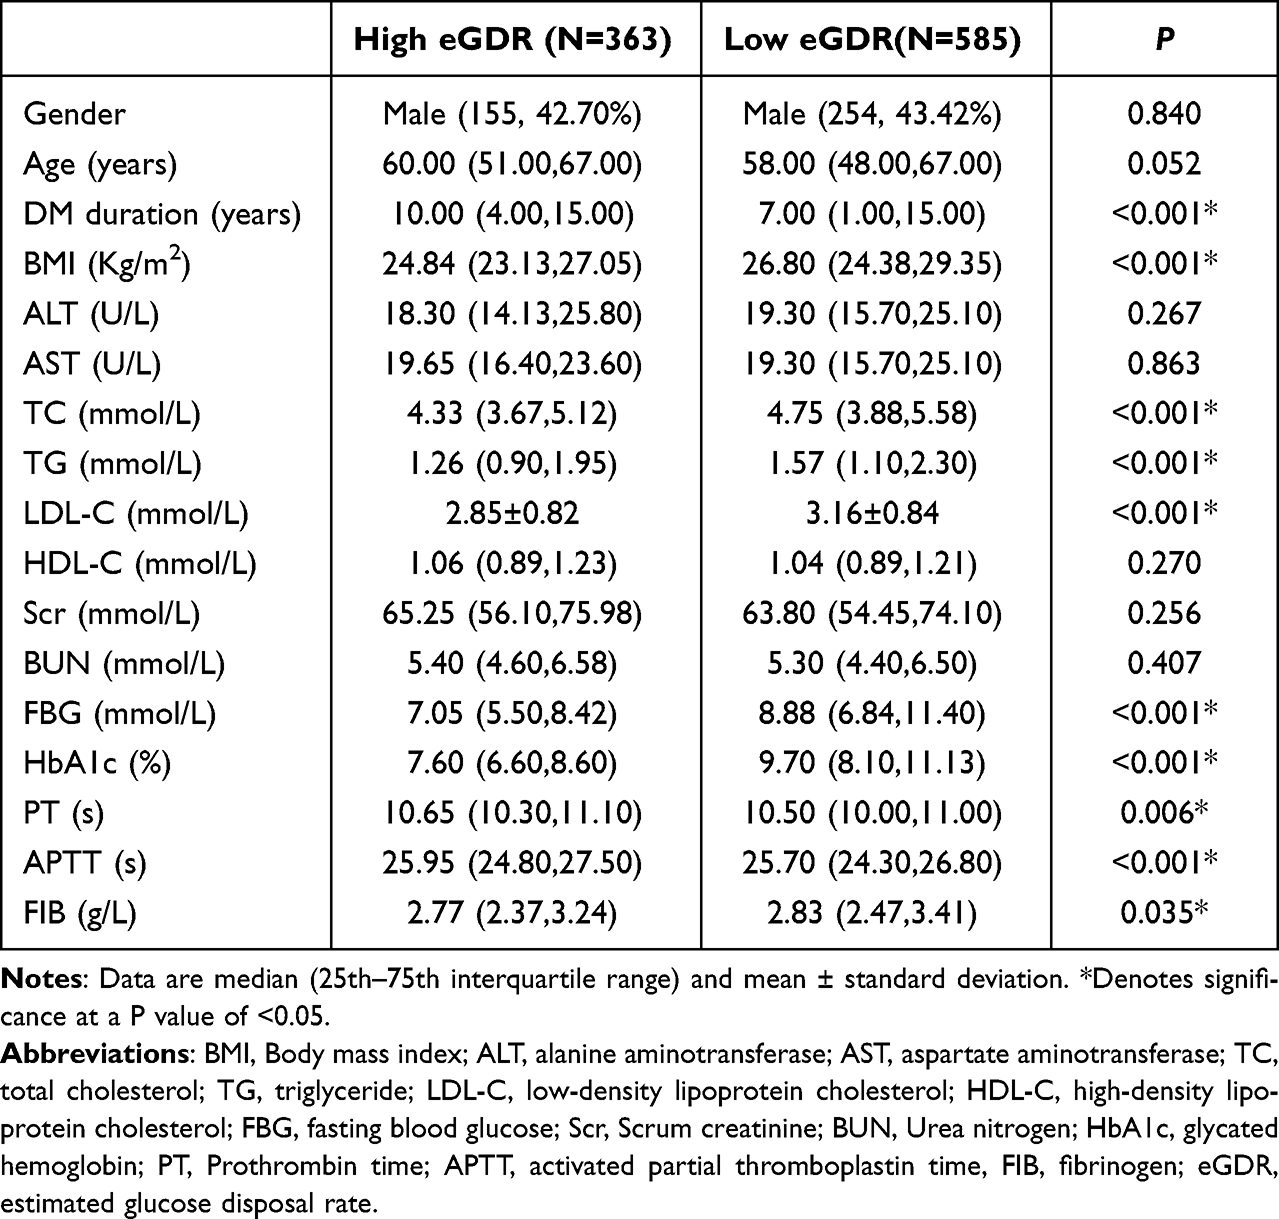 |
Table 2 Comparison of Indicators Between the Low eGDR and High eGDR Groups |
Basic Parameter Comparison Among the Male and Female Groups
In comparison to male group, the female group had reduced FIB levels (P <0.001) and elevated APTT levels (P <0.001). The PT and eGDR, however, did not considerably differ among the two groups (P =0.062, P =0.238, respectively). Figure 2 demonstrates the variation in coagulation index among the male and female groups.
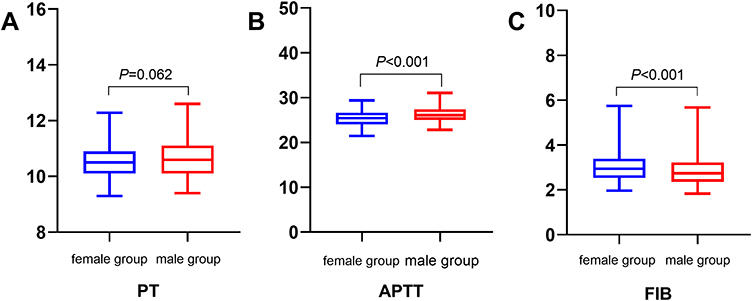 |
Figure 2 Comparison of coagulation indexes between male group and female group. (A) Comparison of the levels of PT between male group and female group. (B) Comparison of the levels of APTT between male group and female group. (C) Comparison of the levels of FIB between male group and female group. |
The female group had a higher median age and higher levels of TC and LDL in comparison with the male group. The male group had increased Scr levels than the female subgroup did (Table 3).
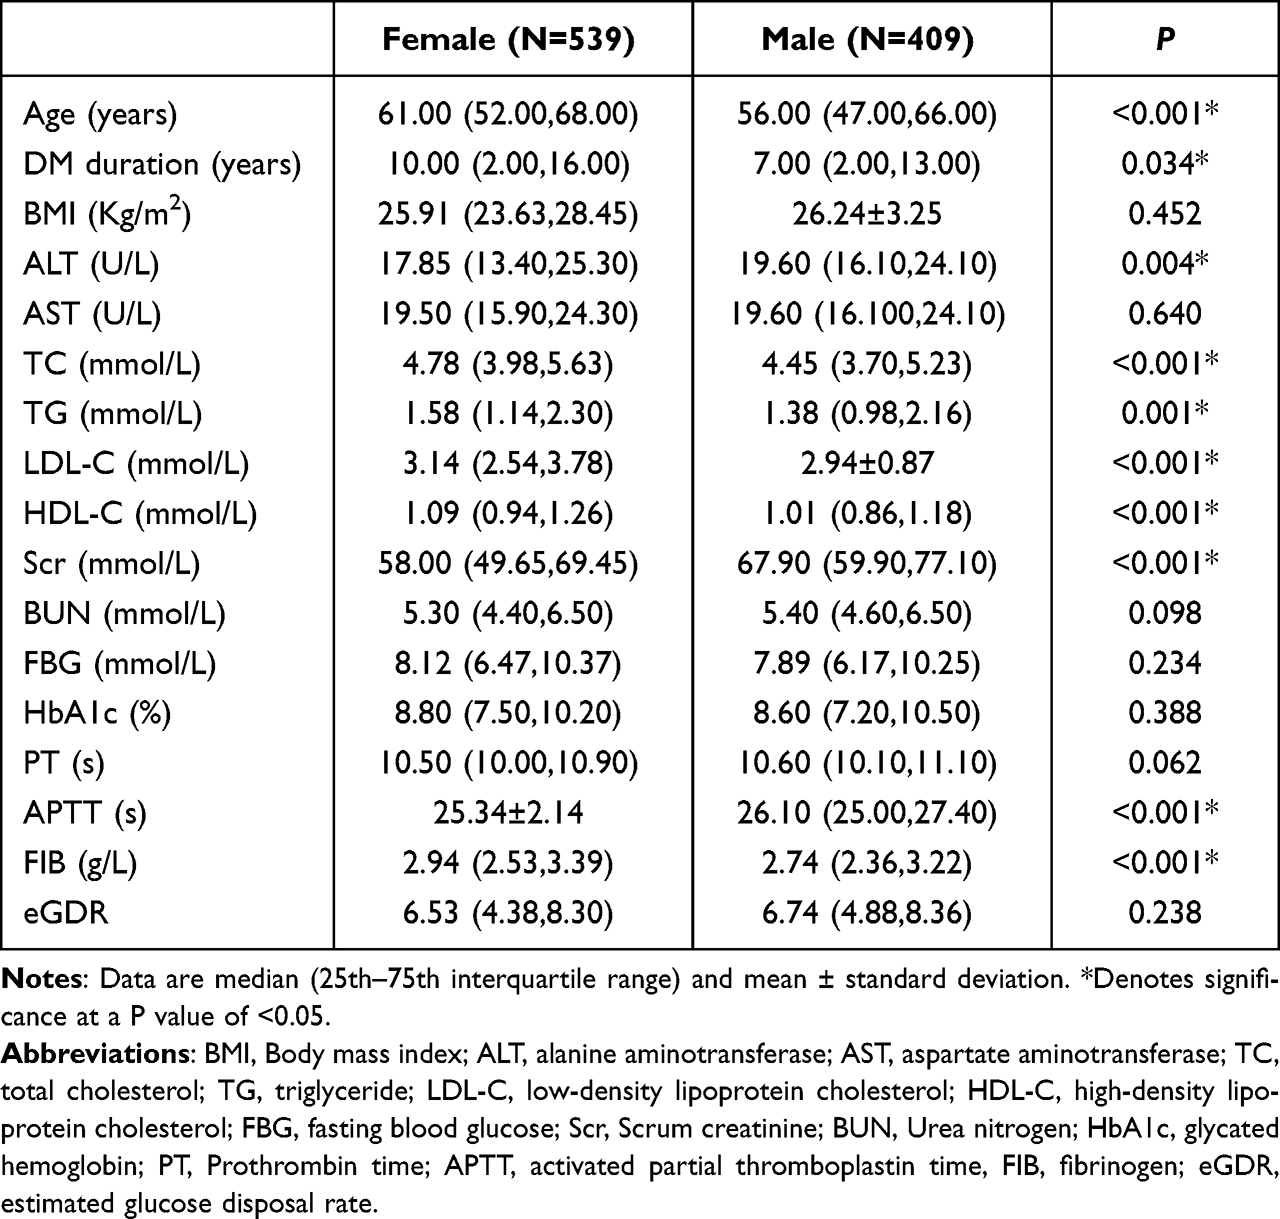 |
Table 3 Comparison of Indicators Between the Male and Female Groups |
Analysis of the Relationship Between eGDR and Coagulation Index Levels in T2DM Patients
In all T2DM patients, eGDR had a positive correlation with APTT (r = 0.142, P < 0.001) and a negative relation with FIB (r = −0.082, P = 0.012), while there was no correlation among the eGDR and PT (r =0.064, P =0.050) (Table 4, Figure 3).
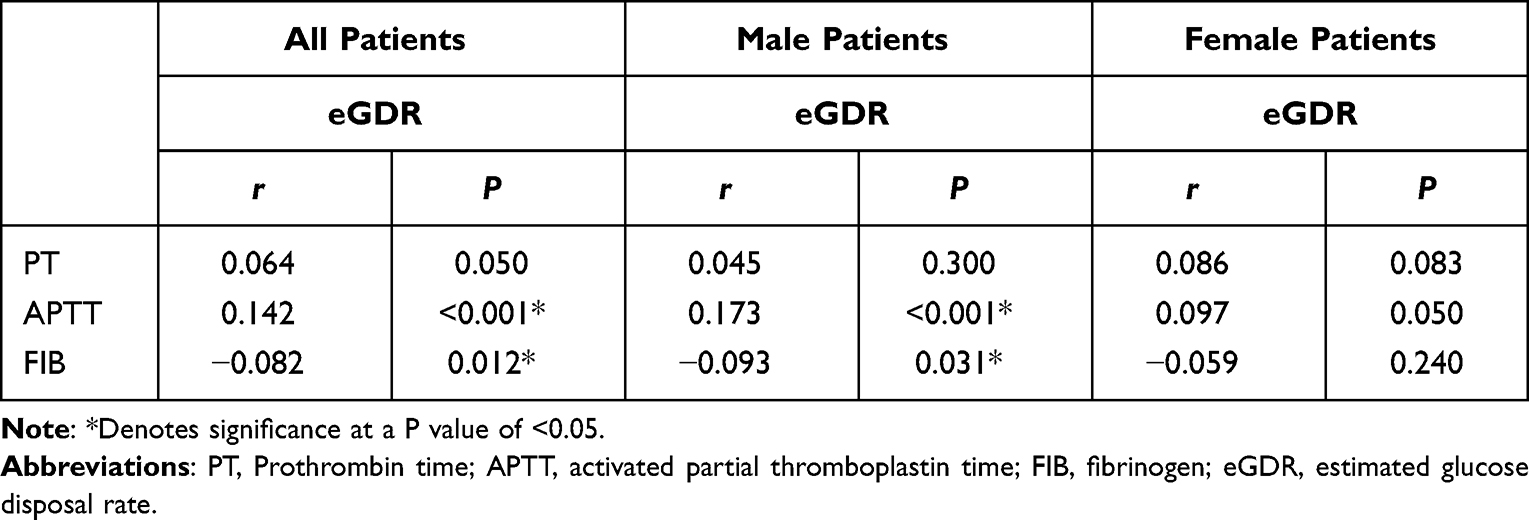 |
Table 4 The Correlation of eGDR and Coagulation Indexes in Patients with T2DM |
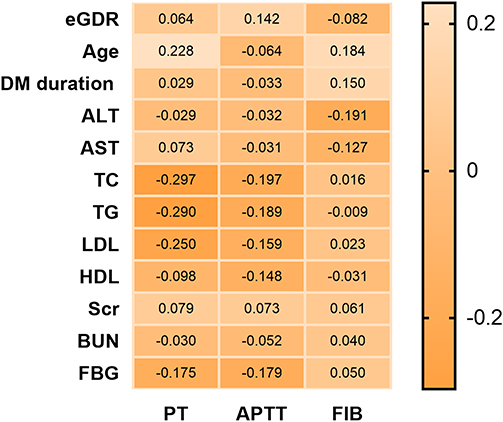 |
Figure 3 Spearman correlation coefficient matrix illustrating the association between coagulation indexes and baseline patient characteristics in all patients with T2DM. |
Similarly, eGDR demonstrated a positive relation with APTT (r = 0.173, P < 0.001) and a negative relation with FIB (r=−0.093, P = 0.031), with no correlation among eGDR and PT (r = 0.045, P = 0.300) in male patients suffering from T2DM (Table 4, Figure 4).
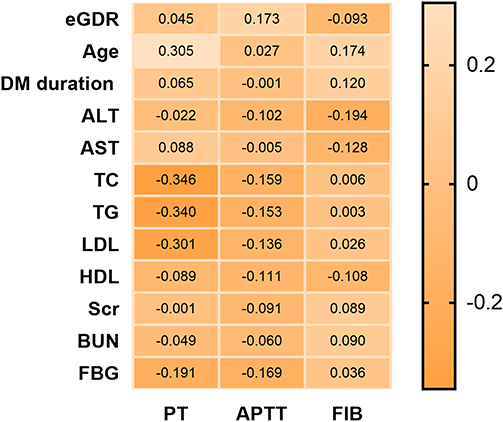 |
Figure 4 Spearman correlation coefficient matrix illustrating the association between coagulation indexes and baseline patient characteristics in male patients with T2DM. |
However, in female T2DM patients, eGDR was not related to PT, APTT, or FIB levels (r = 0.086, P = 0.083, r = 0.097, P = 0.050;r = −0.058, P = 0.240, respectively) (Table 4, Figure 5).
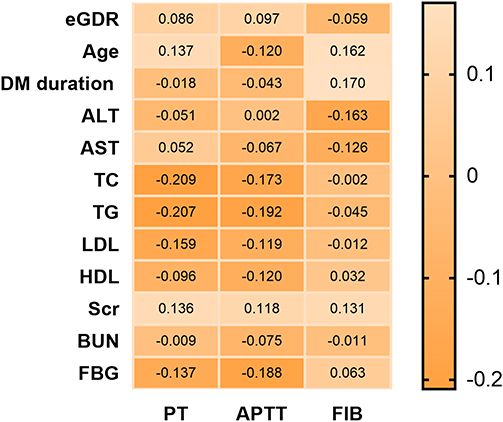 |
Figure 5 Spearman correlation coefficient matrix illustrating the association between coagulation indexes and baseline patient characteristics in female patients with T2DM. |
Multivariate Linear Correlation Analysis of eGDR and BTMs in T2DM Patients
The eGDR had a positive correlation with APTT (β=0.101, P=0.002) and a negative relation with FIB (β=−0.046, P=0.002), while there was not any correlation between eGDR and PT (β=−0.002, P=0.839) in all patients with T2DM following the adjustment of confounding factors which included age, the time period of diabetes, TC, TG, HDL-C, LDL-C, ALT, AST, Scr, BUN, FBG.
The eGDR demonstrated a positive relation with APTT (β=0.120, P=0.004) and a negative relation with FIB (β=−0.048, P=0.014), with no correlation among eGDR and PT (β=0.004, P=0.799) in male patients with T2DM following the adjustment of confounding factors which included age, the time period of diabetes, TC, TG, HDL-C, LDL-C, ALT, AST, Scr, BUN, FBG.
However, irrespective of whether confounding factors were adjusted or not, eGDR was not related to PT, APTT, or FIB levels in female T2DM patients (β=−0.011, P=0.491; β=0.059, P=0.235; β=−0.041, P=0.057, respectively).
Discussion
It is a valuable indicator to assess IR in clinical practice. We used an eGDR of less than 7.5 as the boundary to divide all T2DM patients into two groups: high and low eGDR. In comparison to the high-eGDR group, reduced PT and APTT levels along with increased FIB levels were observed in the low-eGDR group. In this study, it was found for the first time that eGDR had a positive correlation with APTT and a negative correlation with FIB, and this correlation was not affected by confounding factors. Additionally, the correlation between eGDR and coagulation index was gender-specific. There was no correlation between eGDR and PT, APTT, or FIB among female patients with T2DM. Decreased APTT and increased FIB levels reflect a hypercoagulable state, which can cause increased thrombosis.
Almost all patients suffering from T2DM exhibit IR, and patients always have a hypercoagulable state. HOMA-IR and coagulation parameters are not routinely measured in T2DM patients in grassroots hospitals. On the basis of clinical factors, the eGDR is a measure of IR. eGDR is easy to obtain for clinicians. In male T2DM patients, we discovered that eGDR was correlated negatively with FIB and positively with APTT. This result suggests that we should pay more attention to male T2DM patients with low eGDR levels in clinical practice.
T2DM patients always have a hypercoagulable state. The changes in coagulation indexes (PT, APTT, FIB) were observed in T2DM patients and patients with complications. Compared with controls, patients with T2DM had lower PT and APTT levels,18–29 and had higher FIB levels.9 However, one study reported normal APTT and PT,20 and some other studies reported significantly prolonged APTT and PT among patients with T2DM.21 Compared to patients without complications with T2DM, patients with microvascular complications such as retinopathy, nephropathy, or neuropathy with T2DM had lower PT and APTT levels and higher FIB levels.22
The coagulation system consists of a series of coagulation proteins. When the coagulation proteins are activated, the prothrombin complexes are produced, which in turn produce thrombin and fibrinogens. IR is associated with the pro-thrombotic state. IR can alter and upregulate gene expression pathways involving coagulation proteins, which can cause increased production of coagulation factors (including FIB, FVII, FVIII, FXII, FXIII) and fibrinogen activator inhibitor type 1 (PAI-1), resulting in a pro-thrombotic state.23 In addition, the patients with insulin resistance have more visceral fat.24 Visceral fat has been found to be associated with increased activity of FVII, FVIII, and FIX.12 Chronic insulin resistance can also cause hyperglycemia. Hyperglycemia can alter vascular endothelial vulnerability and increase the release of coagulation factor, and therefore, triggers occlusive thrombus formation.25 However, there are still no reports on the correlation between eGDR and coagulation indexes.
PT is the most commonly used screening test for exogenous coagulation abnormalities. It reflects coagulation factors I, II, VII, and X activity. The exogenous coagulation pathway begins with the activation of coagulation factor VII. Coagulation factor VII is a vitamin-dependent serine protease that binds to tissue factor (TF), leading to increased thrombin production and fibrin formation. The levels of FVII are increased in a pre-thrombotic state in patients with T2DM.26 In addition, the Northwick Park Cardiology Study (NPHS) found that FVII levels were linked to fatal coronary heart disease complications.27–29 This research is the first to find no correlation between eGDR and PT, but then the mechanism is unknown.
APPT is the most commonly used screening test for intrinsic coagulation abnormalities. It mainly reflects the activity of coagulation factors VIII, IV, XI, and XII. The intrinsic coagulation pathway first activates FXII. In patients with ischemic heart disease, FVII levels were associated with the degree of coronary artery stenosis, and the levels of FVII correlated with TG, BMI, and insulin levels.29 TG was found to be an independent effector of FXII, and TG can reinforce the potential association of FXII with the features of IR and T2DM.30 In this study, we found for the first time that eGDR had a positive relation with APTT, and this positive relationship persisted even after adjusting for confounding factors such as TC, TG, and FBG. The current research implies that patients having low eGDR levels are prone to thrombosis due to the activation of intrinsic coagulation pathways.
FIB is a heterodimer synthesized by the liver and is an essential component of the coagulation pathway. Increased FIB levels can cause increased blood viscosity, stimulate platelet aggregation, and enhance coagulation factor activity.31 FIB can also stimulate the proliferation of smooth muscle, promote collagen synthesis in smooth muscle, and downregulate the amount of nitric oxide (NO) synthase in smooth muscle cells, which can inhibit the production of NO, thus participating in atherosclerosis.32,33 Prospective epidemiological findings suggest that increased FIB levels were an independent risk factor for cardiovascular disease.34 IR is thought to increase FIB levels by raising plasminogen activator inhibitor-I levels.35 Moreover, hyperglycemia can cause increased glycosylated fibrinogen formation. It alters the way that fibrin structures work, resulting in clots with denser structures that are resistant to fibrinolysis.7 Our study found a negative correlation between eGDR and FIB levels for the first time. It is suggested that patients with lower eGDR levels are more likely to suffer from thrombosis and cardiovascular disease in the future.
Additionally, there was a gender-specific correlation between eGDR and coagulation index. In comparison to the female group, the male group showed greater FIB and reduced APTT levels. The PT and eGDR, however, did not significantly differ among both the groups. However, it is stunning that there was no correlation between eGDR and PT, APTT, or FIB among female patients with T2DM. In the study, Multiple linear analyses was employed to exclude the effects of lipids and glucose confounders.However, in female patients with T2DM, eGDR still had no correlation with coagulation indexs. This gender difference may be due to the different estrogen levels of the patients. Estrogen has antioxidant activity that reduces insulin resistance. In addition, estrogen can decrease PAI-1 levels, promote fibrin degradation, and reduces the formation of FIB.36
The present research is the first to reveal a relation between eGDR and coagulation index in T2DM patients, and this relation was independent of confounding factors. eGDR is easy to obtain and continuous variaties. Assessing the pre-thrombotic status of T2DM patients is a good indicator, particularly in male T2DM patients. Patients with reduced eGDR levels are at higher risk of thrombosis, requiring early intervention and regular follow-up to reduce cardiovascular complications. However, the statistical differences are minimal. This may suggest that we need to pay more attention to patients with low eGDR levels, but this should not assume that patients with low eGDR levels are susceptible to coagulopathy.
There were certain limitations in this research. First, because the present research was designed to be cross-sectional, it was impossible to determine what caused the correlation between eGDR and coagulation indexes. Secondly, the coagulation factors such as I, VII, VIII, and XII were not detected in this study, so the correlation between eGDR and coagulation factors could not be clarified. And, it was not collected whether patients had deep vein thrombosis, and the correlation between eGDR and deep vein trombosis could not be explored. Last but most important, the serum sex hormone levels of patients with T2DM were not tested in this study, so it could not be determined whether the gender difference in the correlation between eGDR and coagulation indexes was caused by different-sex hormone levels.
In conclusion, we found the correlation among eGDR and APTT and FIB, and this correlation is gender-specific.
Disclosure
The authors report no conflicts of interest in this work.
References
1. Chang-Quan H, Bi-Rong D, Ping H, Zhen-Chan L. Insufficient renal 1-alpha hydroxylase and bone homeostasis in aged rats with insulin resistance or type 2 diabetes mellitus. J Bone Miner Metab. 2008;26(6):561–568. doi:10.1007/s00774-008-0867-z
2. Nishtala R, Kietsiriroje N, Karam M, Ajjan RA, Pearson S. Estimated glucose disposal rate demographics and clinical characteristics of young adults with type 1 diabetes mellitus: a cross-sectional pilot study. Vascular Dis Res. 2020;17(5):1479164120952321. doi:10.1177/1479164120952321
3. Williams KV, Erbey JR, Becker D, Arslanian S, Orchard TJ. Can clinical factors estimate insulin resistance in type 1 diabetes? Diabetes. 2000;49(4):626–632. doi:10.2337/diabetes.49.4.626
4. O’Mahoney LL, Kietsiriroje N, Pearson S. Estimated glucose disposal rate as a candidate biomarker for thrombotic biomarkers in T1D: a pooled analysis. J Endocrinol Investig. 2021;44(11):2417–2426. doi:10.1007/s40618-021-01550-3
5. Chillarón JJ, Goday A, Flores-Le-Roux JA, et al. Estimated glucose disposal rate in assessment of the metabolic syndrome and microvascular complications in patients with type 1 diabetes. J Clin Endocrinol Metab. 2009;94(9):3530–3534. doi:10.1210/jc.2009-0960
6. Zabala A, Darsalia V, Lind M, et al. Estimated glucose disposal rate and risk of stroke and mortality in type 2 diabetes: a nationwide cohort study. Cardiovasc Diabetol. 2021;20(1):202. doi:10.1186/s12933-021-01394-4
7. Nyström T, Holzmann MJ, Eliasson B, Svensson AM, Kuhl J, Sartipy U. Estimated glucose disposal rate and long-term survival in type 2 diabetes after coronary artery bypass grafting. Heart and Vessels. 2017;32(3):269–278. doi:10.1007/s00380-016-0875-1
8. Komosinska-Vassev K, Gala O, Olczyk K, Jura-Półtorak A, Olczyk P. The Usefulness of Diagnostic Panels Based on Circulating Adipocytokines/Regulatory Peptides, Renal Function Tests, Insulin Resistance Indicators and Lipid-Carbohydrate Metabolism Parameters in Diagnosis and Prognosis of Type 2 Diabetes Mellitus with Obesity. Biomolecules. 2020;10(9). doi:10.3390/biom10091304
9. Madan R, Gupt B, Saluja S, Kansra UC, Tripathi BK, Guliani BP. Coagulation profile in diabetes and its association with diabetic microvascular complications. J Assoc Physicians India. 2010;58:481–484.
10. Grant PJ. Diabetes mellitus as a prothrombotic condition. J Intern Med. 2007;262(2):157–172. doi:10.1111/j.1365-2796.2007.01824.x
11. Morange PE, Alessi MC. Thrombosis in central obesity and metabolic syndrome: mechanisms and epidemiology. Thromb Haemost. 2013;110(4):669–680. doi:10.1160/TH13-01-0075
12. Hörber S, Lehmann R, Stefan N, et al. Hemostatic alterations linked to body fat distribution, fatty liver, and insulin resistance. Mol Metab. 2021;53:101262. doi:10.1016/j.molmet.2021.101262
13. Yoshida K, Kimura T, Aoki T, et al. Fasting serum insulin levels and insulin resistance are associated with blood rheology in Japanese young adults without diabetes. J Int Med Res. 2016;44(3):496–507. doi:10.1177/0300060515627561
14. Temelkova-Kurktschiev T, Siegert G, Bergmann S, et al. Subclinical inflammation is strongly related to insulin resistance but not to impaired insulin secretion in a high risk population for diabetes. Metabolism. 2002;51(6):743–749. doi:10.1053/meta.2002.32804
15. Kahn SE, Zinman B, Haffner SM, et al. Obesity is a major determinant of the association of C-reactive protein levels and the metabolic syndrome in type 2 diabetes. Diabetes. 2006;55(8):2357–2364. doi:10.2337/db06-0116
16. Alberti KG, Zimmet PZ. Definition, diagnosis and classification of diabetes mellitus and its complications. Part 1: diagnosis and classification of diabetes mellitus provisional report of a WHO consultation. Diabetic Med. 1998;15(7):539–553. doi:10.1002/(SICI)1096-9136(199807)15:7<539::AID-DIA668>3.0.CO;2-S
17. National High Blood Pressure Education Program. The sixth report of the Joint National Committee on prevention, detection, evaluation, and treatment of high blood pressure. Arch Intern Med. 1997;157(21):2413–2446. doi:10.1001/archinte.1997.00440420033005
18. Ephraim RK, Awuku YA, Adu P, et al. High risk of coagulopathy among Type-2 Diabetes Mellitus clients at a municipal hospital in Ghana. Ghana Med J. 2017;51(3):101–107. doi:10.4314/gmj.v51i3.2
19. Sauls DL, Banini AE, Boyd LC, Hoffman M. Elevated prothrombin level and shortened clotting times in subjects with type 2 diabetes. J Thrombosis Haemostasis. 2007;5(3):638–639. doi:10.1111/j.1538-7836.2007.02366.x
20. Erem C, Hacihasanoğlu A, Celik S, et al. Coagulation and fibrinolysis parameters in type 2 diabetic patients with and without diabetic vascular complications. Med Principles Practice. 2005;14(1):22–30. doi:10.1159/000081919
21. Sapkota B, Shrestha SK, Poudel S. Association of activated partial thromboplastin time and fibrinogen level in patients with type II diabetes mellitus. BMC Res Notes. 2013;6:485. doi:10.1186/1756-0500-6-485
22. Agarwal C, Bansal K, Pujani M, et al. Association of coagulation profile with microvascular complications and glycemic control in type 2 diabetes mellitus - a study at a tertiary care center in Delhi. Hematol Transfusion Cell Therapy. 2019;41(1):31–36. doi:10.1016/j.htct.2018.05.002
23. Ebrahim H, Asrie F, Getaneh Z. Basic Coagulation Profiles and Platelet Parameters Among Adult Type 1 and Type 2 Diabetes Patients at Dessie Referral Hospital, Northeast Ethiopia: comparative Cross-Sectional Study. J Blood Med. 2021;12:33–42. doi:10.2147/JBM.S287136
24. Tonks KT, White CP, Center JR, Samocha-Bonet D, Greenfield JR. Bone Turnover Is Suppressed in Insulin Resistance, Independent of Adiposity. J Clin Endocrinol Metab. 2017;102(4):1112–1121. doi:10.1210/jc.2016-3282
25. Lemkes BA, Hermanides J, Devries JH, Holleman F, Meijers JC, Hoekstra JB. Hyperglycemia: a prothrombotic factor? J Thrombosis Haemostasis. 2010;8(8):1663–1669. doi:10.1111/j.1538-7836.2010.03910.x
26. Barillari G, Fabbro E, Pasca S, Bigotto E. Coagulation and oxidative stress plasmatic levels in a type 2 diabetes population. Blood Coagulation Fibrinolysis. 2009;20(4):290–296. doi:10.1097/MBC.0b013e328329e49b
27. Meade TW, Mellows S, Brozovic M, et al. Haemostatic function and ischaemic heart disease: principal results of the Northwick Park Heart Study. Lancet. 1986;2(8506):533–537. doi:10.1016/S0140-6736(86)90111-X
28. Meade TW, Ruddock V, Stirling Y, Chakrabarti R, Miller GJ. Fibrinolytic activity, clotting factors, and long-term incidence of ischaemic heart disease in the Northwick Park Heart Study. Lancet. 1993;342(8879):1076–1079. doi:10.1016/0140-6736(93)92062-X
29. Kohler HP, Stickland MH, Ossei-Gerning N, Carter A, Mikkola H, Grant PJ. Association of a common polymorphism in the factor XIII gene with myocardial infarction. Thromb Haemost. 1998;79(1):8–13. doi:10.1055/s-0037-1614250
30. Dunn EJ, Grant PJ. Type 2 diabetes: an atherothrombotic syndrome. Curr Mol Med. 2005;5(3):323–332. doi:10.2174/1566524053766059
31. Vinik AI, Erbas T, Park TS, Nolan R, Pittenger GL. Platelet dysfunction in type 2 diabetes. Diabetes Care. 2001;24(8):1476–1485. doi:10.2337/diacare.24.8.1476
32. Stary CM, Xu L, Li L, et al. Inhibition of miR-181a protects female mice from transient focal cerebral ischemia by targeting astrocyte estrogen receptor-α. Mol Cell Neurosci. 2017;82:118–125. doi:10.1016/j.mcn.2017.05.004
33. de Rivero Vaccari JP, Patel HH, Brand FJ 3rd, Perez-Pinzon MA, Bramlett HM, Raval AP. Estrogen receptor beta signaling alters cellular inflammasomes activity after global cerebral ischemia in reproductively senescence female rats. J Neurochem. 2016;136(3):492–496. doi:10.1111/jnc.13404
34. Ernst E, Resch KL, Uher EM. Reviewer bias. Ann Intern Med. 1992;116(11):958. doi:10.7326/0003-4819-116-11-958_2
35. Juhan-Vague I, Thompson SG, Jespersen J. Involvement of the hemostatic system in the insulin resistance syndrome. A Study of 1500 Patients with Angina Pectoris the ECAT Angina Pectoris Study Group. Arteriosclerosis Thrombosis. 1993;13(12):1865–1873.
36. Dab H, Hachani R, Hodroj W, Sakly M, Bricca G, Kacem K. Differential control of MMP and t-PA/PAI-1 expressions by sympathetic and renin-angiotensin systems in rat left ventricle. Autonomic Neurosci. 2009;150(1–2):27–32. doi:10.1016/j.autneu.2009.04.002
 © 2022 The Author(s). This work is published and licensed by Dove Medical Press Limited. The
full terms of this license are available at https://www.dovepress.com/terms
and incorporate the Creative Commons Attribution
- Non Commercial (unported, 3.0) License.
By accessing the work you hereby accept the Terms. Non-commercial uses of the work are permitted
without any further permission from Dove Medical Press Limited, provided the work is properly
attributed. For permission for commercial use of this work, please see paragraphs 4.2 and 5 of our Terms.
© 2022 The Author(s). This work is published and licensed by Dove Medical Press Limited. The
full terms of this license are available at https://www.dovepress.com/terms
and incorporate the Creative Commons Attribution
- Non Commercial (unported, 3.0) License.
By accessing the work you hereby accept the Terms. Non-commercial uses of the work are permitted
without any further permission from Dove Medical Press Limited, provided the work is properly
attributed. For permission for commercial use of this work, please see paragraphs 4.2 and 5 of our Terms.