Back to Journals » Infection and Drug Resistance » Volume 11
The correlation between CT features and glycosylated hemoglobin level in patients with T2DM complicated with primary pulmonary tuberculosis
Authors Xia L, Li SF, Shao K, Zhang X, Huang S
Received 19 July 2017
Accepted for publication 19 October 2017
Published 30 January 2018 Volume 2018:11 Pages 187—193
DOI https://doi.org/10.2147/IDR.S146741
Checked for plagiarism Yes
Review by Single anonymous peer review
Peer reviewer comments 2
Editor who approved publication: Professor Suresh Antony
Li-Li Xia,1,* Su-Fen Li,2,* Kan Shao,1 Xin Zhang,3 Shan Huang1
1Department of Endocrinology, Shanghai Tongren Hospital, Shanghai Jiao Tong University School of Medicine, Shanghai, People’s Republic of China; 2Department of Neurology, Huai’an Second People’s Hospital and The Affiliated Huai’an Hospital of Xuzhou Medical University, Huai’an, People’s Republic of China; 3Department of Radiology, The Fourth People’s Hospital of Huai’an, Huai’an, People’s Republic of China
*These authors contributed equally to this work
Abstract: To investigate the correlation between computed tomography (CT) features and glycosylated hemoglobin (HbAlc) levels in patients with type 2 diabetes mellitus (T2DM) complicated with primary pulmonary tuberculosis (PTB). One hundred and eighty untreated PTB patients complicated with T2DM were selected. Based on the HbAlc level, the patients were divided into three groups: HbAlc level <7% (Group I: 32 patients), 7%–9% (Group II: 48 patients), and >9% (Group III: 100 patients). The changes of CT manifestations and HbAlc were analyzed after TB and T2DM treatment. In the three groups, the detection rate of large segmented leafy shadow was 50%, 56.2%, and 87%; the air bronchogram sign detection rate was 40.6%, 47.9%, and 77%; the discovery rate of mouth-eaten cavity was 31.2%, 45.8%, and 65%; thick wall cavity detection rate was 25%, 31.2%, and 52%; the rate of multiple cavities was 34.3%, 50%, and 73%; and bronchial TB was found in 33.3%, 21.8%, and 46%, respectively. The detection rates of lesions in Group III were significantly higher than in Group II and Group I (p<0.05), and this increase was significant (p<0.05). After treatment, the HbAlc level reached control target (<7%) among all three groups and CT absorption improvement rates were 100%, 72.9%, and 56% respectively. The therapeutic efficacy of group I was better than group II (p<0.01), and the treatment efficacy of group II was better than group III (p<0.05). CT manifestations of T2DM complicated with PTB were closely related to HbAlc level. The effect is better when HbAlc level <7%. HbAlc level effectively reflects the severity and therapeutic effect to a certain extent. CT scan can provide some important information for clinical imaging. The above two examinations can guide clinicians to formulate the appropriate diagnosis and treatment in a timely manner.
Keywords: T2DM, primary pulmonary tuberculosis, CT, HbAlc
Introduction
Primary pulmonary tuberculosis (PTB) is a serious threat to human health. According to the “Global Tuberculosis Report 2016” of the World Health Organization, in 2015, there were an estimated 10.4 million new (incident) TB cases worldwide.1 The rapid increase in TB morbidity where diabetes mellitus (DM) is epidemic indicates that DM may be a risk factor.2 Recent studies have also shown that TB in patients with DM compared to those without DM displays a different clinical manifestation and clinical outcome.3,4 However, there are still some studies showing that DB does not affect TB.5–9 Although the association between TB and DM has been described and researched for centuries, the correlation between computed tomography (CT) imaging features and glycosylated hemoglobin (HbAlc) levels in type 2 diabetic patients (T2DM) with PTB has not been thoroughly studied. Song et al10 conducted a study to investigate the CT imaging features for T2DM patients with multidrug-resistant TB, (defined as TB strains resistant to at least isoniazid and rifampin). They found consolidation in or above multiple pulmonary segments with multiple mouth-eaten cavities and bronchial damage on CT images in T2DM patients with TB, suggesting the possibility of multidrug resistance. Also, Kim et al11 aimed to assess CT features of PTB and TB pleurisy in DM patients and to evaluate the effect of duration of DM on CT imaging findings of PTB and TB pleurisy. The study from Kim suggested that involvement of all lobes, bilateral pulmonary involvement, and lymph node enlargement are significantly more common CT features in TB patients with DM than in those without DM. It is well known that TB and DM can be controlled, and the relationship between these two diseases is not particularly clear. Huang et al12 evaluated the impact of glycemic status on CT findings of PTB in DM patients as well. They suggested that glycemic status influenced radiological manifestations of PTB with DM as there was an increased risk of atypical radiological presentations of PTB in DM patients. In order to reduce the risk of misdiagnosis due to atypical radiologic findings in TB DM patients, physicians should be alert enough to pay more attention to PTB patients with poor glycemic control.
This study analyzed the imaging and clinical features of 180 T2DM patients with PTB and without HIV infection or other pulmonary complications (chronic obstructive pulmonary diseases or any other lung diseases) from April 1, 2012 to March 31, 2015. This analysis investigated the correlation between CT imaging features and HbAlc levels in patients with T2DM complicated with PTB.
Patients and methods
Patients
This imaging study was conducted in the Huai’an Infectious Disease Hospital. From April 1, 2012 to March 31, 2015; 189 patients (aged 23–86 years) with the diagnosis of primary pulmonary TB complicated with T2DM were screened, and complete medical data were available for research review and analysis. All subjects in the study were HIV negative. This study was approved by the ethics committee of the Huai’an Infectious Disease Hospital; all methods were performed in accordance with the relevant guidelines and regulations, all patient data were analyzed for anonymity, and therefore, according to the ethics committee of the Huai’an Infectious Disease Hospital, no additional informed consent was required.
The clinical data of all patients included age, gender, smoking, alcohol abuse, the time interval, and HbA1c level at the first diagnosis of DM and TB. Inclusion criteria were as follows: 1) fulfilling the criteria for clinical diagnosis of diabetes; 2) fulfilling at least one of the following four points for diagnosis of TB: 1) sputum smear and (or) sputum cultures positive, 2) bronchoscopy brush biopsy positive, 3) percutaneous lung biopsy or bronchoscopy confirmed pathologically, 4) typical TB clinical symptoms and chest CT manifestations, excluding other nontuberculous pulmonary disease, and anti-TB treatment is effective. Patients were excluded if they could not use first-line anti-TB drugs due to abnormal hepatic laboratory tests.
Based on the HbAlc level detection results and Chinese type 2 diabetes prevention and treatment guidelines (2013 version),13 all patients were divided into three groups: HbAlc level <7% is the group with good blood glucose control (Group I, n=32), HbAlc level from 7% to 9% is group in which blood glucose is generally well controlled (Group II, n=48), and HbAlc level >9% is group with poor control (Group III, n=100). Based on the presence of cough, sputum, hemoptysis, fever, symptom score, night sweats, and weight loss (one point per item), we define a higher symptom score when patients present with at least four of these symptoms.
CT image acquisition
All patients in our study underwent CT imaging scan when they were first diagnosed, and changes in CT manifestations and HbA1c level were analyzed after anti-TB treatment. The CT examination was performed with a Germany SIEMENS spirit spiral CT scanner. After patients inhale a deep breath, CT scan was started with the range from apex to both sides of the lower edge of the costophrenic angle. The conventional scan layer thickness is 6 mm, some cases underwent high-resolution CT scan, with a thickness of layer of 2 mm. The tube ball voltage was 130 kV and the tube ball current was 175–250 mA.
The primary outcome was differences in radiographic findings and final treatment outcomes. The CT images were recorded and examined by two TB experts and two radiologists blinded to status of diabetes control, and consensus was reached. The position, size, shape, cavity, calcification, bronchus, lymph nodes, and pleural effusion were observed and analyzed.
Statistical methods
Statistical analyses were performed using SPSS 21.0 (SPSS Inc., Chicago, IL, USA). Measurement data for variables with normal distributions (age, body mass index and HbA1c level) were compared using independent t-test, and those without normal distributions, such as the number of involved lobes, were compared using nonparametric tests. The count data were compared using a χ2 test, and the ranked data were compared using a nonparametric rank sum test. The imaging risk factors related to DM TB were analyzed using binary multivariate logistic regression analysis. p<0.05 was considered as statistically significant.
Results
Characteristics of the clinical data for T2DM TB patients
Patient enrollment started on April 1, 2012, and a total of 180 TB patients were screened before March 31, 2015. Among 180 new PTB patients with T2DM, none were excluded due to missing data or any other reason. And so, finally, 180 cases were included in our study. All 180 patients were diagnosed previously with T2DM during the workup of PTB. Based on the HbAlc level detection results and Chinese type 2 diabetes prevention and treatment guidelines (2013 version),13 all patients were divided into three groups: HbAlc level <7% (Group I, n=32), HbAlc level from 7% to 9% (Group II, n=48), and HbAlc level >9% (Group III, n=100) (Table 1).
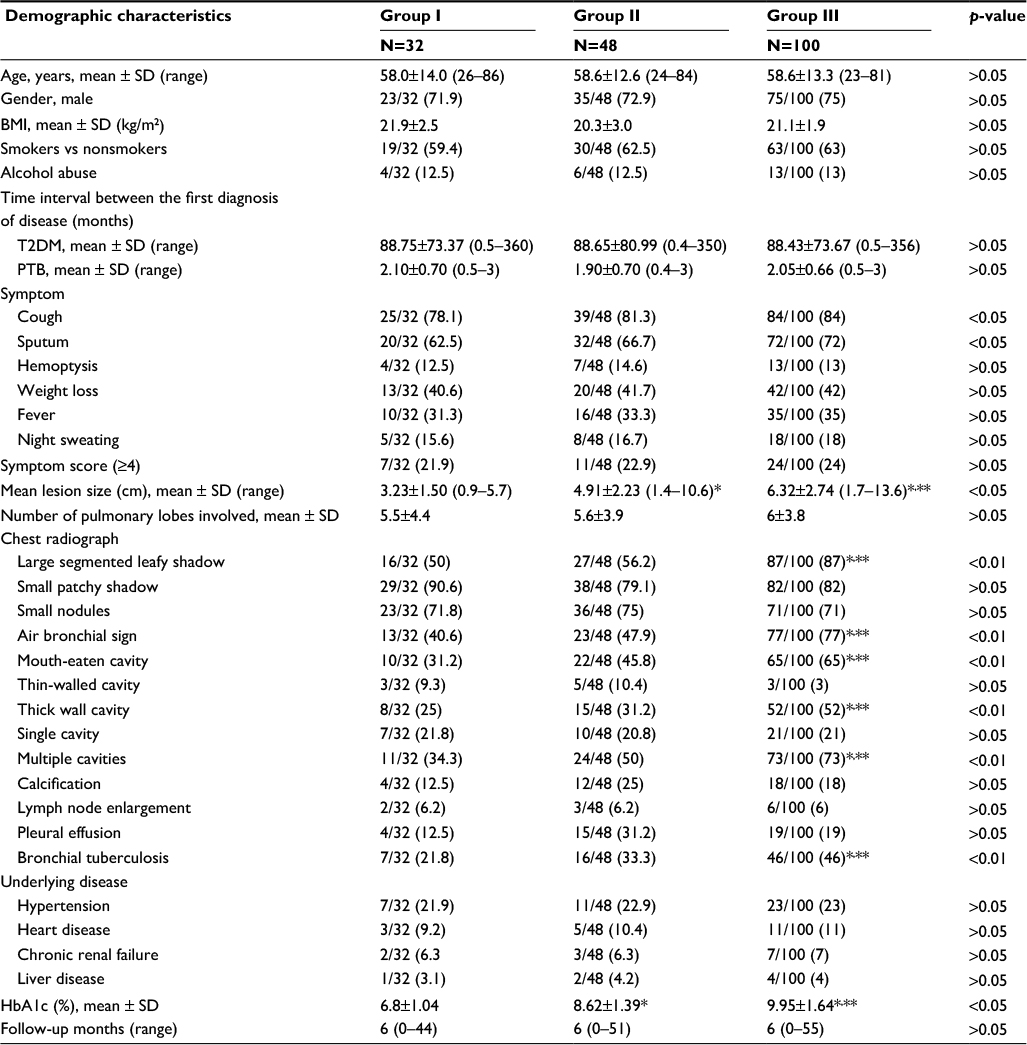 | Table 1 Characteristics of patients with PTB, according to diabetes control status Notes: Data are presented as the number (%) of subjects, unless otherwise indicated. Group I: HbA1c level <7%; Group II: HbA1c level from 7% to 9%; Group III: HbA1c level >9%. *p<0.05 compared with Group I, **p<0.05 compared with Group II. Abbreviations: BMI, body mass index; T2DM, type 2 diabetes mellitus; PTB, pulmonary tuberculosis; HbA1c, glycosylated hemoglobin. |
Comparison of imaging features in T2DM TB in patients with different HbA1c levels
Figure 1A shows that the upper lobe of the right lung has larger diameter of the exact shadow. In the three groups, the detection rate of large segmented leafy shadow (Figure 1B) was 50% (16/32), 56.2% (27/48), and 87% (87/100); the air bronchogram sign (Figure 1C) detection rate was 40.6% (13/32), 47.9% (23/48), and 77% (77/100); the discovery rate of mouth-eaten cavity (Figure 1D) was 31.2% (10/32), 45.8% (22/48), and 65% (65/100); thick wall cavity (Figure 1E) detection rate was 25% (8/32), 31.2% (15/48), and 52% (52/100); the rate of multiple cavities (Figure 1F) was 34.3% (11/32), 50% (24/48), and 73% (73/100); and bronchial TB (Figure 1G) was found in 33.3% (7/32), 21.8% (16/48), and 46% (46/100), respectively (Figure 2). The detection rates of lesions in Group III were significantly higher than in Group II and Group I (p<0.05), and the rate of discovery was significant (p<0.05) (Table 1). Meanwhile, the mean size of lesions in the three groups increased with the increasing of the HbAlc levels (Figure 3). After treatment, in the patients whose HbAlc level reached control target (<7%) among the three groups, CT absorption improvement rates of 100% (32/32), 72.9% (35/48), 56% (56/100) were observed, respectively, (Figure 4). The therapeutic efficacy rate of group I was better than group II (x2=10.35, p<0.01), and the treatment efficacy rate of group II was better than group III (x2=3.92, p<0.05). The TB improvement rate of all groups increased progressively (x2=21.81, p<0.05) (Figure 5, Table 2).
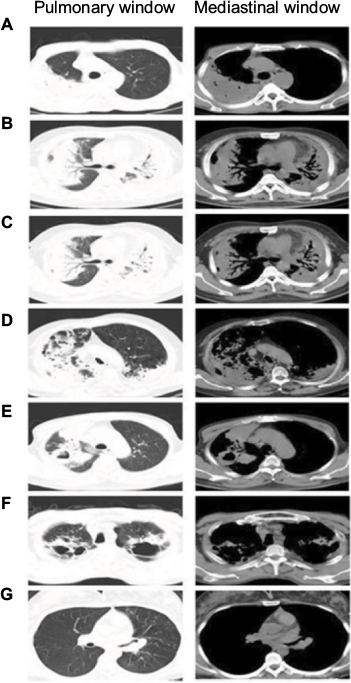 | Figure 1 Chest radiograph signs in pulmonary window and mediastinal window. Notes: (A) Consolidation images; (B) large segmented leafy shadow; (C) air bronchial sign; (D) mouth-eaten cavity; (E) thick wall cavity; (F) multiple cavities; (G) bronchial cavities. |
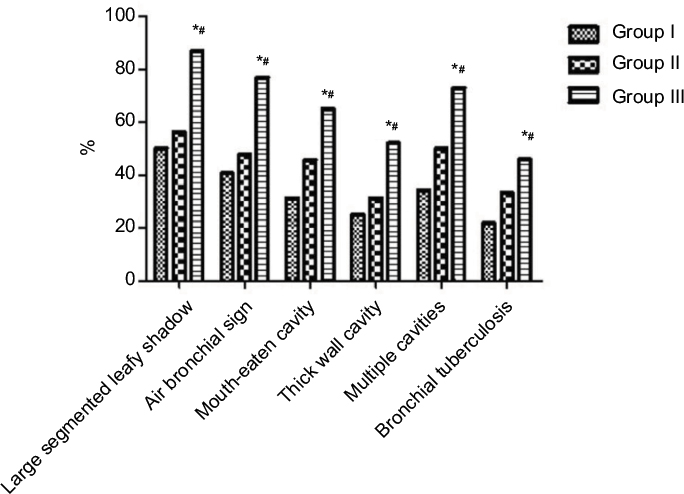 | Figure 2 Detection rates of chest radiograph signs between three groups. Notes: Group I: HbA1c level <7%; Group II: HbA1c level from 7% to 9%; Group III: HbA1c level >9%. *p<0.05 compared with Group I, #p<0.05 compared with Group II. |
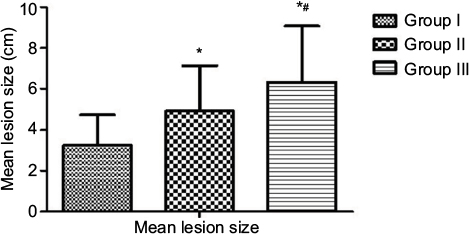 | Figure 3 Mean lesion size (cm) of three groups. Notes: Group I: HbA1c level <7%; Group II: HbA1c level from 7% to 9%; Group III: HbA1c level >9%.*p<0.05 compared with Group I, #p<0.05 compared with Group II. |
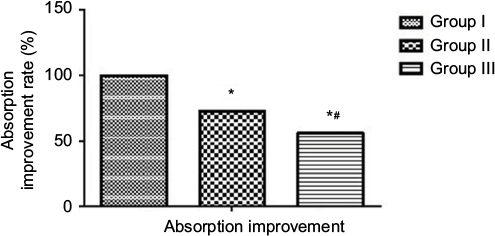 | Figure 4 CT absorption improvement rate between three groups. Notes: Group I: HbA1c level <7%; Group II: HbA1c level from 7% to 9%; Group III: HbA1c level >9%.*p<0.05 compared with Group I, #p<0.05 compared with Group II. |
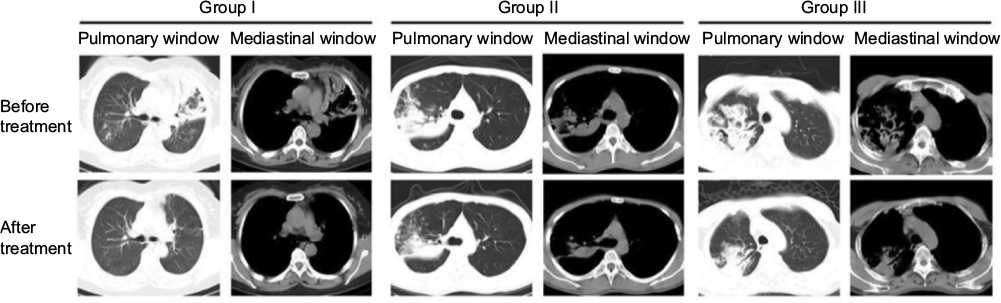 | Figure 5 Chest radiograph signs in pulmonary window and mediastinal window before and after TB and T2DM treatment in three groups. Notes: Group I: HbA1c level <7%; Group II: HbA1c level from 7% to 9%; Group III: HbA1c level >9%. Abbreviations: TB, tuberculosis; T2DM, type 2 diabetes mellitus. |
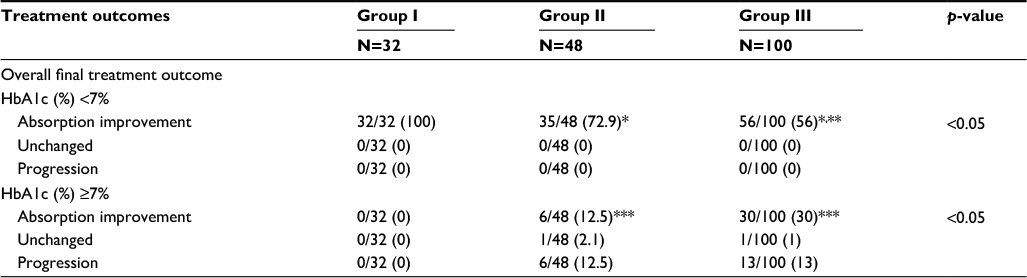 | Table 2 Treatment outcomes of PTB patients with T2DM Notes: Data are presented as the number (%) of subjects. *p<0.05 compared with Group I, **p<0.05 compared with Group II. ***p<0.05 for each group whose HbA1c (%) ≥7% compared with HbA1c (%) <7%. Group I: HbA1c level <7%; Group II: HbA1c level from 7% to 9%; Group III: HbA1c level >9%. Abbreviations: PTB, pulmonary tuberculosis; T2DM, type 2 diabetes mellitus; HbA1c, glycoslated hemoglobin. |
Discussion
In this single-center prospective cohort study, we compared the initial presentation and treatment response according to the diabetes control situation. In this study, we found that differences in imaging performance and response to treatment were associated with initial diabetic control status. Huang et al12 evaluated the impact of glycemic status on CT findings of PTB in DM patients too. They suggested that glycemic status influenced radiological manifestations of PTB with DM and showed an increased risk of atypical radiological presentations of PTB in DM patients. Physicians should be alert enough to pay more attention to PTB patients with poor glycemic control. We found that the frequency of having cavities was positively associated with HbA1c levels. To the best of our knowledge, our study is the first prospective cohort study designed to evaluate the correlation between CT features and HbAlc levels in patients with T2DM complicated with PTB. In our study, HbA1c ≥7% is an independent risk factor for poor CT features in PTB patients. CT manifestations of T2DM complicated with PTB were closely related to HbAlc level. The treatment effect is better when HbAlc level <7%. HbAlc level effectively reflects the severity and therapeutic effect to a certain extent. CT scan can provide some important information for clinical imaging.
Diabetes is considered to be associated with the late-onset cultural conversion and poor treatment outcomes in TB,3,9,14 although not all reports have shown a similar relationship.15,16 For anti-Mycobacterium tuberculosis antibiotics to effectively eliminate M. tuberculosis, a normal functioning immune system is required.17 One hypothesis is that chronic hyperglycemia can lead to immune dysfunction, thereby reducing the efficacy of anti-TB treatment; another possible reason is that diabetes can interact with anti-TB drugs.18–20 It is unclear whether glycemic control in the course of anti-TB treatment can affect the treatment of TB results. Several studies have suggested that more cavities are found in DM patients,21,22 especially in patients with poor blood glucose control (HbA1c ≥7.0%).23 Another study showed that the degree of glycemic control in T2DM patients affected radiographic findings. In addition, cavities were associated with HbA1c levels.24 The recent research found that poor glycemic control is associated with poor PTB treatment outcome.25
This study also has some limitations. First, we did not obtain our target sample size, and so the relatively small number of cases may affect the results. Second, we did not compare T2DM PTB patients with just T2DM or PTB. Admittedly, a well-designed randomized controlled trial is needed to show whether diabetic care intensification in the initiation of treatment of TB can improve the outcome of TB treatment.
Conclusion
CT manifestations of DM complicated with PTB were closely related to the level of HbA1c. If HbA1c standard <7%, the effect of TB treatment is better. HbA1c to a certain extent effectively reflects the severity and therapeutic effect of the disease; CT scan can provide some important information for clinical imaging. The above two examinations can guide clinicians to formulate the appropriate diagnosis and treatment in a timely manner.
Acknowledgment
This work was supported by the Key Program of Science and Technology Committee of Changning District (WKW2016 Z03), Shanghai, People’s Republic of China.
Author contributions
All authors contributed toward data analysis, drafting and critically revising the paper and agree to be accountable for all aspects of the work.
Disclosure
The authors report no conflicts of interest in this work.
References
World Health Organization. Global Tuberculosis Report 2016. Geneva: World Health Organization; 2016. | ||
Jeon CY, Murray MB. Diabetes mellitus increases the risk of active tuberculosis: a systematic review of 13 observational studies. PLoS Med. 2008;5(7):e152. | ||
Jimenez-Corona ME, Cruz-Hervert LP, Garcia-Garcia L, et al. Association of diabetes and tuberculosis: impact on treatment and post-treatment outcomes. Thorax. 2013;68(3):214–220. | ||
Hongguang C, Min L, Shiwen J, et al. Impact of diabetes on clinical presentation and treatment outcome of pulmonary tuberculosis in Beijing. Epidemiol Infect. 2015;143(1):150–156. | ||
Alisjahbana B, Sahiratmadja E, Nelwan EJ, et al. The effect of type 2 diabetes mellitus on the presentation and treatment response of pulmonary tuberculosis. Clin Infect Dis. 2007;45(4):428–435. | ||
Syed SS, Ishaq AD, Mohamed AJ, Razakmuttalif A, Moussa MA. Role of diabetes in the prognosis and therapeutic outcome of tuberculosis. Int J Endocrinol. 2012;2012:645362. | ||
Faurholt-Jepsen D, Range N, PrayGod G, et al. Diabetes is a strong predictor of mortality during tuberculosis treatment: a prospective cohort study among tuberculosis patients from Mwanza, Tanzania. Trop Med Int Health. 2013;18(7):822–829. | ||
Tam CM, Leung CC, Noertjojo K, Chan SL, Chan-Yeung M. Tuberculosis in Hong Kong-patient characteristics and treatment outcome. Hong Kong Med J. 2003;9(2):83–90. | ||
Baker MA, Harries AD, Jeon CY, et al. The impact of diabetes on tuberculosis treatment outcomes: a systematic review. BMC Med. 2011;9:81. | ||
Song Q, Zhang G, Jiang H, Ren Y, Lu X. Imaging features of pulmonary CT in type 2 diabetic patients with Multidrug-Resistant tuberculosis. PLoS One. 2016;11(3):e152507. | ||
Kim J, Lee IJ, Kim JH. CT findings of pulmonary tuberculosis and tuberculous pleurisy in diabetes mellitus patients. Diagn Interv Radiol. 2017;23(2):112–117. | ||
Huang LK, Wang HH, Lai YC, Chang SC. The impact of glycemic status on radiological manifestations of pulmonary tuberculosis in diabetic patients. PLoS One. 2017;12(6):e179750. | ||
Xu Y, Wang L, He J, et al. Prevalence and control of diabetes in Chinese adults. JAMA. 2013;310(9):948–959. | ||
Mi F, Tan S, Liang L, et al. Diabetes mellitus and tuberculosis: pattern of tuberculosis, two-month smear conversion and treatment outcomes in Guangzhou, China. Trop Med Int Health. 2013;18(11):1379–1385. | ||
Cavanaugh J, Viney K, Kienene T, et al. Effect of diabetes on tuberculosis presentation and outcomes in Kiribati. Trop Med Int Health. 2015;20(5):643–649. | ||
Singla R, Khan N, Al-Sharif N, et al. Influence of diabetes on manifestations and treatment outcome of pulmonary TB patients. Int J Tuberc Lung Dis. 2006;10(1):74–79. | ||
Restrepo BI, Schlesinger LS. Impact of diabetes on the natural history of tuberculosis. Diabetes Res Clin Pract. 2014;106(2):191–199. | ||
Babalik A, Ulus IH, Bakirci N, et al. Plasma concentrations of isoniazid and rifampin are decreased in adult pulmonary tuberculosis patients with diabetes mellitus. Antimicrob Agents Chemother. 2013;57(11):5740–5742. | ||
Chang MJ, Chae JW, Yun HY, et al. Effects of type 2 diabetes mellitus on the population pharmacokinetics of rifampin in tuberculosis patients. Tuberculosis (Edinb). 2015;95(1):54–59. | ||
Nijland HM, Ruslami R, Stalenhoef JE, et al. Exposure to rifampicin is strongly reduced in patients with tuberculosis and type 2 diabetes. Clin Infect Dis. 2006;43(7):848–854. | ||
Tatar D, Senol G, Alptekin S, et al. Tuberculosis in diabetics: features in an endemic area. Jpn J Infect Dis. 2009;62(6):423–427. | ||
Baghaei P, Tabarsi P, Abrishami Z, et al. Comparison of pulmonary TB patients with and without diabetes mellitus type II. Tanaffos. 2010;9(2):13–20. | ||
Park SW, Shin JW, Kim JY, et al. The effect of diabetic control status on the clinical features of pulmonary tuberculosis. Eur J Clin Microbiol Infect Dis. 2012;31(7):1305–1310. | ||
Chiang CY, Lee JJ, Chien ST, et al. Glycemic control and radiographic manifestations of tuberculosis in diabetic patients. PLoS One. 2014;9(4):e93397. | ||
Chiang CY, Bai KJ, Lin HH, et al. The influence of diabetes, glycemic control, and diabetes-related comorbidities on pulmonary tuberculosis. PLoS One. 2015;10(3):e121698. |
 © 2018 The Author(s). This work is published and licensed by Dove Medical Press Limited. The
full terms of this license are available at https://www.dovepress.com/terms
and incorporate the Creative Commons Attribution
- Non Commercial (unported, 3.0) License.
By accessing the work you hereby accept the Terms. Non-commercial uses of the work are permitted
without any further permission from Dove Medical Press Limited, provided the work is properly
attributed. For permission for commercial use of this work, please see paragraphs 4.2 and 5 of our Terms.
© 2018 The Author(s). This work is published and licensed by Dove Medical Press Limited. The
full terms of this license are available at https://www.dovepress.com/terms
and incorporate the Creative Commons Attribution
- Non Commercial (unported, 3.0) License.
By accessing the work you hereby accept the Terms. Non-commercial uses of the work are permitted
without any further permission from Dove Medical Press Limited, provided the work is properly
attributed. For permission for commercial use of this work, please see paragraphs 4.2 and 5 of our Terms.