Back to Journals » Diabetes, Metabolic Syndrome and Obesity » Volume 15
The Comparative Study on the Status of Bone Metabolism and Thyroid Function in Diabetic Patients with or without Ketosis or Ketoacidosis
Authors Xu C, Gong M, Wen S ![]() , Zhou M, Li Y, Zhou L
, Zhou M, Li Y, Zhou L
Received 23 November 2021
Accepted for publication 8 March 2022
Published 12 March 2022 Volume 2022:15 Pages 779—797
DOI https://doi.org/10.2147/DMSO.S349769
Checked for plagiarism Yes
Review by Single anonymous peer review
Peer reviewer comments 3
Editor who approved publication: Professor Ming-Hui Zou
Chenglin Xu,1,* Min Gong,1,* Song Wen,1,* Mingyue Zhou,2 Yanyan Li,1 Ligang Zhou1,3
1Department of Endocrinology, Shanghai Pudong Hospital, Fudan University Pudong Medical Center, Shanghai, 201399, People’s Republic of China; 2Clinical Research OB/GYN REI Division, University of California, San Francisco, CA, USA; 3Shanghai Key Laboratory of Vascular Lesions Regulation and Remodeling, Shanghai Pudong Hospital, Shanghai, People’s Republic of China
*These authors contributed equally to this work
Correspondence: Ligang Zhou, Tel +8613611927616, Email [email protected]
Purpose: This study aims to identify changes in bone turnover markers and thyroid function in diabetic ketosis (DK) and diabetic ketoacidosis (DKA).
Materials and Methods: We compared data from the Department of Endocrinology at Shanghai Pudong Hospital from 2018 to 2020 on the pancreatic status and previous glucose control, bone transformation, calcium homeostasis, and thyroid function in groups with diabetes (DM alone, n=602), DK (n=232), and DKA (n=60). Similar comparisons were made in recurrent DK (A) (n=17) and single DK (A) (n=272).
Results: The fasting C-peptide level decreased significantly, but hemoglobin A1c (HbA1c) levels were higher in DK or DKA (p< 0.05). Blood calcium and 25-hydroxyvitamin D3 (25-OH-VitD3) levels were significantly lower in DKA (p< 0.05), but parathyroid hormone (PTH) levels remained constant across all three groups. The N-terminal middle molecular fragment of osteocalcin (N-MID) and β-C terminal cross-linking telopeptide of type 1 collagen (β-CTX) showed significant inverse alterations in DKA, regardless of gender or age (p< 0.05). Otherwise, DKA significantly inhibited thyroid function (p< 0.05). Furthermore, Spearman correlation analyses revealed a relationship between N-MID and HbA1c in DM alone (r=− 0.27, p< 0.01), while total triiodothyronine (TT3, r=0.62, p< 0.01) or free T3 (FT3, r=0.61, p< 0.01) in DK, and DKA (TT3, r=0.45, p< 0.01; FT3, r=0.43, p< 0.01). Multilinear regression analyses revealed that β-CTX (β=0.564), HbA1c (β=− 0.196), TT3 (β=0.183), and 25-OH-VitD3 (β=− 0.120) were the only independent determinants of N-MID in DM, whereas FT3 (β=0.491), β-CTX (β=0.315) in DK, and FT3 (β=0.420), β-CTX (β=0.367), TG (β=− 0.278) in DKA. Only 25-OH-VitD3 was found to be significantly lower in recurrent DK (A) than in single onset DK (A) (p< 0.05), and β-CTX (β=0.745) was found to be significantly independently associated with N-MID.
Conclusion: Our preliminary findings show a dramatic change in bone turnover markers in DM patients with DK and DKA, and this change may be related to thyroid function.
Keywords: bone turnover marker, diabetes mellitus, thyroid function, DKA
Introduction
Diabetes mellitus (DM) is well-known for its role in osteoporosis (OP).1 Because it is now widely accepted in clinics that people with diabetes are more likely to develop osteopenia or osteoporosis, the strong relationship between bone and glucose metabolism has been extensively researched and confirmed. T2DM (adult-onset type 2 diabetes mellitus) is now the most common type of diabetes mellitus (DM). It is distinguished by a high level of insulin resistance (IR). Actual bone mineral density (BMD) does not appear to decrease significantly in T2DM patients. However, the incidence of bone fracture is higher in T2DM patients than in the general population due to bone fragility.2
Multiple factors influence bone transformation by the osteoblast and osteoclast activities, including nutrient status, circulatory hormones (PTH, VitD3, and thyroid hormone), and other factors (aging and gender). Medication, alcohol, cancer, and systemic disorders are pathogenic variables affecting bone transformation homeostasis (chronic renal insufficiency, osteoporosis, Cushing syndrome). The two processes that comprise bone turnover are resorption of old bone and formation of new bone, with the activities of bone formation and resorption represented by N-terminal middle molecular fragment of osteocalcin (N-MID) and β-C terminal cross-linking telopeptide of type 1 collagen (β-CTX), respectively.3 The newly discovered “osteokine” osteocalcin (OCN), secreted by osteoblasts, has been shown to increase insulin production and secretion by pancreatic cells. Animal models of OCN knockdown suggest IR and T2DM. One possible gene related to OCN function has been identified as Esp or Ptpsv, which encodes osteotesticular protein tyrosine phosphatase (OST-PTP), responsible for OCN carboxylase.4 Under-carboxylated OCN in circulation increased adiponectin expression in adipose tissue. Some studies also discovered that OCN might increase the production of glucagon-like peptide 1 (GLP-1), an incretin hormone released to improve insulin secretion and sensitivity.5,6 GPRC6A, a G-coupled protein expressed in muscle, adipose tissue, and bone, mediates the effect of OCN via the cAMP and MAPK signaling pathways. Insulin signaling, on the other hand, has been shown to increase OCN secretion and activity by promoting OCN decarboxylation, inhibiting FoxO1,7 and enhancing mTOR signaling.8 The Esp knockout model showed significant hypoglycemia and reduced fat mass in mice. In contrast, the GPRC6A gene knockout produces a nearly identical phenotype to osteocalcin null mice with accumulated fat and hyperglycemia, glucose intolerance, and IR.
Furthermore, 25-OH-VitD3 regulates calcium homeostasis in the physical environment by increasing calcium absorption and decreasing loss. The 25-OH-VitD3 level in diabetes is closely related to the sub-inflammatory state and IR.9 25-OH-VitD3 is the leading vitamin D reservoir and the source of 1,25-OH-VitD3, which is the active form of vitamin D related to bone transformation and calcium reabsorption and can be stimulated by parathyroid hormone (PTH). Numerous studies have found that vitamin D deficiency, despite lower ingestion of vitamin D3 in eastern-southern Asians, has a significant relationship with the pathophysiology of diabetes, including metabolic syndrome, IR, and pancreatic function. Lower 25-OH-VitD3 levels have also been linked to osteoporosis or pathological bone fracture. In the clinic, vitamin D, blood calcium levels, and bone turnover markers have all been shown to change in diabetic individuals.10,11 It is unclear whether calcium supplementation is required for type 1 and type 2 diabetes (T1DM and T2DM) in the clinic. An RCT trial in T1DM confirmed that 1-OH Vitamin D3 could safely preserve β-cell function in children with newly diagnosed T1DM, with a more substantial effect in males. In clinical trial NCT00436475,12 the study found that short-term vitamin D3 supplementation improved cell function and had a marginal impact on lowering HbA1c in adults at risk of type 2 diabetes. In another clinical RCT study,13 energy restriction combined with calcium supplementation is an effective dietary intervention strategy for preventing the development of T2DM in the overweight population. Another study found that daily vitamin D and calcium supplementation for six months did not change OGTT-derived measures of insulin sensitivity, insulin secretion, and β-cell function in multi-ethnic adults at risk of T2DM with low vitamin D status.14 Furthermore, one study found that while vitamin D supplementation is safe and effective for achieving vitamin D sufficiency, it does not affect long-term glycemic control in T2DM patients.15 An RCT trial also found that treating T1DM patients with 1.25-OH2-VitD3 at a daily dose of 0.25 μg was safe but did not reduce β-cell function loss.16 Furthermore, there is no direct evidence that in extreme situations, such as diabetic ketosis (DK) or diabetic ketoacidosis (DKA), the ketosis or acidosis influences the liver synthesis of the 25-OH-VitD3 that is assessed in our study. As a result, this is our first opportunity to investigate calcium homeostasis in the context of DK or DKA, and we will reveal the status of 25-OH-VitD3 in recurrent DKA.
T2DM has been shown in multiple studies to lower TSH levels and impair the conversion of thyroxine (T4) to triiodothyronine (T3) in peripheral tissues. Poorly managed T2DM can result in IR and hyperinsulinemia, which cause thyroid tissue proliferation and increase nodule and goiter size.17 HPT-axis, or thyroid function, has also changed in DK or DKA, similar to the significant change in 25-OH-VitD3. In that case, there is frequently no organic impairment to the thyroid parenchyma per se. It technically belongs to the “Euthyroid illness syndrome,” as the “low T3 syndrome,” which indicates the severity of the systemic diseases. We also investigated the risk of bone fracture in the euthyroid range in diabetic postmenopausal females. We discovered that lower thyroid-stimulating hormone (TSH) levels were associated with decreased bone mineral density (BMD) at the femoral neck and hip joint, indicating a higher risk of osteoporosis and fracture. Whether this phenomenon has a relationship with bone transformation activity in the DK or DKA is unknown. As a result, it will be clinically relevant when examining glucose metabolism, bone transformation activity, and thyroid function in triple metabolic relationships in the context of DK or DKA.
According to recent rat research, hyperketonemia, like hyperglycemia, harms bone microstructure and is linked to abnormal bone turnover indicators.18 To the best of our knowledge, there have been few direct reports on the relationship between DKA, particularly recurrent DKA (RDK), and changes in bone parameters. According to one study, the observed severe negative calcium balance in DKA was caused by decreased bone formation independent of calciotropic hormones represented by OCN due to severe insulin deficiency and secondarily by metabolic acidosis. To date, many other studies have extensively covered the implications of T1DM and T2DM on bone turnover and quality, such as insulin signaling disruption, advanced glycated products (AGEs), oxidative stress, and we assume that in the extreme situation of DKA or RDK, this alteration may become more apparent. As a result, this is the first time we have reported on the relationship between DK or DKA, RDK, and changes in bone biomarkers. As bone turnover markers have been found to change in diabetes, another question is whether hyperketonemia and ketoacidosis influence bone metabolism and whether we should automatically administer calcium or vitamin D supplements or implement prevention in patients prone to recurrent DKA. As a result, the purpose of this study is to look at how biomarkers associated with bone metabolism (blood indices were checked on the first day of admission to the ward during DK and DKA states) change in three types of diabetic patients: T2DM without DK or DKA, DK (blood glucose>11.1 mmol/L or 198 mg/dL or known diabetes mellitus, positive for ketonuria, blood ketone bodies>1.0 mmol/L), and DKA (Ketonemia >3.0 mmol/L or significant ketonuria <more than 2+ on standard urine sticks>, and blood glucose>11.0 mmol/L or 198 mg/dL or known diabetes mellitus, bicarbonate (HCO3−)<15.0 mmol/L and arterial pH<7.3 via blood air-analyses). Although DKA is not a common DM disorder, and there may be sample size limitations as well as the heterogeneity of clinical manifestations of patients with DK or DKA, we will include the fit samples and analyze the relationship between glucose metabolism, bone transformation, and thyroid function, as well as investigating the possible mechanisms that cause them to shift in DK or DKA.
Materials and Methods
Source of In-Patient Data
Patients’ information was gathered from the in-patient information system at Shanghai Pudong Hospital. Using a small number of patients, we calculate the sample size using PASS software (version 15.0.5, NCSS, LLC. Kaysville, Utah, USA). We discovered that a sample size of at least 45:150:315 is required. As a result, the sample size in this study was 60:232:602. Based on the international diagnosis standard for DK (blood glucose>198 mg/dL, with ketonemia or urine ketone, and without acidosis) and DKA (blood glucose>198 mg/dL, with ketonemia or urine ketone, and pH 7.3 or HCO3-<15 mmol/L determined by blood-air analyses), we included 60 adult diabetic patients hospitalized in the Department of Endocrinology with DKA in DKA group, 232 adult diabetic patients with DK group, and 602 T2DM into DM alone group. Patients with other metabolic or respiratory acidosis disorders, including lactic acidosis, shock, hypoperfusion, chronic obstructive pulmonary disease (COPD), asthma, advanced renal insufficiency, intestinal obstruction, infection, non-ketotic hyperosmolar coma, and non-diabetic ketosis were also excluded. The control group included 602 patients with T2DM alone (DM alone) who met DM criteria and had a history of T2DM but no DK or DKA. Diabetes diagnoses were made using World Health Organization (WHO) guidelines published in 1999.
Blood Sampling and Evaluation of C-Peptide, HbA1c, Lipid Metabolism, Markers of Bone Turnover, Calcium, and Thyroid Hormones
All patients admitted to the ward were conscious and scored 15 on the Glasgow Coma Scale (GCS). All DK and DKA patients received standard fluid therapy, low venous dosage fast action insulin (0.1 U/kg) therapy and regular T2DM patients received standard oral anti-diabetic medication or insulin therapy based on progression, glycemic control level, and complications such as liver or kidney insufficiency. DK and DKA patients did not receive calcium or vitamin D supplements at admission. All blood samples (n=894) were collected on the day the patients arrived at the ward (blood indices of DK and DKA were collected (n=292) on the first day of patients admitted to the ward while in the DK and DKA states). Fasting plasma C-peptide (FCP), HbA1c, calcium concentration, total triglyceride (TG), total cholesterol (TC), high-density lipoprotein (HDL), and low-density lipoprotein (LDL) were all measured in fasting plasma. Following blood sampling, bone metabolism markers such as 25-OH-VitD3, N-MID, β-CTX, parathyroid hormone (PTH), and thyroid function such as TSH, FT3, FT4, TT3, and TT4 were analyzed. Table 1 shows the baseline data, including gender, age, BMI, hemoglobin A1c (HbA1c), and diabetes duration, and we compared it to three groups. We considered differentiating the influences by gender, age, BMI, and glucose metabolic traits in different groups due to the multi-factors influencing the results obtained.
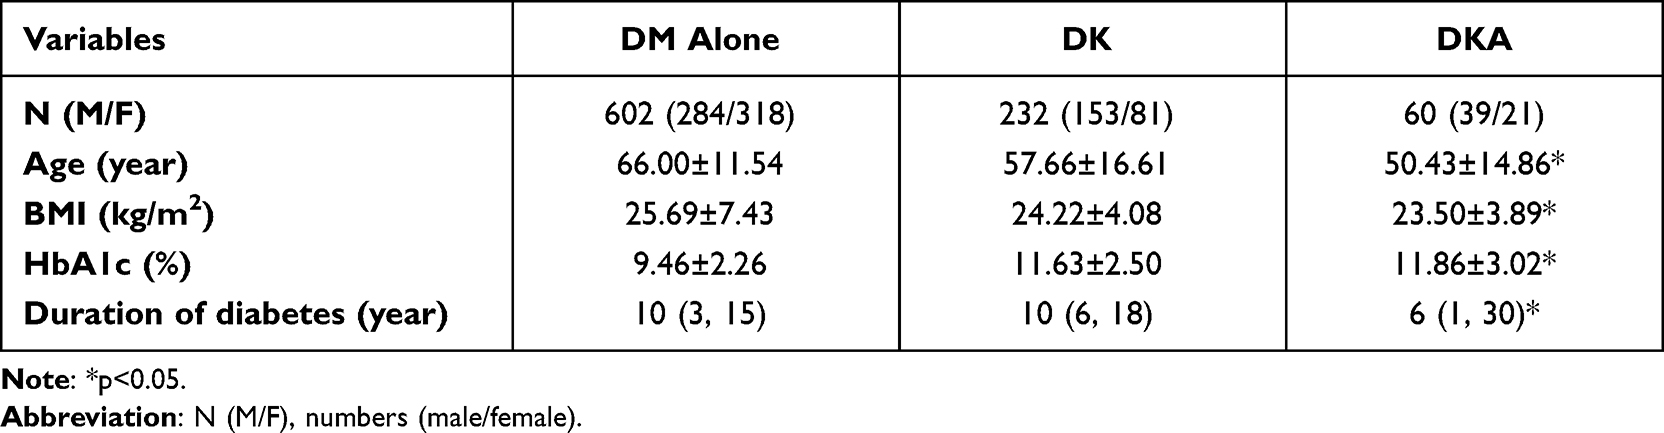 |
Table 1 The Primary Characteristics of Patients with DM Alone, Diabetic Ketosis (DK), and Diabetic Ketoacidosis (DKA) Revealed That DKA Had a Significantly Lower Age, BMI, Duration of Diabetes, and a Higher HbA1c |
Statistical Analyses
Statistics were analyzed using SPSS (IBM, version 26.0) and Prism (GraphPad, version 9.0). The two-way ANOVA was used to compare differences in plasma lipid levels. In contrast, C-peptide, HbA1c, bone turnover markers, calcium, PTH, and thyroid hormones were analyzed using non-parameter analyses or ANOVA among the three groups (DM alone, DK, and DKA). Spearman correlation analyses were used to determine the relationships between the indices mentioned above in the total number of patients, DM alone, DK, and DKA. Multilinear regression analyses were used to develop models of the best predictors of N-MID change in three groups. The independent sample t-test compared recurrent DK or DKA with a single DK or DKA. For all analyses, statistical significance was set at p<0.05.
Results
Pancreatic Function, Mean Glucose Level in DM Alone, DK and DKA
First, our findings show that fasting levels of C peptide, which reflect pancreatic function, are significantly lower in DK (0.287±0.295 nmol/L, p<0.0001; reference level: 0.27–1.28 nmol/L) and DKA (0.120±0.143 nmol/L, p<0.0001) when compared to DM alone (0.400±0.298 nmol/L). HbA1c levels, which indicate the average level of glucose management in the previous 90–120 days, were also lower in DK (11.626±2.502%, p<0.0001) and DKA (11.860±3.015%, p<0.0001) when compared to DM alone (9.459±2.264%, reference level: 4.0–6.0%) (Figure 1).
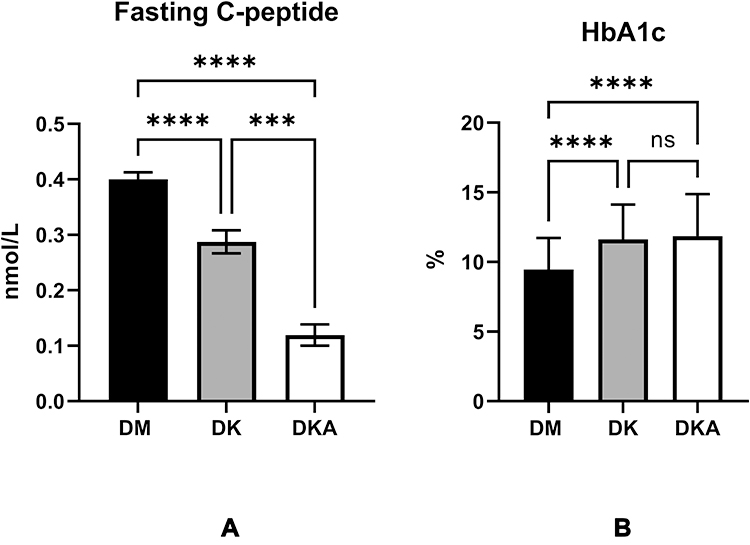 |
Figure 1 Characteristics differed between DM alone, DK and DKA groups regarding one indicator of the pancreatic function, fasting C-peptide (A) fasting C-peptide was significantly lowest in DKA; an indicator for the glucose controlling in the past 3–4 months, HbA1c (B) HbA1c was significantly higher in both DK and DKA when compared with DM alone. Notes: ***p<0.001, ****p<0.0001. |
The Levels of Indices Related to Bone Metabolism are Reflected by 25-OH-VitD3, β-CTX, N-MID, PTH, and Ca2+ in DM Alone, DK, and DKA
The analyses on bone metabolism indices revealed that there were no significant differences between the DM alone and DK groups, but that DKA had a significantly lower level of 25-OH-VitD3 (DM: 19.507±8.436 ng/mL; DK: 17.476±7.445 ng/mL; DKA: 14.117±6.923 ng/mL; reference level: >30.0 ng/mL), N-MID (DM: 12.303±8.715 ng/mL; DK: 9.451±5.696 ng/mL; DKA: 6.839±3.956 ng/mL; reference level: female: pre-menopause: 11–43 ng/mL, post-menopause: 15–46 ng/mL; male 18–30 years old: 24–70 ng/mL, 31–47 years old: 14–46 ng/mL), Ca2+ (DM: 2.195±0.113; DK: 2.125±0.124; DKA: 2.056±0.129; reference level: 2.08–2.65 mmol/L). However, when compared to DM alone and DK, the level of β-CTX in DKA was significantly higher (DM: 0.379±0.220 ng/mL; DK: 0.476± 0.314 ng/mL; DKA: 0.637± 0.408 ng/mL; reference level: pre-menopause: ≤0.57 ng/mL, post-menopause: ≤1.01 ng/mL; male: >50 years old: ≤ 0.85 ng/mL), whereas there was no significant difference in PTH concentration (DM: 7.248±25.471 pmol/L; DK: 4.990± 2.706 pmol/L; DKA: 5.380±8.271 pmol/L, p>0.05; reference level: 1.96–9.33 pmol/L) (Figure 2).
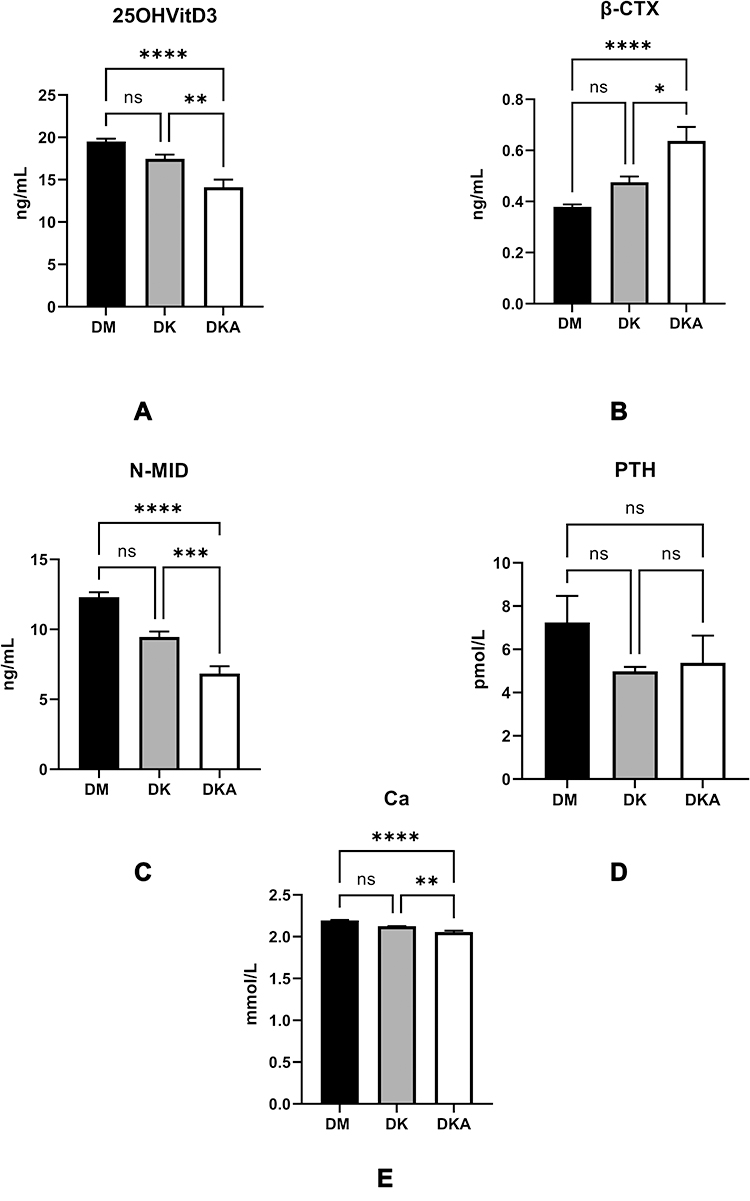 |
Figure 2 Diabetic ketoacidosis causes the serum 25-OH-VitD3, the main reservoir of vitamin D, and precursor of the active 1.25-OH-VitD3 (A), N-MID, the biomarkers of osteoblast activity (C), blood calcium, which contains ionized calcium (E), to decrease while the bone-breaking marker of osteoclast, β-CTX (B). Nevertheless, the PTH level, which increases blood calcium by promoting calcium reabsorption in bone, intestine, and kidney (D), did not display any disparity among groups. Notes: *p<0.05, **p<0.01, ***p<0.001, ****p<0.0001. |
We then separated the three groups based on gender and age to rule out the effects of sex and age on N-MID and β-CTX. We found that in males, N-MID levels were lower at age above or below 50 when compared to DM alone and DK, whereas β-CTX levels were higher in DKA than in DM alone and DK (for N-MID, age<50, DM alone: 11.585±7.551 ng/mL, DK: 11.529±5.262 ng/mL; DKA: 6.700±3.619 ng/mL, p<0.05; age≥50, DM alone: 10.280±4.647 ng/mL, DK: 7.944±3.716 ng/mL, DKA: 7.149±4.131 ng/mL, p<0.05; for β-CTX, age<50, DM alone: 0.350±0.158 ng/mL, DK: 0.527±0.251 ng/mL, DKA: 0.667±0.415 ng/mL, p<0.05; age≥50: DM alone: 0.342±0.191 ng/mL, DK: 0.416±0.234 ng/mL, DKA: 0.756±0.450 ng/mL, p<0.05). However, in females under the age of 50, the levels of N-MID and β-CTX did not appear to change significantly (for N-MID, age<50, DM: 12.936±7.761 ng/mL, DK: 8.339±4.147 ng/mL, DKA: 5.000±2.000 ng/mL, p>0.05; for β-CTX, DM alone: 0.409±0.284 ng/mL, DK: 0.328±0.181 ng/mL, DKA: 0.351±0.155 ng/mL, p>0.05).
In contrast to this finding, we discovered that in female patients with DK over the age of 50, both N-MID and β-CTX levels were statistically lower than in DM alone (for N-MID, age≥50, DM alone: 14.034±10.891 ng/mL, DK: 10.392±8.180 ng/mL, DKA: 7.729±5.057 ng/mL, p<0.05; for β-CTX, age≥50, DM alone: 0.411±0.239 ng/mL, DK: 0.585±0.458 ng/mL, DKA: 0.594±0.395 ng/mL, p<0.05) (Figure 3).
 |
Figure 3 Comparisons of N-MID level in DM alone, DK and DKA; (A) in males, we could observe an overt tendency of decline at both ages <50 and >50 in DM alone, DK, and DKA respectively; (B) in females, the tendency at age<50 was not significant, but at age>50, these differences may be due to the hormonal milieu and the sample size of the age above and below 50 years old; (C) β-CTX in male showed increase tendency in DM alone, DK and DKA, respectively; (D) in female, the increased tendency was not distinct at age<50, but at age>50. Notes: *p<0.05, **p<0.01, ***p<0.001, ****p<0.0001. |
The Thyroid Function in the Background of DM Alone, DK, and DKA
Our previous research found that thyroid function parameters are also involved in bone metabolism. As a result, we investigated the relationship between thyroid function parameters and bone metabolism biomarkers. TSH levels in DKA were found to be significantly lower than in DM alone and DK (DM alone: 2.693±4.763 mIU/L; DK: 1.937±5.067 mIU/L; DKA: 1.297±1.505 mIU/L, p<0.05; reference level: 0.55–4.78 mIU/L); whereas the levels of total thyroid hormone TT4, FT3, FT4 significantly decreased in both DK and DKA (for TT4: DM alone: 96.749±20.219 nmol/L; DK: 93.236±29.675 nmol/L; DKA: 75.940±23.520 nmol/L, p<0.05; reference level: 58.1–140.6 nmol/L; for FT3: DM alone: 4.366±1.338 pmol/L; DK: 3.965±2.064 pmol/L; DKA: 2.939±0.990 nmol/L; p<0.05; reference level: 3.50–6.50 pmol/L; for FT4: DM alone: 15.752±6.116 pmol/L, DK: 16.440±5.593 nmol/L, DKA: 14.475±3.489 nmol/L, p<0.05; reference level: 11.5–22.7 pmol/L). The ratio of TT3 to TT4 (TT3/TT4) was markedly significantly lower in DK and DKA when compared to DM alone (DM alone: 0.014±0.003, DK: 0.010±0.009, DKA: 0.010±0.003; p<0.05), and FT3 to FT4 (FT3/FT4) was also significantly lower in DKA when compared to DM (DM alone: 0.284±0.059, DK: 0.239±0.575, DKA: 0.203±0.044; p<0.05) (Figure 4).
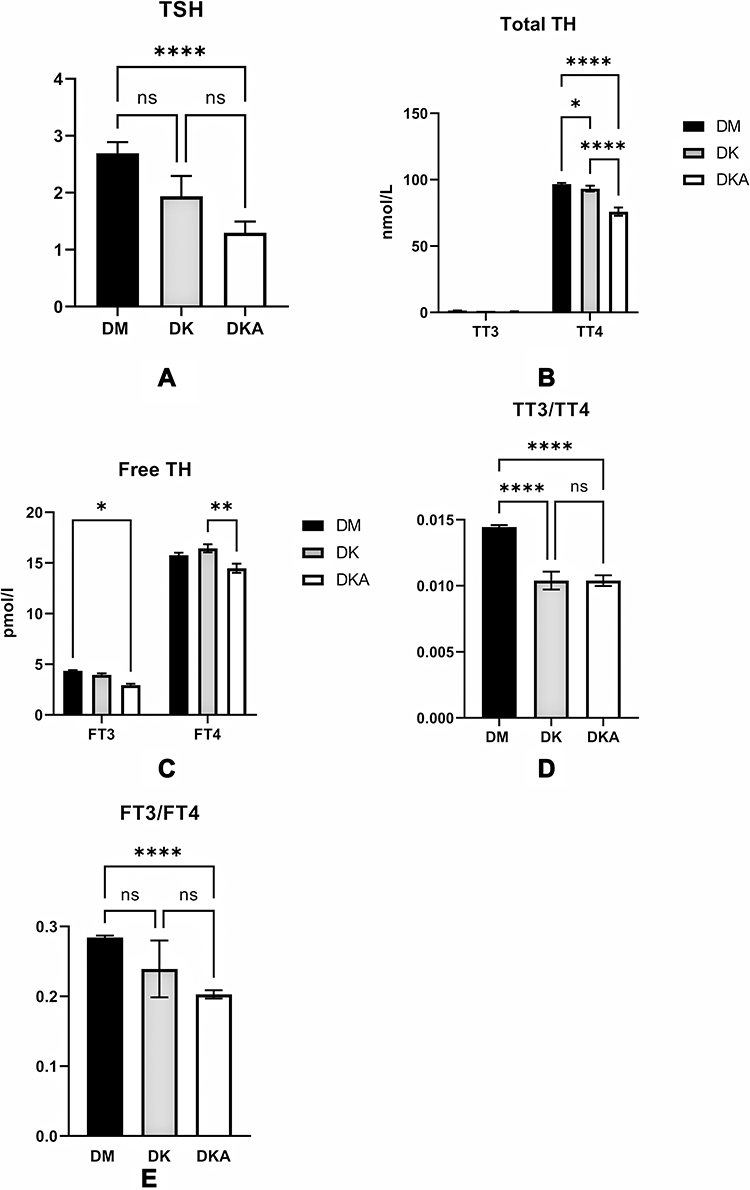 |
Figure 4 Thyroid function was influenced by dysregulation of glucose metabolism in DK and DKA. We found that the levels of TSH (A) and thyroid hormone TT4 (B) Free T3 and T4 (C) were substantially reduced in DKA. TT3/TT4 (D) and FT3/FT4 (E) indicators of thyroid function also display lower levels in DKA. Notes: *p<0.05, **p<0.01, ****p<0.0001. |
To rule out the influence of age and gender on thyroid function, we examined thyroid function in both males and females over and under the age of 50, respectively. In particular, we discovered that in males, both TT4 and TT3 decreased significantly (p <0.05) in DK and DKA regardless of age, whereas in females, TT4 decreased significantly (p<0.05) only at age≥50, and TT3 at both ages (p<0.05) (TT4: male: age<50: DM alone: 96±21.7 nmol/L; DK: 103.8±29.288 nmol/L; DKA: 75.321±14.5 nmol/L; age≥50: DM alone: 96.266±19.142 nmol/L; DK: 87.135±25.106 nmol/L; DKA: 80.353±28.042 nmol/L; female: age<50: DM alone: 101.244±20.239 nmol/L; DK: 99.338±19.267 nmol/L; DKA: 79.663±24.986 nmol/L; age≥50: DM alone: 96.950±20.991 nmol/L; DK: 92.664±36.433 nmol/L; DKA: 68.785±27.578 nmol/L; TT3: male: age<50: DM alone: 1.478±0.379 nmol/L; DK: 1.484±0.488 nmol/L; DKA: 0.797±0.264 nmol/L; age≥50: DM alone: 1.399±0.315 nmol/L; DK: 1.097±0.414 nmol/L; DKA: 0.796±0.332 nmol/L; female: age<50: DM alone: 1.573±0.354 nmol/L; DK: 1.207±0.414 nmol/L; DKA: 0.865±0.289 nmol/L; age≥50: DM alone: 1.342±0.457 nmol/L; DK: 1.086±0.749 nmol/L; DKA: 0.705±0.453 nmol/L). Furthermore, we discovered that only FT4 significantly (p<0.05) decreased in DKA of males over 50, whereas FT3 significantly (p<0.05) decreased in DKA of males of both ages and females over 50 (FT4: male: age<50: DM alone: 16.345±3.175 pmol/L; DK: 18.192±4.118 pmol/L; DKA: 14.681±2.525 pmol/L; age≥50: DM alone: 15.830±2.706 pmol/L; DK: 15.349±3.385 pmol/L; DKA: 14.427±3.649 pmol/L; female: age<50: DM alone: 15.420±2.411 pmol/L; DK: 17.874±3.338 pmol/L; DKA: 15.283±4.772 pmol/L; age≥50: DM alone: 15.641±8.235 pmol/L; DK: 16.272±8.724 pmol/L; DKA: 13.724±3.945 pmol/L; FT3: male: age<50: DM alone: 4.815±0.658 pmol/L; DK: 4.924±1.533 pmol/L; DKA: 3.051±0.793 pmol/L; age≥50: DM alone: 4.468±0.829 pmol/L; DK: 3.649±1.161 pmol/L; DKA: 2.922±0.740 pmol/L; female: age<50: DM alone: 4.841±0.854 pmol/L; DK: 4.162±1.221 pmol/L; DKA: 3.241±1.234 pmol/L; age≥50: DM alone: 4.201±1.694 pmol/L; DK: 3.653±3.229 pmol/L; DKA: 2.603±1.356 pmol/L). Interestingly, we discovered that TSH declined in both males and females, but this did not reach statistical significance (TSH: male: age<50: DM alone: 2.322±2.690 mIU/L; DK: 1.406±0.840 mIU/L; DKA: 1.131±0.897 mIU/L; age≥50: DM alone: 2.266±2.799 mIU/L; DK: 2.228±7.666 mIU/L; DKA: 0.811±0.482 mIU/L; female: age<50: DM alone: 2.493±1.586 mIU/L; DK:1.609±1.215 mIU/L; DKA: 1.386±0.983 mIU/L; age≥50: DM alone: 3.104±6.157 mIU/L; DK: 2.010±1.693 mIU/L; DKA: 2.132±2.733 mIU/L; p>0.05) (Figure 5).
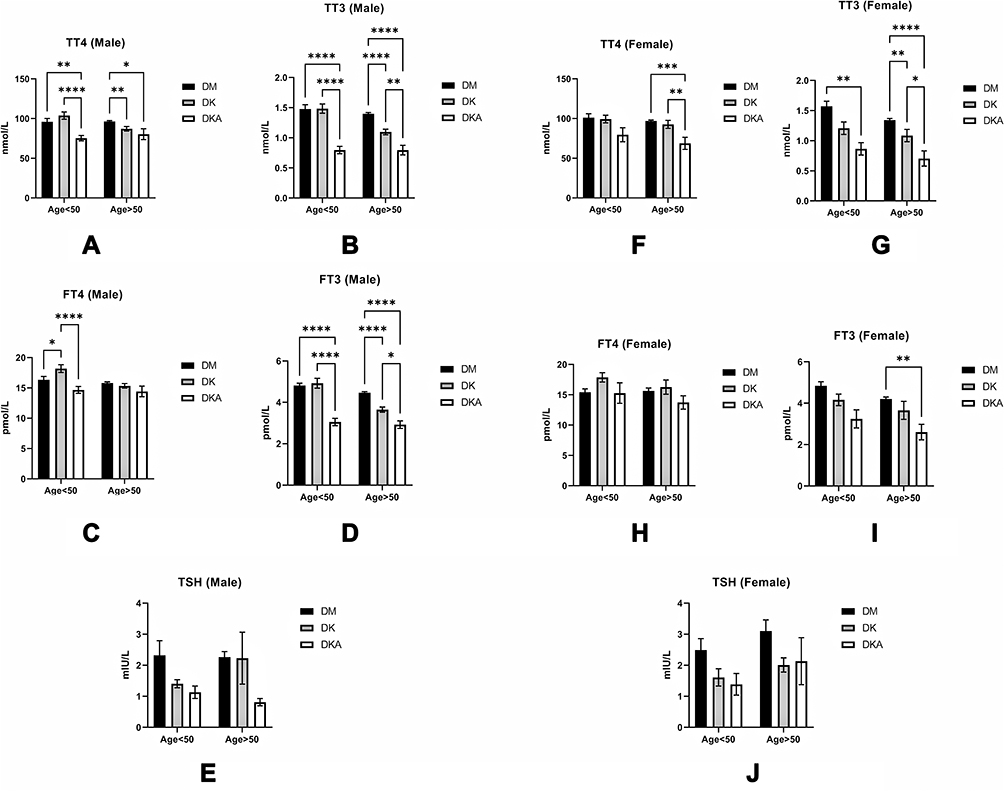 |
Figure 5 Comparisons of thyroid function in DM alone, DK, and DKA; (A) in males, we observed a distinct declining tendency at both ages <50 and >50 in DM alone, DK, and DKA respectively; (B) in males, this tendency was overt in TT3 at both age>50 and age<50; (C) we could only observe a significant decrease in FT4 in DKA of males at age<50; (D) the decreasing tendency was significant at both ages; (E) We saw a declining trend at both ages of TSH, but it was not statistically significant; (F) In females, the declining of TT4 was overt at age>50; (G) We could find that the TT3 was lower significantly in DKA at both ages; (H) we could find the DKA groups at both ages had lower FT4 level, but there was no significance; (I) we could observe the declining trend at both ages, but it was clear in a group with age>50; (J) in males, the decreased TSH in DK and DKA did not reach the statistical significance. Notes: *p<0.05, **p<0.01, ***p<0.001, ****p<0.0001. |
The Metabolic Correlational Relationships Between Age, BMI, Pancreatic Function, HbA1c, Bone Turnover, and Thyroid Function in DM Alone, DK, and DKA
The correlational relationships of a total of three groups revealed that N-MID was strongly positively correlated with β-CTX, FT3, and TT3 but negatively correlated with HbA1c in spearman’s analyses. The level of β-CTX, on the other hand, was only associated with N-MID (Figure 6). Second, we discovered that N-MID was positively correlated with β-CTX but negatively correlated with HbA1c in the DM alone group. The β-CTX, on the other hand, was only correlated with N-MID (Figure 7). The DK group’s correlational analyses revealed that N-MID was only strongly positively correlated with β-CTX, Ca, TT3, and FT3 but negatively correlated with age. The β-CTX, on the other hand, was only correlated with N-MID (Figure 8). Furthermore, we discovered that N-MID was only strongly positively correlated with β-CTX, TT3, and FT3 but negatively correlated with TG in the DKA group. The β-CTX, on the other hand, was only correlated with N-MID (Figure 9).
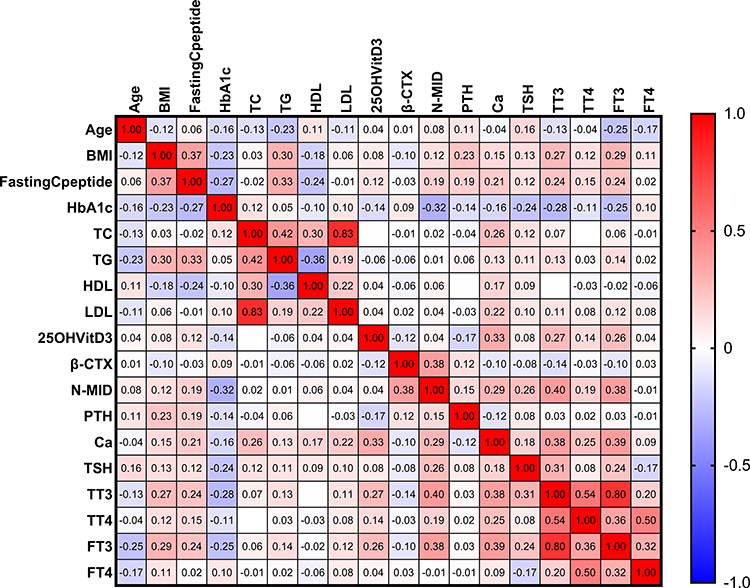 |
Figure 6 The heatmap depicts the correlational relationships in analyzed variables of three groups. We found that β-CTX (r=0.38, p<0.05), TT3 (r=0.40, p<0.05), and FT3 (r=0.38, p<0.05) were positively (displayed in red color) correlated with N-MID, while HbA1c (r=−0.32, p<0.05) was negatively (shown in blue color) correlated with N-MID. The gradient in red represents the degree of positive correlation, while the gradient in blue represents the degree of negative correlation, as shown by the color bar on the right side of the map. |
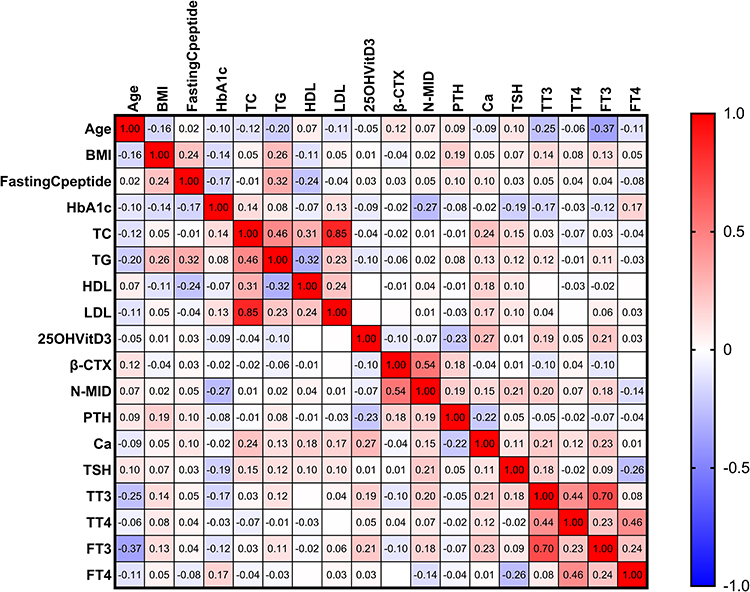 |
Figure 7 The heatmap depicts the relationship between other variables and the N-MID of the DM alone group. In the map, we found that the β-CTX (r=0.54, p<0.05) was only strongly positively (displayed in red color) correlated with the N-MID, whereas the HbA1c (r=−0.27, p<0.05) was negatively (displayed in blue color) correlated with N-MID. The gradient degree in red represents the degree of positive correlation. In contrast, the gradient degree in blue represents the degree of negative correlation, as shown by the color bar on the right side of the map. |
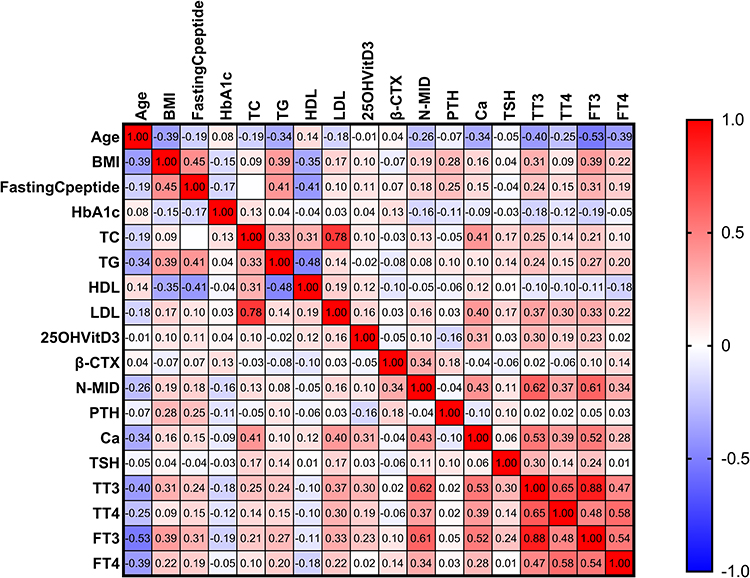 |
Figure 8 The heatmap depicts the correlation between the other variables and the NMID of the DK group. We found that β-CTX (r=0.34, p<0.05), Ca2+ (r=0.43, p<0.05), TT3 (r=0.62, p<0.05) and FT3 (r=0.61, p<0.05) were strongly positively (displayed in red color) correlated with N-MID, whereas age (r=−0.27, p<0.05) was strongly negatively (displayed in blue color) correlated with N-MID. The degree of the gradient in red represents the degree of positive correlation, and the degree of the gradient in blue represents the degree of negative correlation, as shown in the map’s right color bar. |
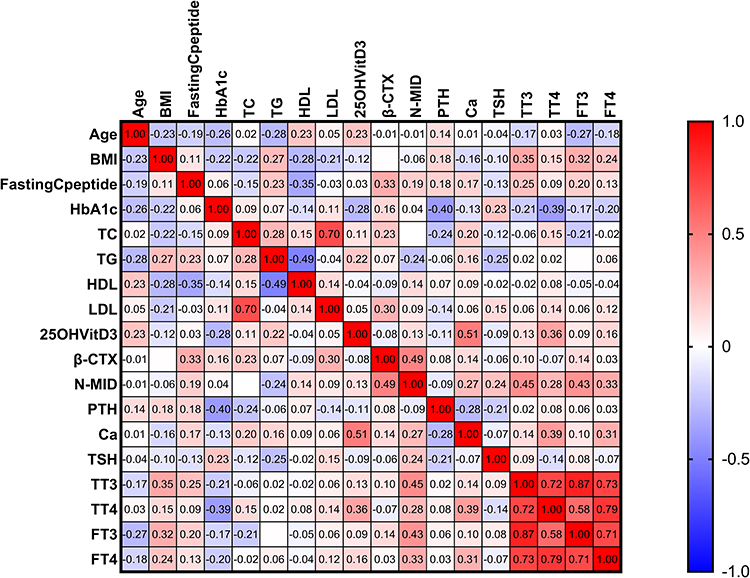 |
Figure 9 The heatmap depicts the correlation between the other variables and N-MID in the DKA group. We found that β-CTX (r=0.49, p<0.05), TT3 (r=0.45, p<0.05), FT3 (r=0.43, p<0.05) was strongly positively (displayed in red color) correlated with N-MID, but TG (r=−0.24, p<0.05) was strongly negatively (displayed in blue color) correlated with N-MID. The gradient in red represents the degree of positive correlation, while the gradient in blue represents the degree of negative correlation, as shown by the color bar on the right side of the map. |
The Multilinear Regression Analyses Reveal the N-MID Determinants in the Background of DM Alone, DK, and DKA
Multilinear regression analyses revealed that β-CTX (β=0.564), HbA1c (β=−0.196), TT3 (β=0.183), 25-OH-VitD3 (β=−0.120) were the independent determinants of N-MID in DM alone, whereas FT3 (β=0.491), β-CTX (β=0.315) were in DK, and FT3 (β=0.420), β-CTX (β=0.367), TG (β=−0.278) in DKA (Tables 2–4).
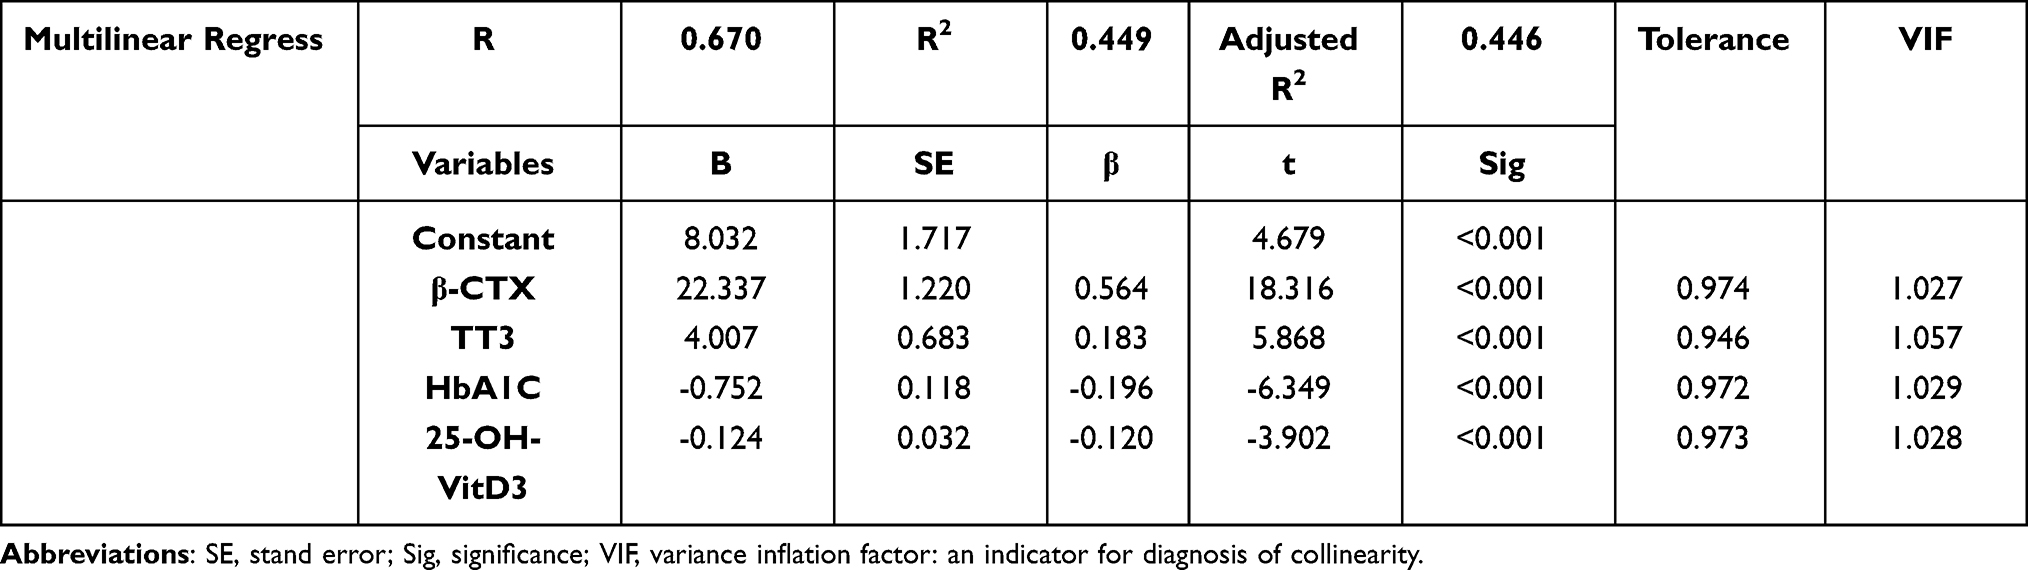 |
Table 2 A Multilinear Regression Model of N-MID in DM Group Alone Revealed That β-CTX, TT3, HbA1C, and 25-OH-VitD3 Were Independent Driving Factors of the Change in N-MID. Specifically, β-CTX and TT3 Levels Were Positively Related to N-MID, While HbA1c and 25-OH-VitD3 Were Negatively Related to N-MID. These Parameters Could Explain 44.9% (R Square Was 0.449) of the Observed N-MID Change in the Current Study |
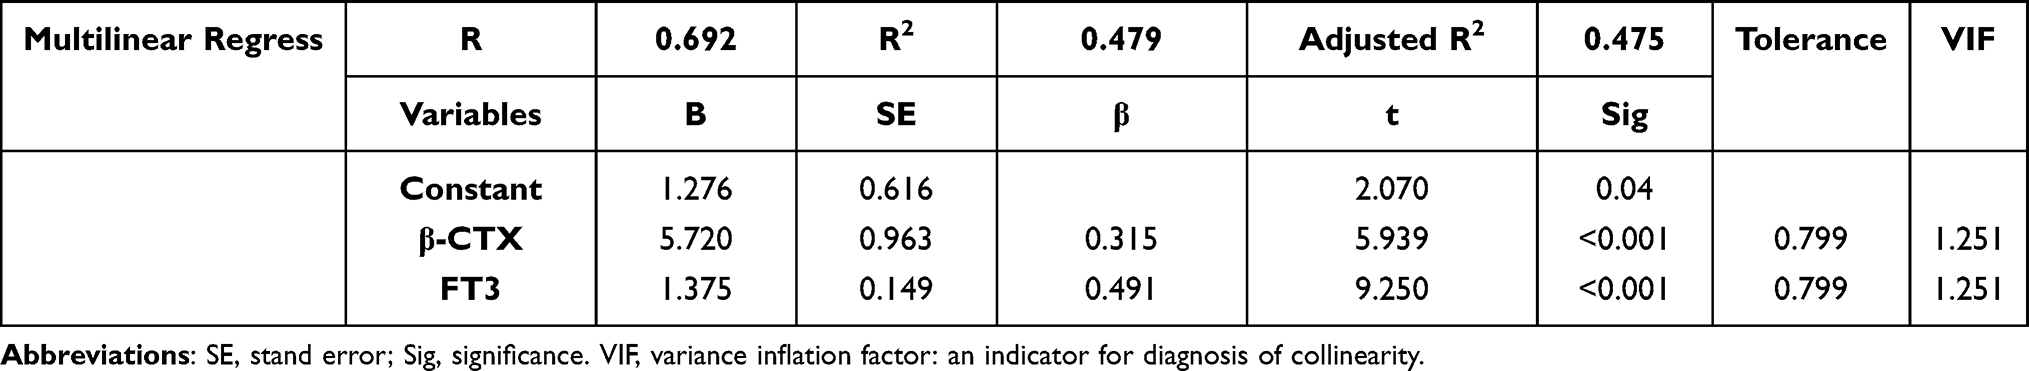 |
Table 3 A Multilinear Regression Model of N-MID in DK Group Revealed That Only β-CTX and FT3 Were Independently Driving Factors of N-MID, Which Was Positively Related to N-MID. These Parameters Could Explain 47.9% (R Square Was 0.479) of N-MID Change in the Current Study |
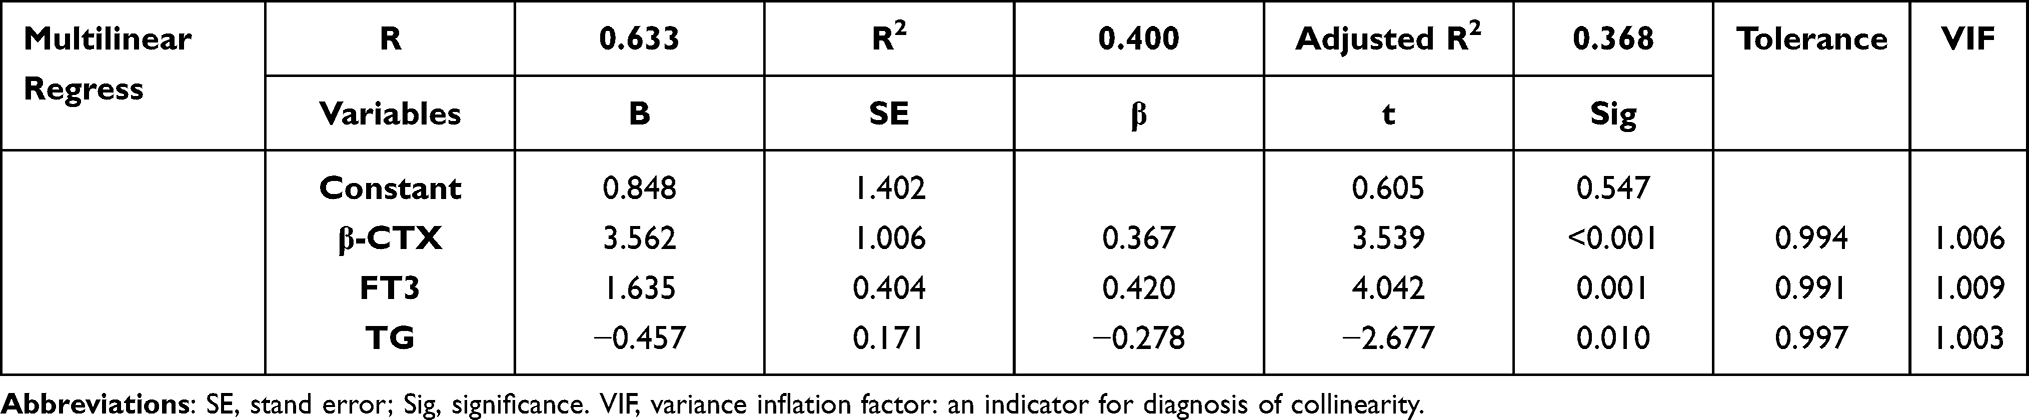 |
Table 4 A Multilinear Regression Model of N-MID in DKA Group. The Levels of β-CTX, FT3, and TG Were the Independent Driving Factors of N-MID Change. Besides TG, The Other Three Variables Were Positively Related to N-MID Change. This Model Could Explain 40% (R Square Was 0.400) of the Observed N-MID Change in the Current Study |
The Analyses of Bone Turnover in Recurrent DK or DKA Patients
Many patients in our clinical work experienced recurrent DKA and had to be admitted to the hospital. To investigate its relationship with bone metabolism parameters, we compared the recurrent DKA and DK group (RDK, n=17, ≥2 times in the three-year study period) with the single onset of DK or DKA in a three-year study period (SDK, n=272) admitted to our hospital and found that only 25-OH-VitD3 was significantly lower in RDK (13.935±5.461 ng/mL vs 17.019±7.666 nmol/L, reference level: >30 ng/mL, p<0.05) compared with SDK. PTH and N-MID levels in RDK increased but did not reach statistical significance (p>0.05) (Figure 10). We then ran multilinear regression analyses on N-MID in the RDK group. We discovered that the level of β-CTX was significantly independently associated with the N-MID level in the RDK group (Table 5).
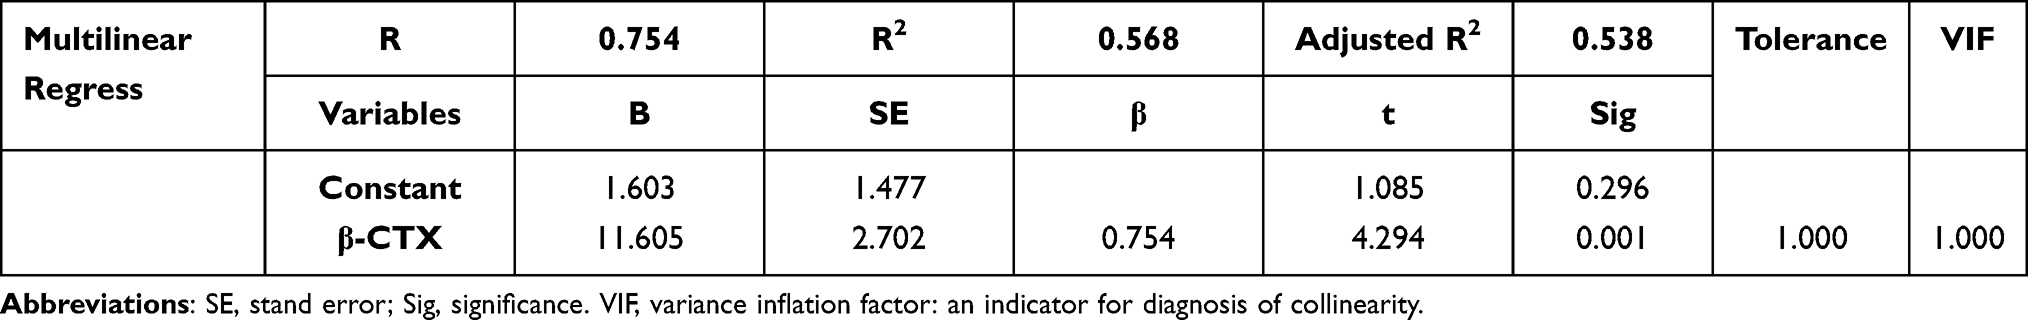 |
Table 5 A Multilinear Regression Model of N-MID in RDK Group. The Level of β-CTX Was the Only Independent Driving Factor of the Change in N-MID. The Level of β-CTX Was Positively Related to N-MID, and This Model Could Explain the 56.8% (R Square Was 0.568) Change of the Observed N-MID Change in the Current Study |
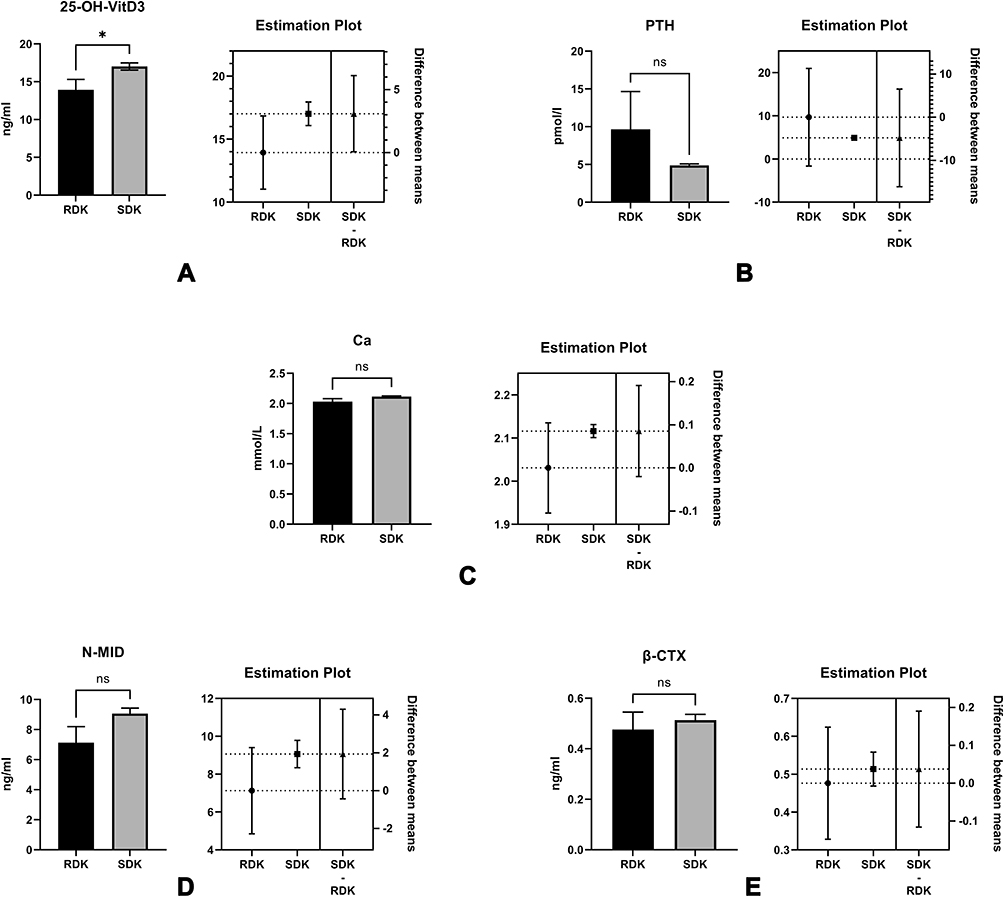 |
Figure 10 The comparisons of the levels of 25-OH-VitD3 (A), PTH (B), Ca2+ (C), N-MID (D), and β-CTX (E), we found that only the level of 25-OH-VitD3 was significantly reduced in the RDK group (p<0.05). Notes: The right plot map beside each comparison bar plot shows the difference between the data’s mean, minimum and maximum range. RDK, the group with recurrent diabetic ketosis or diabetic ketoacidosis; SDK, with single onset DK or DKA,*p<0.05. |
Discussion
Our recent findings show that in the mild and severe complications of diabetes (DK or DKA), serum Ca2+, 25-OH-VitD3, and N-MID levels decreased while the bone-breaking marker, β-CTX, increased (Figure 11). Diabetic ketosis (DK) and ketoacidosis (DKA) are two distinct stages of glucose dysregulation and acute diabetes complications. They commonly manifest in patients with insulin deficiency, most notably type 1 diabetes mellitus (T1DM) and advanced type 2 diabetes mellitus (T2DM). Infection, missed insulin administration, loss of diet control, dehydration, drugs, and alcohol are all common causes of these complications.19 They can also occur in newly diagnosed T2DM patients who have no awareness of the disease. As a result, some of these patients frequently present with DK or DKA. They are usually associated with a higher BMI and may be attributed to high glucose toxicity and specific gene disparity with normal T2DM, but not necessarily a pancreatic β-cell loss.20 These patients with ketosis-prone T2DM (KPT2D) have been reported in numerous previous studies to be neither chronically insulinopenic nor autoimmune and are highly prevalent and dominated in middle-aged male Africans with positive family history, overweight, and dysmetabolic traits like T2DM: abdominal obesity, hypertension, dyslipidemia, but presented with ketosis or ketoacidosis as T1DM. These patients could be insulin-free after effective or intensive therapy and maintain adequate glycemic control for many years. However, there have been reports of DK or DKA recurrence in this group who were only on diet control.21 In Asian populations, there have been reports of some Chinese diabetic children who have been primarily diagnosed with DK or DKA in recent years. The prevalence at onset was a mean age of ≤35 years, with 7.6% requiring admission to a large urban hospital in China. These patients are more likely to be men with abnormal lipid metabolism and reversible β-cell dysfunction.22,23 In our study, DK or DKA patients with age ≤ 35 were 36 (30 males and 6 females, 29 were negative for glutamic acid decarboxylase antibody (GAD) and/or other pancreatic antibodies), with mean HbA1c 12.07%, fasting C-peptide 0.37 nmol/L, and TG 2.69 mmol/L, which was generally consistent with the current studies reported; we also found the level of 25-OH-VitD3 was 14.76 ng/mL, N-MID 9.87 ng/mL, FT3 4.57 pmol/L, indicating the change of bone and thyroid change in this group. In recent years, the incidence of DK or DKA in patients with T2DM has increased due to a variety of factors, including inappropriate use of oral diabetes drugs (OADs) such as sodium-glucose cotransporter-2 inhibitors (SGLT-2i), infection, loss of diet control, stress, cardiovascular disease, and so on.24 Insulin deficiency and an increase in hyperglycemia-promoting hormones such as growth hormone, glucagon, glucocorticoids, and thyroid hormones cause abnormal energy metabolism and glucose osmotic diuresis, resulting in dehydration, hypoperfusion, and a water-electrolyte imbalance.25 Excess ketone bodies mitigate the acidosis-inducing effects of body alkali. Although T1DM is well known for causing osteoporosis (OP), which is one of the direct consequences of T1DM,26,27 determining whether OP is a primary disease or a complication of T2DM is complex, and its pathological process can be attributed to a variety of factors, including insulin resistance, advanced glycation end products (AGEs), oxidative stress, anti-diabetes oral administration drugs (OADs) such as thiazolidinedione (TZD), bone transformation malfunction, and many others.28 Furthermore, some research suggests that with proper examination, bone mineral density (BMD) in T2DM patients may not decline or even increase. Despite this, T2DM patients had a higher rate of pathological bone fracture than the general population.29 According to a recent pilot animal study, hyperglycemia may alter the microstructure of rat bones, resulting in bone fragility. They also discovered that hyperketonemia can reduce bone quality.8 Thus, at the extreme hyperglycemic stage, such as DK or DKA, the goal of our new research was to look at changes in biomarkers associated with bone transformation and then to speculate on their potential mechanism.
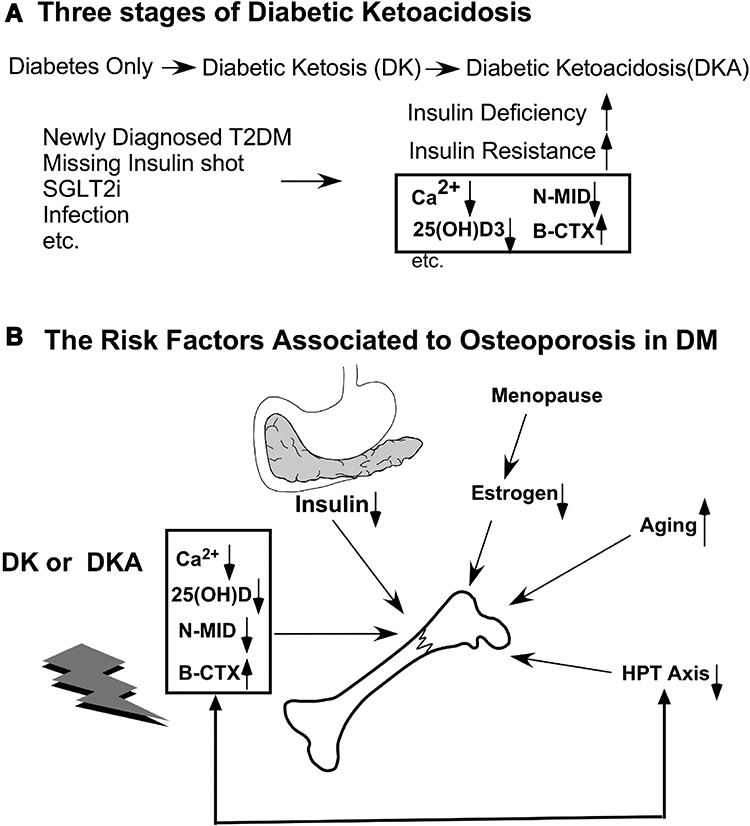 |
Figure 11 The relationship between bone turnover markers and diabetic ketoacidosis (DKA) conditions. (A) Many risk factors, such as missing insulin shots, infection, and unawareness of DM in individuals with newly diagnosed diabetes, can all lead to ketoacidosis. (B) Besides the factors that cause osteoporosis (OP), such as deficiency of insulin, abnormal estrogen after menopause in women, aging, and imbalance of the hypothalamus-pituitary-Thyroid (HPT) axis, diabetic ketoacidosis causes serum Ca2+, 25 (OH) D, N-MID to decrease while the bone-breaking marker, β-CTX, to increase. |
In our analyses, we discovered that DK and DKA patients had lower fasting c-peptide levels and higher HbA1c levels than patients with DM alone, implying that patients with DK or DKA may have a transitory and episodic lower pancreatic function as well as worse glycemic control, which is consistent with the literature and clinical judgment.30 Once diagnosed with DK or DKA, all patients in our study received standard fluid therapy and low-dose short-action insulin therapy (0.1 U/kg). In contrast, patients with DM alone received standard oral anti-diabetic drugs such as metformin, sitagliptin, sulfonylurea, TZD, α-glucosidase inhibitors, SGLT-2i, and GLP-1 receptor agonists, and combined basal or bolus insulin therapy. As a result, these medications had no direct effect on blood calcium concentrations. We also added no calcium supplementation to the complicated patients with DK or DKA, and few patients received calcium supplementation upon arrival at the ward. As a result, we could conclude that changes in these blood parameters reflected the state of bone metabolism.
Then, we primarily analyzed the indices of bone metabolism and calcium homeostasis. In the context of DKA, research has shown that due to the hemoconcentration situation in DKA, ionized calcium may remain at an average or modest level. On the other hand, the total calcium level was depleted due to acidosis and a negative nitrogen balance.31 Our findings on serum total calcium levels agreed with previous research. PTH, which promotes calcium resorption, and 25-OH-VitD 3, a significant form reflecting the vitamin D reservoir and precursor of active 1,25-OH-VitD3, were two essential hormones related to blood calcium regulation. We discovered that the 25-OH-VitD3 was significantly reduced in DKA because the liver produces it, and there is a high proportion of vitamin D3 deficiency in many Asians, implying that acidosis may exacerbate the lower synthesis of 25-OH-VitD3 in the liver, resulting in a virtually lower 1,25-OH-VitD3 and blood calcium level.32 We also discovered a decrease in PTH, though it was not statistically significant, implying that PTH deficiency may not be the primary cause of calcium depletion.33 One of the sources of serum calcium is the bone calcium pool, which is linked to the balance of osteoblast and osteoclast activity. Thus, in DKA, osteoblast activity was decreased, as evidenced by the reduced level of N-MID, whereas osteoclast activity was increased, as evidenced by the increased level of β-CTX. The underlying process may be influenced by acidosis and insulin deficiency. To rule out the effects of age and gender, we examined N-MID and β-CTX of DM alone, DK, and DKA in male and female subjects of various ages (≥50 or 50). We found a decline in N-MID in DK and DKA in male patients regardless of age or gender; supporting DK or DKA may reduce osteoblast activity while increasing osteoclast activity in male patients. However, we found no corresponding significant trend in females under 50 years old, which is the opposite of the situation in females over 50 years old and could be explained in part by estrogen’s action on bone neogenesis in women under 50 years old. These findings were consistent with a series of previous studies.34–36
As a result of decompensated acidosis, the hypothalamus-pituitary-thyroid (HPT) axis may be disrupted. Many severe systemic disorders, such as heart failure, respiratory failure, renal insufficiency, and aging, can disrupt the function of the HPT axis, which is technically known as euthyroid-sick-syndrome (ESS), non-thyroid illness syndrome, because the thyroid is not directly or organically impaired.37 Low T3 syndrome,38 which is characterized by a lower level of T3 and an increased level of reverse T3 (rT3),39 but an average level of TSH, is a common clinical condition. After the original condition was corrected, the ESS would decrease. According to our findings, TSH, TT4, FT3, FT4, and the ratio of TT3/TT4, FT3/FT4 were all dramatically reduced in DKA, indicating the presence of ESS. We discovered this trend after controlling for age and gender, though some data did not reach statistical significance, which we believe is due to sampling size. This change could be caused by hyperglycemia, the presence of ketone bodies, acidosis, or other metabolites. These metabolites reduce thyroglobulin hydrolysis and TT4 while desensitizing TSH to TRH release. According to one of our published studies, thyroid hormones and TSH may influence bone transformation in postmenopausal women.40 This concept was also supported by multilinear regression analyses in this recent study, which found that the level of FT3 could predict the status of N-MID.
We used Spearman correlation analyses on all necessary laboratory test indices to investigate the possible mechanism of the N-MID decrease in DKA. Surprisingly, we discovered that HbA1c was only firmly negatively correlated with N-MID in three groups, while BMI and fasting c-peptide had only a weak association. β-CTX, TT3, and FT3 levels, on the other hand, were strongly positive with N-MID levels in both DK and DKA, indicating a strong correlation between osteoblast activities and the HPT axis. We only found a significant positive correlation between the level of β-CTX and N-MID in the group with DM alone, implying that multiple factors cause the OP in T2DM. As a result, in the following step, we run multilinear regression analyses on the data from the three groups. Our established models discovered that β-CTX and FT3 contributed to the N-MID level in DK, but β-CTX, FT3, and TG contributed to the N-MID level in DKA. As a result, we hypothesized that β-CTX secretion could be influenced locally and mutually by N-MID release by osteoblasts, whereas FT3 activity could influence bone formation as represented by the N-MID level. Hyperglycemia may not be a direct stimulator of bone change in DK or DKA. Lower pH, excessive ketone bodies derived from increased TG, and hyperglycemia in DK and DKA may affect the HPT axis, suppressing bone production and disrupting the balance of bone reabsorption by osteoclasts. Lower FT3, indicating decreased thyroid function, suppresses bone production by disrupting osteoclasts’ balance of bone reabsorption. In addition to the β-CTX and FT3 described above in DK and DKA, HbA1c and 25-OH-VitD3 were essential factors in the effect of the N-MID level in the DM alone group.
Another primary goal was to identify if recurrent DKA worsened osteoporosis (OP) indicators in diabetic patients. In terms of calcium homeostasis, we found significant decreases in 25-OH-VitD3, implying that these patients’ 25-OH-VitD3 synthesis is permanently low. We could expect lower 1,25-OH-VitD3 and blood calcium levels (p>0.05) because the content of 25-OH-VitD3 and kidney function may influence the production of 1,25-OH-VitD3. However, we did not assess the concentration of vitamin D2, which would be the primary source in eastern and southern Asians. We also notice an increase in PTH (p>0.05), which could compensate for blood calcium depletion by promoting calcium absorption, implying that PTH may have Ca2+ compensation activities in RDK. However, recurrent acidosis decreased N-MID and β-CTX levels related to bone metabolism (p>0.05). Furthermore, β-CTX was closely related to the change in N-MID in the RDK group. As a result, we propose that for recurrent DKA and DK patients, follow-up bone metabolism indices and supplementation of active vitamin D2 and calcium agents, as well as education on prevention of factors that induce RDK, such as lifestyle intervention, which reduces the possibility of infection and improves adherence, should be mandatory.
Conclusion
Overall, our preliminary findings suggest that DK and DKA may affect bone turnover markers in diabetic patients. We hypothesize that this phenomenon is caused by thyroid function and other unknown mechanisms. Recurrent DK or DKA, on the other hand, may result in a worsening of the vitamin D reservoir deficit, which may affect bone maker levels. However, due to the limitations of the current study, whether calcium or vitamin D3 supplementation to prevent osteoporosis in patients at risk of DK or DKA requires further investigation.
Ethical Statement
This study’s publication and ethical approval, including surveys and sampling, furthermore, examinations were obtained from the Shanghai Pudong Hospital Ethics Committee and Fudan University (NO. WZ-01, Shanghai, China). Before the study, informed written consent was obtained. The guidelines outlined and procedures used in this study adhered to the Helsinki Declaration.
Author Contributions
All authors contributed significantly to work reported, whether in the conception, study design, execution, data acquisition, analysis, and interpretation, or in all of these areas; participated in drafting, revising, or critically reviewing the article; gave final approval of the version to be published; agreed on the journal to which the article was submitted; and agreed to be accountable for all aspects of the work.
Funding
This work was supported by the Project of Key Medical Discipline of Pudong Hospital of Fudan University (Zdxk2020-11), Project of Key Medical Specialty and Treatment Center of Pudong Hospital of Fudan University (Zdzk2020-24), Integrative Medicine special fund of Shanghai Municipal Health Planning Committee (ZHYY- ZXYJHZX-2-201712), Special Department Fund of the Pudong New Area Health Planning Commission (PWZzk2017-03), Outstanding Leaders Training Program of Pudong Health Bureau of Shanghai (PWR12014-06), Pudong New Area Clinical Plateau Discipline Project (PWYgy-2021-03), the Natural Science Foundation of China (21675034), National Natural Science Foundation of China (81370932), Shanghai Natural Science Foundation (19ZR1447500).
Disclosure
The authors declare that they do not have any conflicts of interest in this work.
References
1. Sealand R, Razavi C, Adler RA. Diabetes mellitus and osteoporosis. Curr Diab Rep. 2013;13(3):411–418. doi:10.1007/s11892-013-0376-x
2. Napoli N, Chandran M, Pierroz DD, Abrahamsen B, Schwartz AV, Ferrari SL. Mechanisms of diabetes mellitus-induced bone fragility. Nat Rev Endocrinol. 2017;13(4):208–219. doi:10.1038/nrendo.2016.153
3. Jain S. Role of bone turnover markers in osteoporosis therapy. Endocrinol Metab Clin North Am. 2021;50(2):223–237. doi:10.1016/j.ecl.2021.03.007
4. Zoch ML, Clemens TL, Riddle RC. New insights into the biology of osteocalcin. Bone. 2016;82:42–49. doi:10.1016/j.bone.2015.05.046
5. Mizokami A, Yasutake Y, Gao J, et al. Osteocalcin induces release of glucagon-like peptide-1 and thereby stimulates insulin secretion in mice. PLoS One. 2013;8(2):e57375. doi:10.1371/journal.pone.0057375
6. Mizokami A, Yasutake Y, Higashi S, et al. Oral administration of osteocalcin improves glucose utilization by stimulating glucagon-like peptide-1 secretion. Bone. 2014;69:68–79. doi:10.1016/j.bone.2014.09.006
7. Rached MT, Kode A, Silva BC, et al. FoxO1 expression in osteoblasts regulates glucose homeostasis through regulation of osteocalcin in mice. J Clin Invest. 2010;120(1):357–368. doi:10.1172/JCI39901
8. Riddle RC, Frey JL, Tomlinson RE, et al. Tsc2 is a molecular checkpoint controlling osteoblast development and glucose homeostasis. Mol Cell Biol. 2014;34(10):1850–1862. doi:10.1128/MCB.00075-14
9. Garbossa SG, Folli F. Vitamin D, sub-inflammation and insulin resistance. A window on a potential role for the interaction between bone and glucose metabolism. Rev Endocr Metab Disord. 2017;18(2):243–258. doi:10.1007/s11154-017-9423-2
10. Pittas AG, Lau J, Hu FB, Dawson-Hughes B. The role of vitamin D and calcium in type 2 diabetes. A systematic review and meta-analysis. J Clin Endocrinol Metab. 2007;92(6):2017–2029. doi:10.1210/jc.2007-0298
11. Mera P, Ferron M, Mosialou I. Regulation of energy metabolism by bone-derived hormones. Cold Spring Harb Perspect Med. 2018;8(6):a031666. doi:10.1101/cshperspect.a031666
12. Mitri J, Dawson-Hughes B, Hu FB, Pittas AG. Effects of vitamin D and calcium supplementation on pancreatic β cell function, insulin sensitivity, and glycemia in adults at high risk of diabetes: the Calcium and Vitamin D for Diabetes Mellitus (CaDDM) randomized controlled trial. Am J Clin Nutr. 2011;94(2):486–494. doi:10.3945/ajcn.111.011684
13. Wei W, Jiang W, Gu W, et al. The joint effect of energy reduction with calcium supplementation on the risk factors of type 2 diabetes in the overweight population: a two-year randomized controlled trial. Aging. 2021;13(4):5571–5584. doi:10.18632/aging.202485
14. Gagnon C, Daly RM, Carpentier A, et al. Effects of combined calcium and vitamin D supplementation on insulin secretion, insulin sensitivity and β-cell function in multi-ethnic vitamin D-deficient adults at risk for type 2 diabetes: a pilot randomized, placebo-controlled trial. PLoS One. 2014;9(10):e109607. doi:10.1371/journal.pone.0109607
15. Ryu OH, Lee S, Yu J, Choi MG, Yoo HJ, Mantero F. A prospective randomized controlled trial of the effects of vitamin D supplementation on long-term glycemic control in type 2 diabetes mellitus of Korea. Endocr J. 2014;61(2):167–176. doi:10.1507/endocrj.EJ13-0356
16. Walter M, Kaupper T, Adler K, Foersch J, Bonifacio E, Ziegler AG. No effect of the 1alpha,25-dihydroxyvitamin D3 on beta-cell residual function and insulin requirement in adults with new-onset type 1 diabetes. Diabetes Care. 2010;33(7):1443–1448. doi:10.2337/dc09-2297
17. Kalra S, Aggarwal S, Khandelwal D. Thyroid dysfunction and type 2 diabetes mellitus: screening strategies and implications for management. Diabetes Ther. 2019;10(6):2035–2044. doi:10.1007/s13300-019-00700-4
18. Liu Q, Yang Z, Xie C, et al. The hyperglycemia and hyperketonemia impaired bone microstructures: a pilot study in rats. Front Endocrinol. 2020;11:590575. doi:10.3389/fendo.2020.590575
19. Gosmanov AR, Gosmanova EO, Kitabchi AE, et al. Hyperglycemic crises: diabetic ketoacidosis and hyperglycemic hyperosmolar state. In: Feingold KR, Anawalt B, Boyce A, et al., editors. Endotext. South Dartmouth (MA): MDText.com, Inc.Copyright © 2000–2021, MDText.com, Inc.; 2000.
20. Umpierrez GE, Smiley D, Kitabchi AE. Narrative review: ketosis-prone type 2 diabetes mellitus. Ann Intern Med. 2006;144(5):350–357. doi:10.7326/0003-4819-144-5-200603070-00011
21. Sjöholm Å:. Ketosis-prone type 2 diabetes: a case series. Front Endocrinol. 2019;10:684. doi:10.3389/fendo.2019.00684
22. Zhang M, Li Y, Cui W, et al. The clinical and metabolic characteristics of young-onset ketosis-prone type 2 diabetes in China. Endocr Pract. 2015;21(12):1364–1371. doi:10.4158/EP15778.OR
23. Ye S, Ran H, Zhang H, et al. Elevated serum triglycerides are associated with ketosis-prone type 2 diabetes in young individuals. Diabetes Metab Syndr Obes. 2021;14:497–504. doi:10.2147/DMSO.S296085
24. Bonora BM, Avogaro A, Fadini GP. Euglycemic ketoacidosis. Curr Diab Rep. 2020;20(7):25. doi:10.1007/s11892-020-01307-x
25. Fayfman M, Pasquel FJ, Umpierrez GE. Management of hyperglycemic crises: diabetic ketoacidosis and hyperglycemic hyperosmolar state. Med Clin North Am. 2017;101(3):587–606. doi:10.1016/j.mcna.2016.12.011
26. Hough FS, Pierroz DD, Cooper C, Ferrari SL, _ _. Mechanisms in endocrinology: mechanisms and evaluation of bone fragility in type 1 diabetes mellitus. Eur J Endocrinol. 2016;174(4):R127–R138. doi:10.1530/EJE-15-0820
27. Hamann C, Kirschner S, Günther KP, Hofbauer LC. Bone, sweet bone–osteoporotic fractures in diabetes mellitus. Nat Rev Endocrinol. 2012;8(5):297–305. doi:10.1038/nrendo.2011.233
28. Cooper ID, Brookler KH, Crofts CAP. Rethinking fragility fractures in type 2 diabetes: the link between hyperinsulinaemia and osteofragilitas. Biomedicines. 2021;9(9):1165. doi:10.3390/biomedicines9091165
29. Walsh JS, Vilaca T. Obesity, type 2 diabetes and bone in adults. Calcif Tissue Int. 2017;100(5):528–535. doi:10.1007/s00223-016-0229-0
30. Tittel SR, Sondern KM, Weyer M, et al. Multicentre analysis of hyperglycaemic hyperosmolar state and diabetic ketoacidosis in type 1 and type 2 diabetes. Acta Diabetol. 2020;57(10):1245–1253. doi:10.1007/s00592-020-01538-0
31. Martin HE, Wertman M. Serum potassium, magnesium, and calcium levels in diabetic acidosis. J Clin Invest. 1947;26(2):217–228. doi:10.1172/JCI101799
32. Huynh T, Greer RM, Nyunt O, et al. The association between ketoacidosis and 25 (OH)-vitamin D levels at presentation in children with type 1 diabetes mellitus. Pediatr Diabetes. 2009;10(1):38–43. doi:10.1111/j.1399-5448.2008.00439.x
33. Topaloglu AK, Yildizdas D, Yilmaz HL, Mungan NO, Yuksel B, Ozer G. Bone calcium changes during diabetic ketoacidosis: a comparison with lactic acidosis due to volume depletion. Bone. 2005;37(1):122–127. doi:10.1016/j.bone.2005.03.012
34. Korpi-Steiner N, Milhorn D, Hammett-Stabler C. Osteoporosis in men. Clin Biochem. 2014;47(10–11):950–959. doi:10.1016/j.clinbiochem.2014.03.026
35. Sharma D, Larriera AI, Palacio-Mancheno PE, et al. The effects of estrogen deficiency on cortical bone microporosity and mineralization. Bone. 2018;110:1–10. doi:10.1016/j.bone.2018.01.019
36. Khosla S, Monroe DG. Regulation of bone metabolism by sex steroids. Cold Spring Harb Perspect Med. 2018;8(1):a031211. doi:10.1101/cshperspect.a031211
37. Shao P, Guo S, Li G, Qin D, Li S, Luan Y. Determinants of deranged thyroid function parameters in children admitted for management of diabetic ketoacidosis/diabetic ketosis. BMC Endocr Disord. 2020;20(1):135. doi:10.1186/s12902-020-00616-2
38. Fliers E, Boelen A. An update on non-thyroidal illness syndrome. J Endocrinol Invest. 2021;44(8):1597–1607. doi:10.1007/s40618-020-01482-4
39. Halsall DJ, Oddy S. Clinical and laboratory aspects of 3,3’,5’-triiodothyronine (reverse T3). Ann Clin Biochem. 2021;58(1):29–37. doi:10.1177/0004563220969150
40. Liu C, Pan J, Wen S, et al. Low TSH levels within euthyroid range could play a negative role on bone mineral density in postmenopausal women with type 2 diabetes. Diabetes Metab Syndr Obes. 2021;14:2349–2355. doi:10.2147/DMSO.S307633
 © 2022 The Author(s). This work is published and licensed by Dove Medical Press Limited. The
full terms of this license are available at https://www.dovepress.com/terms
and incorporate the Creative Commons Attribution
- Non Commercial (unported, 3.0) License.
By accessing the work you hereby accept the Terms. Non-commercial uses of the work are permitted
without any further permission from Dove Medical Press Limited, provided the work is properly
attributed. For permission for commercial use of this work, please see paragraphs 4.2 and 5 of our Terms.
© 2022 The Author(s). This work is published and licensed by Dove Medical Press Limited. The
full terms of this license are available at https://www.dovepress.com/terms
and incorporate the Creative Commons Attribution
- Non Commercial (unported, 3.0) License.
By accessing the work you hereby accept the Terms. Non-commercial uses of the work are permitted
without any further permission from Dove Medical Press Limited, provided the work is properly
attributed. For permission for commercial use of this work, please see paragraphs 4.2 and 5 of our Terms.