Back to Journals » OncoTargets and Therapy » Volume 10
The coexpression of EphB4 and EphrinB2 is associated with poor prognosis in HER2-positive breast cancer
Authors Li X, Song C, Huang G, Sun S, Qiao J, Zhao J, Zhao Z ![]() , Li M
, Li M
Received 20 January 2017
Accepted for publication 22 February 2017
Published 21 March 2017 Volume 2017:10 Pages 1735—1742
DOI https://doi.org/10.2147/OTT.S132806
Checked for plagiarism Yes
Review by Single anonymous peer review
Peer reviewer comments 2
Editor who approved publication: Dr William C. Cho
Xuelu Li,1,* Chen Song,2,* Gena Huang,2 Siwen Sun,2 Jingjing Qiao,2 Jinbo Zhao,2 Zuowei Zhao,1 Man Li2
1Department of Breast Surgery, 2Department of Oncology, The Second Hospital of Dalian Medical University, Dalian, People’s Republic of China
*These authors contributed equally to this work
Objective: HER2 overexpression is associated with aggressive phenotypes in breast cancer, including increased tumor proliferation, greater invasiveness, and reduced overall survival. The overall response rate to HER2-targeted therapies remains <30%. There is an urgent need for the identification of efficient markers to predict patients with a poor prognosis. This study was designed to investigate the correlation between EphB4 and EphrinB2 expression and the clinicopathological characteristics of HER2-positive breast cancer.
Materials and methods: A total of 111 primary HER2-positive breast cancer patients were enrolled in this study (diagnosed since December 2005 to November 2010 from the Second Hospital of Dalian Medical University). The protein expression of EphB4 and EphrinB2 was examined by immunohistochemistry using paraffin-embedded tumor tissues.
Results: There was a significant correlation between EphB4 and EphrinB2 expression (P=0.013, r=0.255). Kaplan–Meier analysis showed that the prognosis of patients with a high expression of both EphB4 and EphrinB2 was significantly worse than the prognosis of patients with either EphB4 or EphrinB2 expression and patients with negative expression (hazard ratio [HR] =1.935, P=0.0224). However, high expression of EphB4 or EphrinB2 alone was not an independent prognostic factor to predict worse overall survival. To summarize, HER2-positive breast cancer patients with overexpression of both EphB4 and EphrinB2 were associated with the worst prognosis.
Conclusion: High expression of EphB4 and EphrinB2 correlated with poor overall survival, which can serve as an independent prognostic indicator in primary HER2-positive breast cancer patients.
Keywords: breast carcinoma, EphB4, EphrinB2, prognosis
Introduction
Eph receptors, the largest subfamily of receptor tyrosine kinases (RTKs), are transmembrane proteins comprising classes A (A1–A8, A10) and B (B1–B4, B6) based on sequence homology and ligand affinity.1 EphA is embedded in cell membrane and can bind to EphrinA (A1–A5), while membrane-bound EphB can recognize cognate EphrinB (B1–B3).2 The Ephrin/Eph system has been implicated in various kinds of cellular processes, such as physiological or pathological angiogenesis, cell proliferation, differentiation, and cell migration. EphB4 binds to EphrinB2 that is encoded by the EFNB2 gene, but not to other EphrinB ligands.3 Previous studies have revealed that EphrinB2 and its receptor EphB4 play a crucial role in the development of the cardiovascular system during embryonic development.4 Additionally, the coexpression of EphB4 and EphrinB2 has been observed in glioblastoma, papillary thyroid carcinoma, ovarian cancers, and uterine cervical cancers.1,2,5–7 However, the association of EphB4 and EphrinB2 expression with clinicopathological features and prognosis in breast cancer remains elusive.
Transcriptional profiling analyses have reproducibly identified the five major subtypes of breast cancers, including normal-like, luminal A, luminal B, HER2/Neu-positive, and basal-like breast cancers. Among these subtypes, HER2-positive breast cancer accounts for ~20%–30% of all breast cancers and is associated with poor overall survival. HER2-targeting monoclonal antibody trastuzumab has shown positive clinical efficacy that can extend the overall survival of HER2-positvive breast cancer patients. Unfortunately, the overall response rate to HER2-targeted therapies remains <30%.8 Till now, little progress has been made clinically to overcome resistance to HER2-targeted therapies. This prompted us to investigate other prognostic markers to distinguish patients with poor prognosis. In this study, we assessed the expression of EphB4 and EphrinB2 in HER2-positive breast cancers, aiming to understand the clinical significance of EphB4 and EphrinB2 expression.
Materials and methods
Samples and clinicopathological data
A total of 111 surgically resected breast cancer specimens and eight benign breast tissues were collected from the Second Hospital of Dalian Medical University between December 2005 and November 2010. None of the patients had received radiotherapy or chemotherapy prior to surgery. The inclusion criteria for this study are as follows: 1) pathological examination and HER2+++ and/or HER2 amplification, 2) ≥15 lymph nodes were examined after the surgery, 3) the tumor specimens of tissue microarray were unbroken and dyed uniformly by the antibody, and 4) the availability of a complete medical record. The demographic and clinical data of each patient were obtained from medical records. Telephone follow-ups were performed every 3 months since the date of surgery. Seventeen patients, not fulfilling the inclusion criteria, were excluded (Figure 1D). Written informed consent was obtained from all participants included in the study and these and the experimental protocol were approved by the ethics committee at the Second Hospital of Dalian Medical University. This study does not contain any studies with human participants or animals performed by any of the authors.
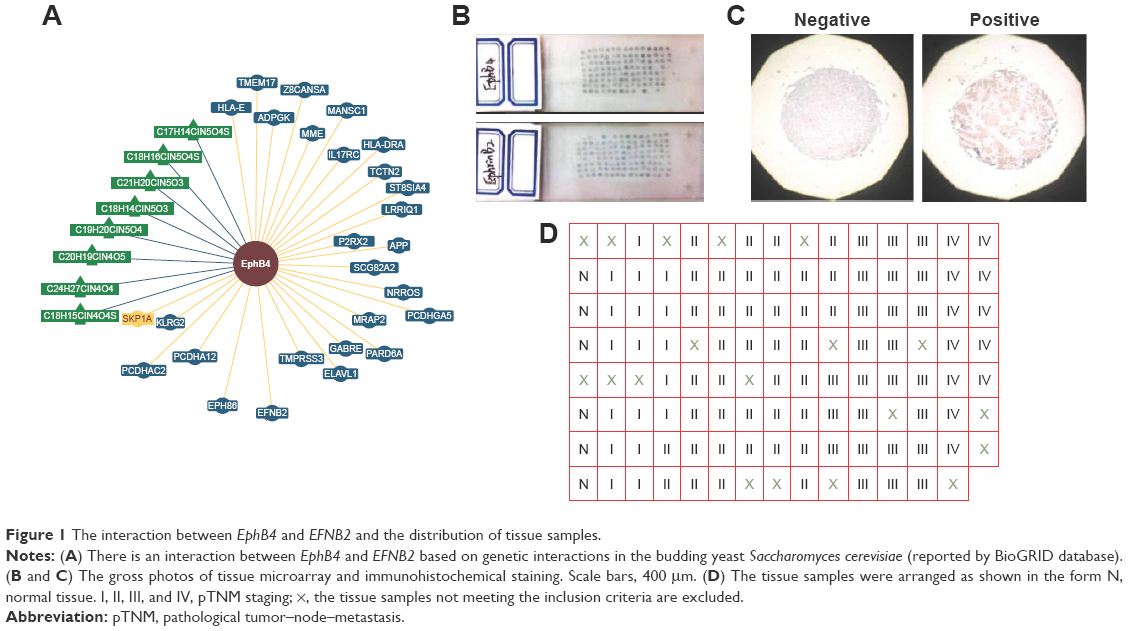 | Figure 1 The interaction between EphB4 and EFNB2 and the distribution of tissue samples. |
Tissue microarray and immunohistochemistry
The samples were fixed in 10% formalin (pH 7.0) before being embedded in paraffin. All samples were evaluated by three experienced pathologists independently, who confirmed the diagnosis and were blinded to patient details. The samples were constructed using microarrayer, then cut to 4 μm serial sections, and placed on a glass slide for immunohistochemistry (15×8) (Figure 1B). The protein expression of EphB4 and EphrinB2 was measured following a two-step method. Rabbit anti-EphB4 polyclonal antibody (1:50) and rabbit anti-EphrinB2 polyclonal antibody (1:100) were purchased from Abcam. The DAB kit was purchased from Zhongshan Goldenbridge Biotechnology Company (Beijing, China). All procedures were carried out according to the manufacturer’s instructions.
Assessment of immunohistochemistry staining
EphB4- and EphrinB2-positive staining was defined as samples displaying clear brown granules. The staining was assessed by two experienced pathologists independently, who were blinded to patient diagnosis and prognosis. The expression levels were evaluated by the proportion and intensity of positively stained cells. The staining intensity was as follows: 0, negative; 1, light yellow; 2, brownish-yellow; and 3, brown. The proportion score was as follows: 0, none; 1, ≤25%; 2, 25%–50%; and 3, >50%. Total score <3 was treated as negative and a score ≥3 was considered as positive.
Statistical analysis
Statistical analyses were performed using Prism 6. In the dot plots, each dot indicates an individual sample, with results representing median with interquartile ranges. Data of the cohorts were downloaded from cBioPortal (www.cbioportal.com). Two-tailed Student’s t-test and analysis of variance (ANOVA) were carried out to compare between two groups and among three groups, respectively. Kaplan–Meier curve, log-rank (Mantel–Cox) test, and the hazard ratio were analyzed using Prism 6. P-value <0.05 was considered statistically significant.
Results
EphB4 and EFNB2 are overexpressed in HER2-positive breast cancer
EphB4 and EphrinB2 can mediate the proliferation, migration, and metastatic potential of tumor cells.8 However, little is known about the involvements of EphB receptors and EphrinB ligands in the occurrence and development of breast cancer. We analyzed the expression of EphB4 and EFNB2 in the breast cancer data retrieved from the cBioPortal and observed that the overexpression of EphB4 and EFNB2 is recurrent (Figure 2A and B). To gain more insights into the potential relevance of EphB4 and EFNB2 expression in breast cancer, we analyzed gene expression data across three independent cohorts with a total number of >3,000 patients, including TCGA 2012, TCGA provisional, and Brca_metabric.
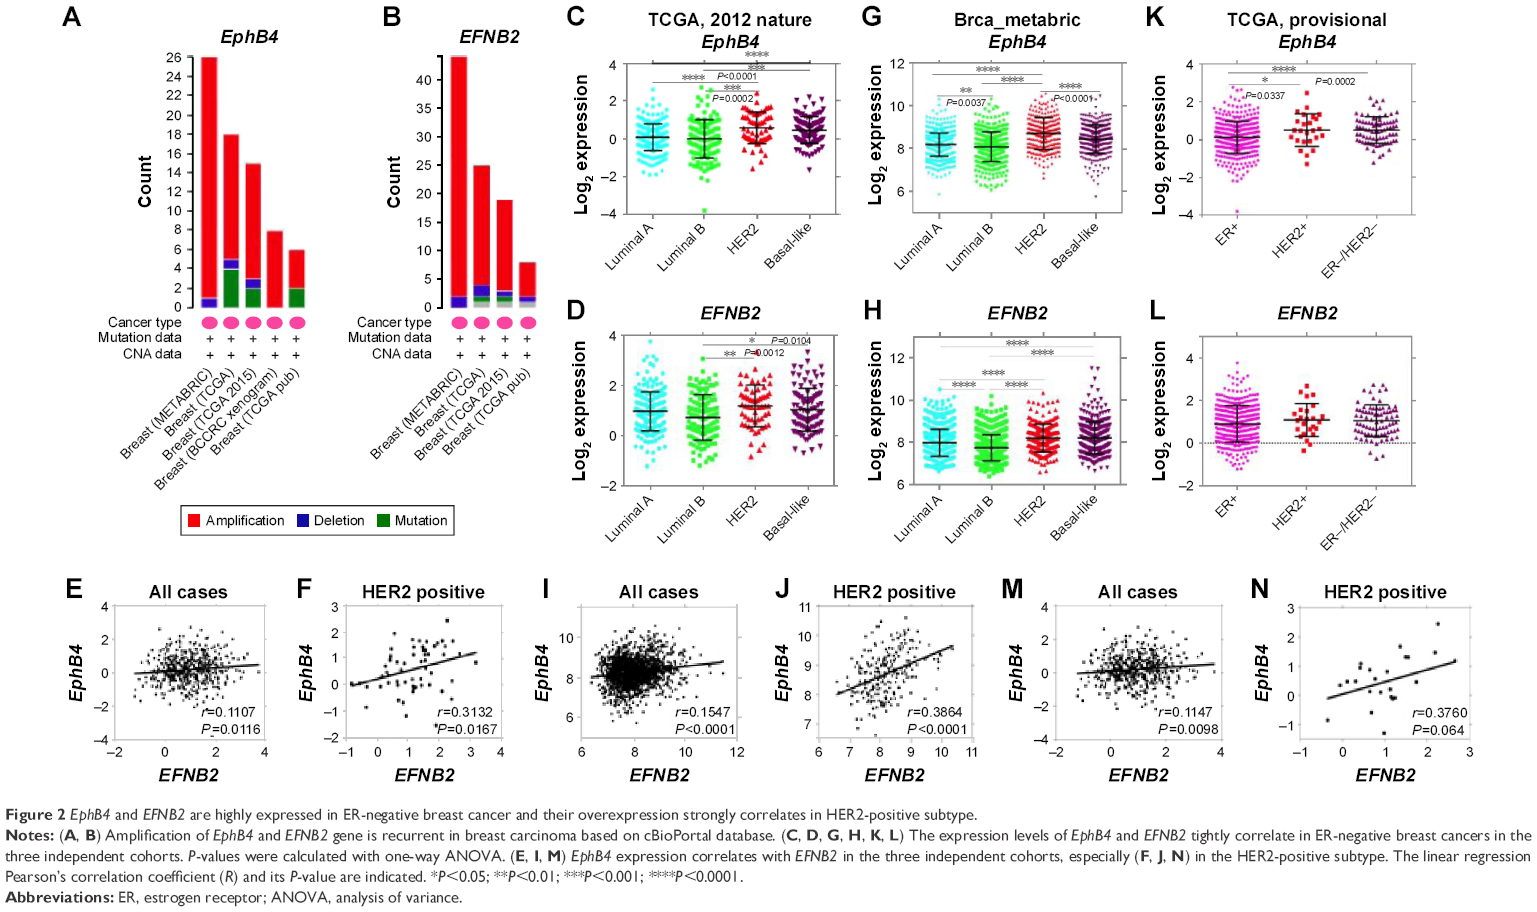 | Figure 2EphB4 and EFNB2 are highly expressed in ER-negative breast cancer and their overexpression strongly correlates in HER2-positive subtype. |
We observed strikingly similar patterns of EphB4 and EFNB2 expression among different subtypes of breast cancers. Luminal/estrogen receptor (ER)-positive subtype displayed low expression of EphB4 and EFNB2, while basal-like (ER- and HER2-negative) and HER2-positive breast cancers showed high expression levels of EphB4 and EFNB2, especially in the HER2-positive subtype (Figure 2C, D, G, H, K, and L). Besides, we also found that EphB4 expression correlated with EFNB2 expression in the HER2-positive subtype (Figure 2E, F, I, J, M, and N). Our findings indicated that EPHB4 and EFNB2 expression was elevated in breast cancers lacking the expression of ER, with stronger correlation with HER2 expression.
Clinical relevance of EphB4 and EphrinB2 expression
EphB4 is known to interact with EphrinB2 only among all EphrinB ligands. In addition, the interaction between EphB4 and EFNB2 was reported using the budding yeast Saccharomyces cerevisiae system (recorded by the BioGRID database) (Figure 1A). We wondered whether the expression of EphB4 and EFNB2 was also correlated at the protein level. Therefore, we assessed EphB4 and EphrinB2 protein expression with immunohistochemistry using the tissue microarray of 111 breast cancer specimens (Figures 1B and S1). Seventeen samples not fulfilling the inclusion criteria were excluded from further studies (Figure 1C and D). The expression scores of both proteins in all six control samples were <3 (regarded as negative) (Figure 3). The overexpression of EphB4 and EphrinB2 was predominantly detected in the cytoplasm of cancer cells (Figure 3B and D), with the low expression tissues showing weak or no staining (Figure 3A and C).
 | Figure 3 Evaluation of immunohistochemical staining for (A, B) EphB4 and (C, D) EphrinB2 in breast cancer tissue. |
Based on results from immunohistochemical analyses, there was no significant statistical association of EphB4 and EphrinB2 expression with patient age, number of metastatic axillary nodes, and size of primary tumor (Table 1). The expression of EphB4 was significantly associated with tumor–node–metastasis (TNM) stages (P=0.007) and histologic grades (P=0.004), while the expression of EphrinB2 was only significantly associated with histologic grades (P=0.032), suggesting that these variables might affect EphB4 and EphrinB2 expression.
 | Table 1 Correlation of EphB4 and EphrinB2 expression with clinicopathological features |
Correlation of EphB4 and EphrinB2 protein expression
We next investigated the correlation of EphB4 and EphrinB2 expression at the protein level. As shown in Table 2, our results showed a positive correlation between levels of EphB4 and EphrinB2 (r=0.255, P=0.013). These results at the protein level were consistent with the positive association of EphB4 with EFNB2 in the light of messenger RNA (mRNA) expression (Figure 2F, G, and N). In addition, we performed cox regression analysis to evaluate the clinical factors (Table 3).
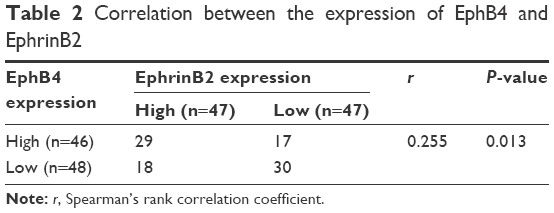 | Table 2 Correlation between the expression of EphB4 and EphrinB2 |
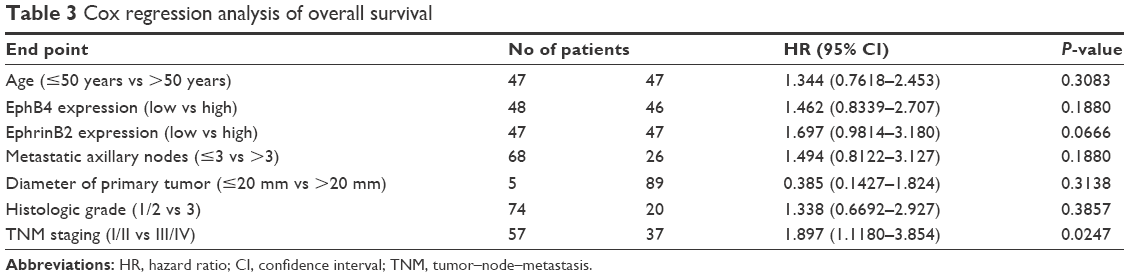 | Table 3 Cox regression analysis of overall survival |
HER2-positive breast cancers overexpressing both EphB4 and EphrinB2 exhibit worst prognosis
We next assessed whether EphB4 and EphrinB2 expression was correlated with overall survival in HER2-positive breast cancer patients. In this study, a total of 94 cases were followed up for 50 months after surgery. The median survival time was 36 months. Forty-five patients died during follow-up, and all causes of death were cancer related. Kaplan–Meier survival curves were plotted. We observed no significant difference between high- and low-expression groups of EphB4 and EphrinB2, respectively (Figure 4A and B). Interestingly, the survival time of patients with high EphB4 and EphrinB2 coexpression was significantly shorter than the others (P=0.0224; Figure 4C). Furthermore, when patients were divided into the following four groups, EphB4 and EphrinB2 coexpression, EphB4 positive, EphrinB2 positive, and both negative (Figure 4D), only coexpression and both-negative groups showed significant statistical differences (P=0.0384) (Figure 4E). These results indicated that the high expression of both proteins might serve as a prognostic indicator, suggesting that HER2-positive breast cancers expressing both proteins exhibited worst prognosis.
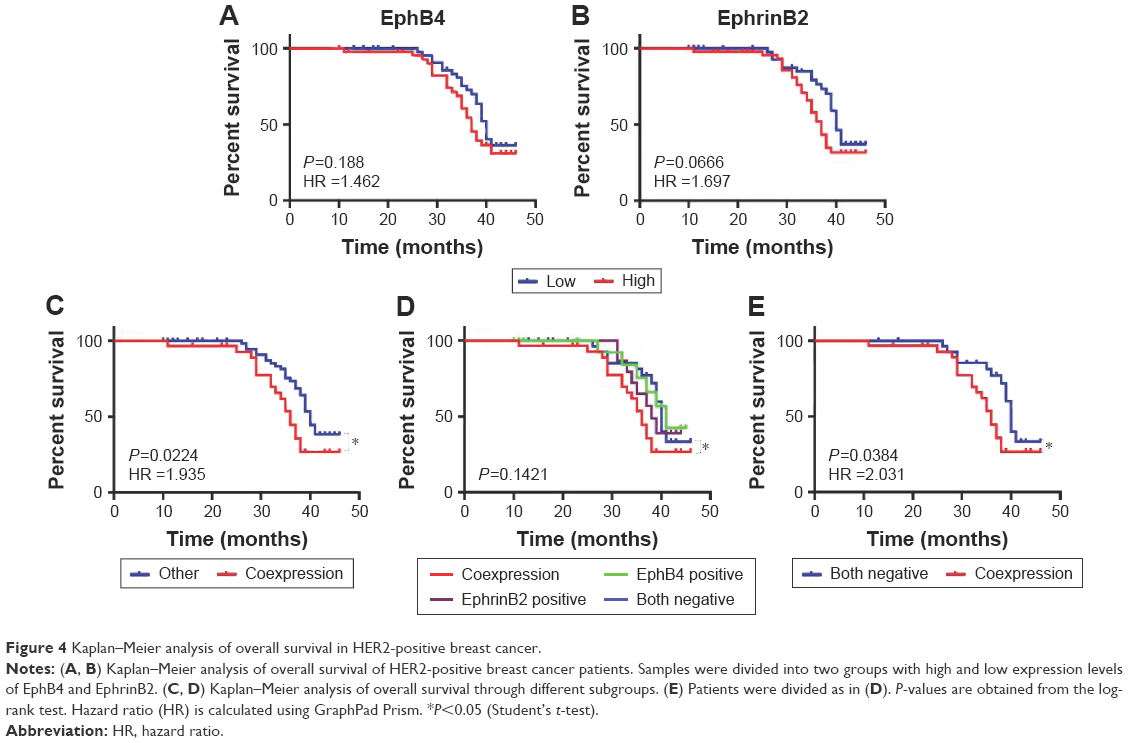 | Figure 4 Kaplan–Meier analysis of overall survival in HER2-positive breast cancer. |
Discussion
Breast cancer is a heterogeneous disease with differences in histology, therapeutic responses, and treatment outcomes. Different subtypes of breast cancer have diverse gene expression patterns and mutation landscapes, which collectively determine the characteristics of the specific disease and how it responds to the treatments clinically. HER2 amplification is associated with more aggressive phenotype, including increased tumor proliferation, greater invasiveness, and decreased overall survival.9 However, the overall response rate to HER2-targeted therapies remains <30%.8–10 Therefore, there is an urgent need for the development of efficient diagnostic markers for distinguishing patients with poor prognosis.
In a comprehensive analysis of expression data from multiple cohorts of breast cancer, we found that EphB4 and EFNB2 were highly expressed in breast cancers lacking ER/progesterone receptor (PR) expression (Figure 2). Importantly, we found a strong association of the expression of EphB4 with EFNB2 in HER2-positive breast cancer regardless of the treatment modality in three independent breast cancer cohorts. Our data indicated a potential role of the coexpression of EphB4 and EphrinB2 as a factor to predict disease outcome. The coexpression of EphB4 and EphrinB2 has been associated with tumor aggressiveness and poor outcome in a number of cancer types, including glioblastoma, papillary thyroid carcinoma, ovarian cancers, and uterine cervical cancers.1,2,5–7 In this study, we provide evidence to demonstrate the correlated overexpression of EphB4 and EphrinB2 and its association with disease prognosis in HER2-positive breast cancer. The prognostic relevance of EphB4 and EphrinB2 coexpression was likely due to the implications in cell proliferation, migration, and angiogenesis.11,12 However, further studies are required to unravel the mechanisms by which EphB4 and EphrinB2 coexpression promotes disease progression.
In this study, we examined the protein expression of EphrinB2 and EphB4 in 111 human HER2-positive breast cancer samples with immunohistochemistry. Consistent with the results of previous studies,1,2,5–7,13 we demonstrated an association between EphB4 and EphrinB2 expression in tumor tissues (P=0.013) (Table 2). Our study revealed that the survival time in EphB4 and EphrinB2 coexpression group was significantly shorter than the others (P=0.0224). When the samples were divided into coexpression, EphB4 positive, EphrinB2 positive, and both negative groups, only the coexpression and both negative groups showed significant statistical differences (P=0.0384) (Figure 4). Notably, neither EphrinB2 nor EphB4 expression presented an independent prognostic factor to predict patient overall survival in HER2-positive breast cancer (Figure 4A and B), which indicated that the expression levels of EphB4 or EphrinB2 individually did not correlate significantly with the clinical outcomes (P=0.188, P=0.0666). Other clinicopathological factors, such as age (P=0.3083), metastatic axillary nodes (P=0.1180), diameters of primary tumor (P=0.3138), and histologic grade (P=0.3857), were not found to be associated with prognosis neither (Table 3). The coexpression of EphB4 and ephrinB2 led to poor survival and can be recognized as a potential prognostic indicator in the primary HER2-positive breast cancer.
The major limitation of this study is due to the retrospective analysis. Meanwhile, the small sample size reduces the statistical power, and the limited number of samples expressing EphB4 and EphrinB2 should be considered as a limiting factor in data analysis.14 In addition, the data present here did not address the reason why HER2-positive breast cancers expressing both EphB4 and EphrinB2 at high levels had the worse overall prognosis. Further studies using cancer cell lines and animal models will be explored to gain more mechanistic insights into the implications of EphB4 and EphrinB2 expression in disease progression.
Conclusion
The coexpression of EphB4 and EphrinB2 may serve as a potential prognostic indicator in HER2-positive breast cancers. The data present here prompt us to speculate that the inhibition of EphB4/EphrinB2 signaling might represent a novel therapeutic strategy. Hence, our findings reported in this study may shed light on the development of novel targeted therapy against HER2-positive breast cancer.
Acknowledgments
The authors would like to thank all patients enrolled in this study. Xuelu Li and Chen Song are co-first authors. This work was supported by the National Natural Science Foundation of China (No 81071127, No 81471751, and No 81673762 to Zuowei Zhao; No 81650018 to Man Li).
Disclosure
The authors report no conflicts of interest in this work.
References
Sharma GK, Dhillon VK, Masood R, Maceri DR. Overexpression of EphB4, EphrinB2, and epidermal growth factor receptor in papillary thyroid carcinoma: a pilot study. Head Neck. 2015;37(7):964–969. | ||
Alam SM, Fujimoto J, Jahan I, Sato E, Tamaya T. Overexpression of ephrinB2 and EphB4 in tumor advancement of uterine endometrial cancers. Ann Oncol. 2007;18(3):485–490. | ||
Brambilla R, Schnapp A, Casagranda F, et al. Membrane-bound LERK2 ligand can signal through three different Eph related receptor tyrosine kinases. EMBO J. 1995;14(13):3116–3126. | ||
Yang D, Jin C, Ma H, et al. EphrinB2/EphB4 pathway in postnatal angiogenesis: a potential therapeutic target for ischemic cardiovascular disease. Angiogenesis. 2016;19(3):297–309. | ||
Tu Y, He S, Fu J, et al. Expression of EphrinB2 and EphB4 in glioma tissues correlated to the progression of glioma and the prognosis of glioblastoma patients. Clin Transl Oncol. 2012;14(3):214–220. | ||
Alam SM, Fujimoto J, Jahan I, Sato E, Tamaya T. Coexpression of EphB4 and ephrinB2 in tumour advancement of ovarian cancers. Br J Cancer. 2008;98(4):845–851. | ||
Alam SM, Fujimoto J, Jahan I, Sato E, Tamaya T. Coexpression of EphB4 and ephrinB2 in tumor advancement of uterine cervical cancers. Gynecol Oncol. 2009;114(1):84–88. | ||
Kullander K, Klein R. Mechanisms and functions of Eph and ephrin signaling. Nat Rev Mol Cell Biol. 2002;3(7):475–486. | ||
Tolaney SM, Barry WT, Dang CT, et al. Adjuvant paclitaxel and trastuzumab for node-negative, HER2-positive breast cancer. N Engl J Med. 2015;372(2):134–141. | ||
Kong Y, Dai S, Xie X, et al. High serum HER2 extracellular domain levels: correlation with a worse disease-free survival and overall survival in primary operable breast cancer patients. J Cancer Res Clin Oncol. 2016;142:1765–1773. | ||
Mundy GR, Elefteriou F. Boning up on ephrin signaling. Cell. 2006;126(3):441–443. | ||
Genander M, Frisén J. Ephrins and Eph receptors in stem cells and cancer. Curr Opin Cell Biol. 2010;22(5):611–616. | ||
Kataoka H, Tanaka M, Kanamori M, et al. Expression profile of EFNB1, EFNB2, two ligands of EPHB2 in human gastric cancer. J Cancer Res Clin Oncol. 2002;128(7):343–348. | ||
Jin C, Zhang X, Sun M, Zhang Y, Zhang G, Wang B. Clinical implications of the coexpression of SRC 1 and NAN OG in HER-2-overexpressing breast cancers. Onco Targets Ther. 2016;9:5483–5488. |
Supplementary material
 | Figure S1 The distribution of the EPHB4 and EphrinB2 expression in 94 breast cancer patients. |
 © 2017 The Author(s). This work is published and licensed by Dove Medical Press Limited. The
full terms of this license are available at https://www.dovepress.com/terms
and incorporate the Creative Commons Attribution
- Non Commercial (unported, 3.0) License.
By accessing the work you hereby accept the Terms. Non-commercial uses of the work are permitted
without any further permission from Dove Medical Press Limited, provided the work is properly
attributed. For permission for commercial use of this work, please see paragraphs 4.2 and 5 of our Terms.
© 2017 The Author(s). This work is published and licensed by Dove Medical Press Limited. The
full terms of this license are available at https://www.dovepress.com/terms
and incorporate the Creative Commons Attribution
- Non Commercial (unported, 3.0) License.
By accessing the work you hereby accept the Terms. Non-commercial uses of the work are permitted
without any further permission from Dove Medical Press Limited, provided the work is properly
attributed. For permission for commercial use of this work, please see paragraphs 4.2 and 5 of our Terms.