Back to Journals » Veterinary Medicine: Research and Reports » Volume 6
The associations between serum adiponectin, leptin, C-reactive protein, insulin, and serum long-chain omega-3 fatty acids in Labrador Retrievers
Authors Streeter R, Struble A, Mann S, Nydam D, Bauer J, Castelhano M, Todhunter R, Cummings B, Wakshlag JJ ![]()
Received 19 December 2014
Accepted for publication 29 January 2015
Published 8 April 2015 Volume 2015:6 Pages 103—110
DOI https://doi.org/10.2147/VMRR.S60478
Checked for plagiarism Yes
Review by Single anonymous peer review
Peer reviewer comments 3
Editor who approved publication: Professor Takashi Agui
Renee M Streeter,1 Angela M Struble,1 Sabine Mann,2 Daryl V Nydam,2 John E Bauer,3 Marta G Castelhano,1 Rory J Todhunter,1 Bethany P Cummings,4 Joseph J Wakshlag1
1Department of Clinical Sciences, 2Department of Population Medicine, College of Veterinary Medicine, Cornell University, Ithaca, NY, USA; 3Department of Clinical Sciences, Texas A&M University, College Station, TX, USA; 4Department of Biomedical Sciences, College of Veterinary Medicine, Cornell University, Ithaca, NY, USA
Abstract: Obesity has been associated with an increased inflammatory response and insulin resistance due to adipose tissue–derived adipokines and increases in C-reactive protein (CRP). Dogs appear to be similar to other species with the exception of adiponectin, which might not be affected by obesity status. Serum long-chain polyunsaturated fatty acid concentrations have been positively and negatively associated with serum adipokines. The aim of the study was to examine the relationship between leptin, CRP, adiponectin, and insulin to body condition score (BCS) and to the long-chain omega-3 fatty acids in serum lipoproteins, including alpha-linolenic acid, eicosapentaenoic acid (EPA), docosapentanenoic acid (DPA), and docosahexaenoic acid (DHA) as a reflection of dietary omega-3 status in the Labrador Retriever. Seventy-seven Labrador Retrievers were evaluated for BCS, percent fasting serum lipoprotein fatty acid concentrations, as well as serum leptin, adiponectin, insulin, and CRP. A multivariable general linear regression model was constructed to examine the association between the dependent variables leptin, CRP, adiponectin, and insulin and the predictor variables of BCS, age, and sex, as well as concentrations of alpha-linolenic acid, EPA, DHA, and DPA. Adiponectin concentration was positively associated with age (P<0.0008), EPA (P=0.027) and negatively associated with DHA (P=0.008). Leptin concentration was positively associated with an increased DHA (P=0.009), BCS (P<0.0001), age (P=0.02), and decreased DPA (P=0.06). Insulin concentration was only associated with BCS (P<0.0001), and no meaningful associations were found for CRP. Longer chain omega-3 fatty acids may play a role in regulating adiponectin concentrations in dogs. However, because insulin concentrations were associated only with BCSs, further examination of the role of adiponectin in canine obesity is warranted. EPA and DPA may reduce the overall inflammatory state in dogs as these omega-3 fatty acids reflect increased adiponectin (increased EPA and decreased DHA) and decreased leptin (decreased DHA and increased DPA).
Keywords: dog, obesity, adiponectin, omega-3 fatty acid, insulin, leptin
Introduction
Obesity is the primary manifestation of malnutrition of animals in developed countries. It has been suggested that up to 40% of dogs and cats are overweight to obese, with no indications that there are effective ways to manage this increasing problem.1,2 There are numerous methods available to quantify obesity; however, the 1–9 body condition scoring system is the most widely used and validated body condition system in dogs.3 Studies utilizing body condition score (BCS) as a measure of obesity status have been able to associate insulin resistance and serum adipokine status, yet there is significant debate as to the metabolic repercussions of obesity in dogs because a true “metabolic syndrome” has not been identified, and opposing results surrounding adiponectin and C-reactive protein (CRP) concentrations and obesity status stem further controversy.4–9
The mild possible metabolic derangements observed in obese dogs are due to adipose tissue being a metabolically active tissue that produces adipokines such as adiponectin, leptin, TNF-α, MCP-1, and IL-6, which play a role in energy homeostasis, metabolism, and inflammatory processes.5,6,10 One of the most well studied adipokines is leptin, which regulates appetite and energy expenditure.11 Leptin also plays an important role in immune function. Leptin deficiency is associated with modest impaired immune function, which is restored after leptin administration.12 Nearly all canine obesity studies show that with increased adiposity, serum leptin concentrations are increased. This increased leptin is due to adipocyte hypertrophy and potentially deranged hypothalamic feedback that induces leptin resistance and may contribute to the progression of hyperphagia and weight gain.13–16 Indeed, leptin deficiency in rodents and humans, due to various underlying pathologies (genetic, lipodystrophy, and type 1 diabetes), corresponds with marked hyperphagia.17–20
Adiponectin is also released from adipose tissue with lean people often having higher concentrations than obese individuals and is currently thought to be one of the contributing factors to insulin sensitivity.10,21 Indeed, the insulin-sensitizing thiazolidinedione class of drugs is thought to improve insulin sensitivity by acting through peroxisome proliferation activation receptor (PPAR) to increase adiponectin production and secretion.22 The current canine obesity literature is equivocal, with adiponectin status being unchanged in obese versus lean dogs, while others have shown negative associations between adiponectin serum concentrations and obesity.4,7–9
Obesity has been associated with increased inflammatory signaling, which is thought to be a key contributor to many obesity-associated comorbidities such as insulin resistance, cardiovascular disease, and osteoarthritis. In particular, studies in humans and rodents have revealed that the expanding adipose tissue is associated with key inflammatory changes, such as increases in adipose tissue macrophages leading to cytokines that induce chronic inflammation.23,24 This rise in CRP is an indication of chronic inflammation, which has been associated with developing diabetes and atherosclerotic heart disease in humans.25,26 In dogs, CRP and obesity, much like adiponectin, does not have a clear trend in obesity with some studies showing increased CRP in obese populations, or decreases after weight loss, while others show no changes with obesity status.4,7,9,27 These discrepancies in the canine literature suggest that there may be other confounding factors that affect these adipokines. Small sample populations and breed of dog may have led to insufficient statistical power and study bias or confounders.15
Recent publications in humans, cats, and dogs have observed correlations between serum lipoprotein omega-3 long-chain fatty acid consumption and relative adipokine concentrations.10,28–30 The major anti-inflammatory fatty acids are eicosapentaenoic acid (EPA), docosapentaenoic acid (DPA), and docosahexaenoic acid (DHA).31 These omega-3, long-chain fatty acids have anti-inflammatory affects in a multitude of tissues and decrease the production of inflammatory prostaglandins and leukotrienes, which in turn decrease inflammatory and adipocyte cell release of cytokines such as TNF-α and IL-6.31 In addition, the long-chain omega-3 fatty acids are thought to directly influence gene expression through binding to the PPARs (PPARα, PPARγ). PPARγ has been shown to play a key role in adipogenesis, leading to more insulin-sensitive, small adipocyte production and also plays a role in energy storage and utilization.32 Recent direct correlations suggest that this may be true because obese cats with higher serum lipoprotein DHA also have higher adiponectin concentrations and decreased insulin and triglycerides.30 A more recent study in dogs by the same group of investigators has shown that EPA or DPA are associated with increased adiponectin status.10
Due to the conflicting reports on adiponectin and CRP status in canine obesity, we studied the associations between serum lipoprotein omega-3 fatty acid status (alpha-linolenic acid [ALA], EPA, DPA, and DHA), body condition, sex, and selected adipokines in a single breed – the Labrador Retriever.
Materials and methods
Seventy-seven client-owned, healthy Labrador Retrievers between the ages of 2 and 15 were evaluated. Informed client consent was obtained before the animals were enrolled in the study, and the protocol was approved by Cornell University’s Institutional Animal Care and Use Committee. A physical examination was performed on all animals. Labradors were enrolled if there was no evidence of acute inflammation or other disease process as indicated by the history and physical examination, serum chemistry, complete blood count and urinalysis was within reference ranges. During the examination, body condition scoring was performed by a single individual (AMS). Blood samples were taken in plain glass tubes and allowed to clot for 20 minutes. Samples were then centrifuged at 3,800× g for 10 minutes, and serum was aliquoted into three separate cryovials and immediately frozen at −80°C.
Serum phospholipid fatty acid profiles were performed at Texas A&M University using capillary gas–liquid chromatography, as previously described.33 Briefly, total lipids were extracted from sera and fractionated via thin-layer chromatography on glass plates, scraped from the plates, and transmethylated to yield fatty acid methyl esters for analysis via gas–liquid chromatography. Insulin concentrations were measured using competitive radioimmunoassays at the certified New York State Diagnostic Laboratory at Cornell University (Porcine Insulin RIA; Millipore, Concord, MA). Canine adiponectin measurements were performed using a canine-based enzyme-linked immunosorbent assay (ELISA) assay (Milliplex Canine Adiponectin Kit; Millipore), which was used according to manufacturer’s directions. Interassay coefficient of variation for the adiponectin kit was 9.3%, and intraassay coefficient of variation was 7.9%. Canine leptin was measured using a canine-based ELISA (Canine Leptin ELISA Kit; Millipore), which was performed according to the manufacturer’s specifications. Leptin assay interassay coefficient of variation was 6.7%, and the intraassay coefficient of variation was 5.5%. CRP ELISA (Phase™ Range; Tridelta Development Limited, Maynooth, Ireland) was performed according to the manufacturer’s directions and had an intraassay coefficient of variation of 6.9% and an interassay coefficient of variation of 7.8%.
Statistics
In order to examine the effects of the multiple independent variables (age, sex, BCS, ALA, EPA, DPA, and DHA) with each dependent variable (adiponectin, leptin, insulin, and CRP), a multivariable general linear model was used for data analysis (Proc GLM, SAS ver 9.3; SAS, Cary, NC, USA). Manual backward step-wise elimination of the predictor variables was performed. Variables were removed from the model sequentially based on the magnitude of their type 1 error risk, with the largest being removed first, until the remaining individual variables had a P-value <0.1. The two-way interactions between the remaining variables in each model were also tested. Categorical data were BCS and sex. BCS 1–9 were collapsed into three groups; lean (BCS 4–5), overweight (BCS 6–7), and obese (BCS 8–9). Sex was evaluated in four groups; males, male-neutered, females, and female-spayed. All continuous variables were assessed for normality with probability plots, and model fit was assessed by residual diagnostic plots. The dependent variables adiponectin, insulin, CRP, and leptin were log transformed to satisfy the assumption of normality and homoscedasticity of residuals. As BCS was a relevant predictor for many of the serum markers assessed, the markers were further assessed by BCS using an analysis of variance with Tukey’s post hoc comparisons.
Results
Serum omega-3 fatty acids
Table 1 represents the relative percentage of serum-extracted fatty acid composition. Linoleic acid and arachidonic acid are most abundant. Serum DPA and DHA are similar with average and medians around 1.5%, while the median of EPA concentrations is less than 1.0%. The lowest represented omega-3 fatty acid is ALA with a median of less than 0.2%.
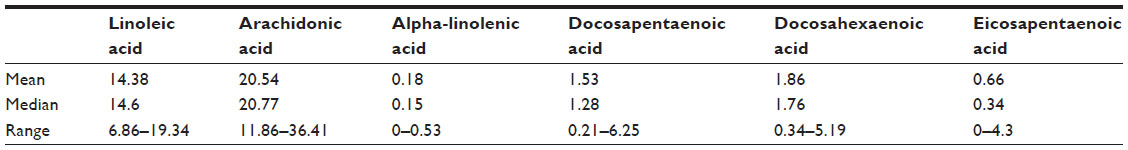 | Table 1 Median and range as a percentage for all major omega-3 fatty acids, linoleic acid, and arachidonic acid evaluated in serum phospholipids as measured by capillary gas–liquid chromatography |
Adiponectin
Adiponectin as a dependent variable was correlated with three independent variables including age, EPA, and DHA (Table 2). Surprisingly, there were no associations found with obesity status (Figure 1). The interactions between the remaining variables were then tested (EPA, DHA, and age), and the results of this analysis showed no interaction between these variables (all interaction terms had P-values of ≥0.30). Age and EPA were positively associated with serum adiponectin concentrations (P=0.008 and P=0.0265, respectively), while DHA was found to be negatively associated with adiponectin concentration (P=0.009).
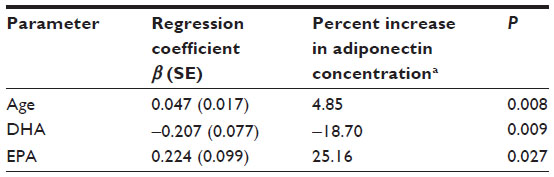 | Table 2 Multivariable linear regression showing the effect of EPA, DHA, and age on adiponectin; R2=0.19; P=0.001 |
 | Figure 1 Box and whisker plot of mean log-transformed serum adiponectin concentration and its association with BCS. |
Leptin
Serum leptin as a dependent variable was found to be associated with BCS, DPA, and DHA (Table 3). The strongest association between BCS and leptin was seen when comparing the lean and overweight groups (P<0.001) and the lean and obese groups (P<0.001), while there was no significant difference in leptin concentrations between the overweight and obese groups (P=0.69; Figure 2). Leptin was positively associated with DHA and increasing BCS and age, while DPA was negatively associated with leptin concentrations. When these variables (DHA, DPA and BCS, and age) were examined for interactions, no significant interactions were found (P>0.36).
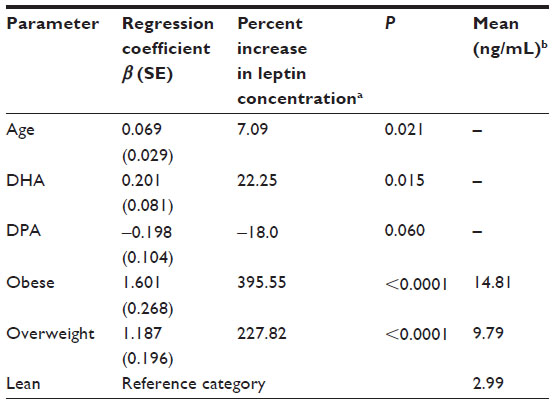 | Table 3 Multivariable linear regression showing the effect of DHA, DPA, and BCS on leptin; R2=0.39; P<0.0001 |
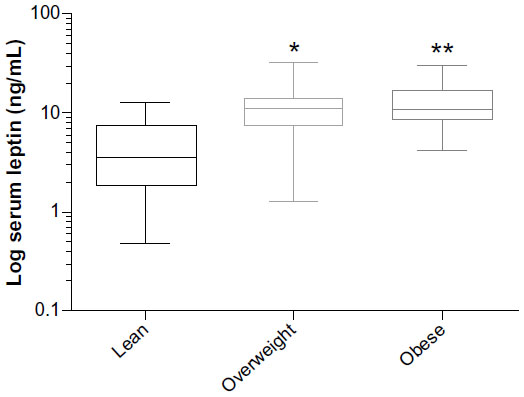 | Figure 2 Box and whisker plot of mean log-transformed serum leptin concentration and its association with BCS. |
Insulin
Insulin as a dependent variable was found to be associated with the independent variable of body condition in the lean, overweight, and obese categories. Figure 3 shows insulin concentrations and their association with BCSs, showing a positive association with increasing body condition (P<0.001). Twenty-seven percent of the variability in insulin concentrations can be explained by BCS between the lean and obese groups (P<0.0001), and the obese and overweight group (P=0.003), but not between the lean and overweight group (P=0.10).
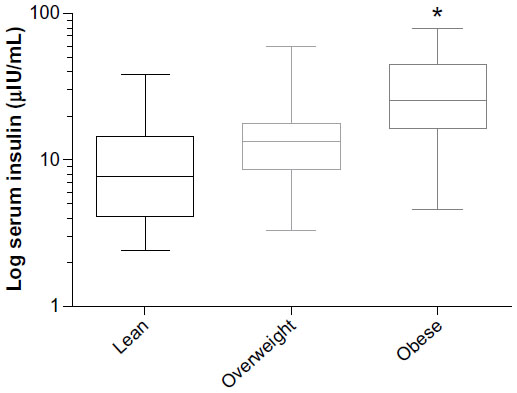 | Figure 3 Box and whisker plot of mean log-transformed serum insulin and its association with BCS. |
CRP
CRP as a dependent variable was found to have a negative association with ALA in female dogs only (P=0.09). No other associations were noted.
Discussion
Obesity is the leading health problem in canine medicine reaching epidemic proportions with the current rate of obesity of nearly 40%.1,2,34 The implications on other diseases such as diabetes and cancer are currently unknown, but it is suspected that contributions may be significant for dogs.34,35 For example, orthopedic diseases show a strong correlation with obesity status in dogs, and weight loss can significantly improve orthopedic function.36 It has been suggested that obesity-associated inflammation contributes to the development and progression of osteoarthritis, and weight loss may not only improve osteoarthritis from a mechanical perspective but also from an inflammatory perspective.37
Adipose-derived hormones, such as adiponectin and leptin play an important role in the development of insulin resistance in human and rodent studies;38 however, the roles of adiponectin and leptin on insulin signaling are only recently coming to light in canine medicine. Changes in circulating leptin concentrations in canine obesity mirrors what is seen in human obesity. However, adiponectin’s role is less clear. Our study showed little to no correlation between BCS and adiponectin concentration. This agrees with findings in other studies examining BCS and adiponectin8,10 and correlates with the results of other studies examining weight loss in dogs.4,9 However, our findings are in contrast with the findings of other studies, suggesting that adiponectin serum concentrations are reciprocal to increases in body condition or increase with weight loss in dogs.9,35 It is unclear why there are many discrepancies in the literature regarding adiponectin status in dogs, but it is increasingly clear that other variables such as age and dietary omega-3 fatty acids may be more influential.10,39 Although speculative, the body condition scoring system of 1–9 has been examined as it correlates to body fat, and once an animal is at a BCS of 8 or 9, there is considerable variability in the overall body fat percentage;40 therefore, if one researcher were to have excessively fat dogs, then adiponectin results may be different.
In our study, increasing adiponectin concentration was most strongly correlated with age. Interestingly, in humans, age has been positively correlated with adiponectin concentrations.40 Additionally, our study did not reveal a significant association between sex and adiponectin concentrations, while in humans, women have higher adiponectin concentrations.4,41
Adiponectin concentration was positively correlated with EPA and negatively correlated with DHA. These findings do not correspond to the findings of a recent study in dogs with differing BCS, which found no association between DHA and EPA and adiponectin. However, they did find a positive correlation between DPA, an intermediate in-between the elongation of EPA to DHA, and adiponectin.10 In a study of obese and nonobese cats, there was a significant positive association between adiponectin concentration and DHA and EPA lipoprotein concentrations from serum in the obese group of cats, but an inverse association between EPA and adiponectin in the nonobese cats.30 Because our study did not support the findings of a previous study regarding the relationship between DPA and adiponectin, there could be a breed-related difference in overall fatty acid metabolism because our study focused only on the Labrador Retriever. Furthermore, the negative interplay between EPA and DHA may be more complex than previously thought in dogs. EPA and DHA are both potential ligands for PPARγ signaling to induce adiponectin production and secretion; yet, their ability to regulate adiponectin secretion in the dogs appears to be conflicting.39 Although the long-chain omega-3 fatty acids appear to be involved in adiponectin regulation, there is no specific intermediate that can be pointed to for increased adiponectin serum concentrations. In addition, other dietary components may also play a role on PPAR signaling and adiponectin secretion including dietary supplements, which was beyond the scope of this trial. If our findings are accurate, there is potential for selected EPA-rich omega-3 fatty acid supplementation in dogs that may be beneficial in the management of obesity-related metabolic dysfunction.39
The influence of obesity on serum leptin and other adipokines has been well established in the human and rodent literature.42–44 In nearly all weight loss or obesity studies in dogs, serum leptin has been correlated with adiposity, which our data also clearly suggests.4,7,9,13–15 Surprisingly, the long-chain omega-3 fatty acid DPA was negatively correlated with serum leptin concentrations, which concurs with the recent findings of Mazaki-Tovi and colleagues,10 while in contrast, our data found a positive correlation with serum DHA concentrations. This is similar to our finding with adiponectin concentrations where DHA has a seemingly negative correlation with rising adiponectin and a positive correlation with serum leptin. These associations suggest that DHA may inhibit the positive effects of EPA and DPA. Thus far, literature shows a decrease in human obesity with fish oil supplementation and a decrease in leptin concentration in mice.45,46 Adipocyte culture has shown lower leptin secretion associated with EPA supplementation. The reasons for our lack of EPA and leptin association may be the overall higher DPA and DHA concentration in the serum of Labradors, suggesting that this breed may have the ability to elongate EPA to DPA and DHA. The concentrations of these two fatty acids are 2- to 4-fold higher than EPA; therefore, if they have the ability to either inhibit or stimulate PPAR receptors, then they are likely to dilute out the effect of EPA. Again, much like adiponectin, the leptin being negatively associated with higher DHA concentrations suggests that higher DHA is not favorable for beneficial adipokine secretion (higher adiponectin, lower leptin), while EPA and DPA seem to be more favorable in a positive adipokine response with higher serum adiponectin and lower serum leptin concentrations.
Insulin concentrations appear to have no association with serum long-chain omega-3 fatty acid status, which is consistent with other publications showing lack of association.10 The most important predictor in this study was BCS. Interestingly, the association between body condition is much stronger in the obese dogs with BCS of 8 or 9 compared to lean or overweight dogs. This suggests that overweight dogs do not show increased resting serum insulin rises until obesity is severe. The idea of insulin resistance of metabolic syndrome has been hard to define in canine populations due to the lack of diseases such as diabetes or coronary artery disease associated with increased resting insulin and obesity, like in humans.4 A recent publication coined the term obesity-related metabolic dysfunction, where obese dogs showed definitive lowering of leptin, and resting insulin with increased adiponectin after successful weight loss defining improved metabolic parameters associated with weight loss programs.35 Other studies have shown elevated resting insulin concentrations across BCSs, which have similarly shown that the significant elevations are in dogs with more severe obesity.47
More controversial than insulin is the effect of canine obesity on CRP. A significant body of literature suggests that CRP is associated with obesity in humans, yet the data surrounding dogs are less clear. Previous publications have shown that CRP is increased in obese dogs compared to lean dogs,4,9 while other publications have not been able to show the association.47 Even in paired weight gain/loss studies there has been conflicting data, where some suggest that rapid weight gain did not increase CRP in dogs, while a typical weight loss program showed a modest decrease or no change in dogs.7,27 Our study using only Labradors with a median age of 8.5 years suggests that CRP is not influenced by obesity or long-chain omega-3 fatty acid status. This may be a unique finding to Labrador Retrievers and suggests that this population and possibly this breed of dog does not show increases in CRP with obesity. However, the lack of CRP rise could be due to the older population of Labradors being a mean age of 8.5 years, whereby mild inflammation associated with aging and chronic conditions may mask the obesity effects. The mean CRP concentration was just over 2 μg/mL, making it within normal ranges comparable to other studies of dog populations, making this age effect less likely.4,27,48 Additionally, serum leptin did show an age association that CRP did not, which contradicts with what has been observed in various other breed population studies;15 however, our study was within one breed (the Labrador Retriever), which may be why certain age-related changes can be observed.
Overall our study confirms that the serum concentration of long-chain omega-3 fatty acids is associated with serum concentrations of adiponectin and leptin, with DPA and EPA having positive biological associations and DHA having negative associations with the inflammation and adipokine status of obesity. This negative association with DHA is in conflict with results in other species and with some results observed in dogs. These findings beg for clinical studies examining adipokine status before and after EPA or DHA supplementation to see if dogs due to a more robust desaturation and elongation activity of long-chain fatty acids allow DPA and DHA to be factors involved in adipokine status more so than EPA as observed in other species.
Acknowledgment
The work performed in this project was supported with a funding provided by a Nestle Purina Resident Research Award, the Cornell biobank, NIHR24 GM0829-A1 and R24 GM082910-S1.
Disclosure
The authors report no conflicts of interest in this work.
References
Laflamme DP. Understanding and managing obesity in dogs and cats. Vet Clin North Am Small Anim Pract. 2006;36(6):1283–1295. | |
O Neill DG, Church DB, McGreevy PD, Thomson PC, Brodbelt DC. Prevalence of disorders recorded in dogs attending primary-care veterinary practices in England. PLoS One. 2014;9:e90501. | |
Mawby DI, Bartges JW, d’Avignon A, Laflamme DP, Moyers TD, Cottrell T. Comparison of various methods for estimating body fat in dogs. J Am Anim Hosp Assoc. 2004;40(2):109–114. | |
German AJ, Hervera M, Hunter L, et al. Improvement in insulin resistance and reduction in plasma inflammatory adipokines after weight loss in obese dogs. Domest Anim Endocrinol. 2009;37(4):214–226. | |
Wozniak SE, Gee LL, Wachtel MS, Frezza EE. Adipose tissue: the new endocrine organ? A review article. Dig Dis Sci. 2009;54(9):1847–1856. | |
Radin MJ, Sharkey LC, Holycross BJ. Adipokines: a review of biological and analytical principles and an update in dogs, cats, and horses. Vet Clin Pathol. 2009;38(2):136–156. | |
Wakshlag JJ, Struble AM, Levine CB, Bushey JJ, Laflamme DP, Long GM. The effects of weight loss on adipokines and markers of inflammation in dogs. Br J Nutr. 2011;106(S1):S11–S14. | |
Verkest KR, Rand JS, Fleeman LM, et al. Distinct adiponectin profiles might contribute to differences in susceptibility to type 2 diabetes in dogs and humans. Domest Anim Endocrinol. 2011;41(2):67–73. | |
Eirmann LA, Freeman LM, Laflamme DP, Michel KE, Satyaraj E. Comparison of adipokine concentrations and markers of inflammation in obese versus lean dogs. Int J Appl Res Vet Med. 2009;7(1):196–205. | |
Mazaki-Tovi M, Abood SK, Schenck PA. Effect of omega-3 polyunsaturated fatty acids and body condition on serum concentration of adipokines in healthy dogs. Am J Vet Res. 2012;78(8):1273–1281. | |
Schwartz MW, Woods SC, Porte D Jr, Seeley RJ, Baskin DG. Central nervous system control of food intake. Nature. 2000;404(6778):661–671. | |
Sennello JA, Fayad R, Pini M, Gove ME, Fantuzzi G. Transplantation of wild-type white adipose tissue normalizes metabolic, immune and inflammatory alterations in leptin-deficient ob/ob mice. Cytokine. 2006;36(5–6):261–266. | |
Ishioka K, Soliman MM, Sagawa M, et al. Experimental and clinical studies on plasma leptin in obese dogs. J Vet Med Sci. 2002;64(4):349–353. | |
Sagawa MM, Nakadomo F, Honjoh T, Ishioka K, Saito M. Correlation between plasma leptin concentration and body fat content in dogs. Am J Vet Res. 2002;63(1):7–10. | |
Ishioka K, Hosoya K, Kitagawa H, Shibata H, Kimura K, Saito M. Plasma leptin concentration in dogs: effects of body condition score, age, gender and breeds. Res Vet Sci. 2007;82(1):11–15. | |
Verkest KR, Fleeman LM, Morton JM, Ishioka K, Rand J. Compensation for obesity-induced insulin resistance in dogs: assessment of the effects of leptin, adiponectin, and glucagon-like peptide-1 using path analysis. Domest Anim Endocrinol. 2011;41(1):24–34. | |
Halaas JL, Gajiwala KS, Maffei M, et al. Weight-reducing effects of the plasma protein encoded by the obese gene. Science. 1995;269(5223):543–546. | |
Farooqi IS, Jebb SA, Langmack G, et al. Effects of recombinant leptin therapy in a child with congenital leptin deficiency. N Engl J Med. 1999;341(12):879–884. | |
Petersen KF, Oral EA, Dufour S, et al. Leptin reverses insulin resistance and hepatic steatosis in patients with severe lipodystrophy. J Clin Invest. 2002;109(10):1345–1350. | |
Sindelar DK, Havel PJ, Seeley RJ, Wilkinson CW, Woods SC, Schwartz MW. Low plasma leptin levels contribute to diabetic hyperphagia in rats. Diabetes. 1999;48(6):1275–1280. | |
Li S, Shin HJ, Ding EL, van Dam RM. Adiponectin levels and risk of type 2 diabetes: a systematic review and meta-analysis. J Am Med Assoc. 2009;302(2):179–188. | |
Sharma AM, Staels B. Review: peroxisome proliferator-activated receptor gamma and adipose tissue – understanding obesity-related changes in regulation of lipid and glucose metabolism. J Clin Endocrinol Metab. 2007;92(2):386–395. | |
Johnson AM, Olefsky JM. The origins and drivers of insulin resistance. Cell. 2013;152(4):673–684. | |
Osborn O, Olefsky JM. The cellular and signaling networks linking the immune system and metabolism in disease. Nat Med. 2012;18(3):363–374. | |
Calle MC, Fernandez ML. Inflammation and type 2 diabetes. Diabetes Metab. 2012;38(3):183–191. | |
Akhabue E, Thiboutot J, Cheng JW, et al. New and emerging risk factors for coronary heart disease. Am J Med Sci. 2014;347(2):151–158. | |
Tvarijonaviciute A, Martinez S, Gutierrez A, Ceron JJ, Tecles F. Serum acute phase proteins concentrations in dogs during experimentally short-term induced overweight. A preliminary study. Res Vet Sci. 2011;90(1):31–34. | |
Silva FM, de Almeida JC, Feoli AM. Effect of diet on adiponectin levels in blood. Nutr Rev. 2011;69(4):599–612. | |
An WS, Son YK, Kim SE, et al. Association of adiponectin and leptin with serum lipids and erythrocyte omega-3 and omega-6 fatty acids in dialysis patients. Clin Nephrol. 2011;75(3):195–203. | |
Mazaki-Tovi M, Abood SK, Schenck PA. Effect of omega-3 fatty acids on serum concentrations of adipokines in healthy cats. Am J Vet Res. 2011;72(9):1259–1265. | |
LeBlanc CJ, Horohov DW, Bauer JE, Hosgood G, Mauldin GE. Effects of dietary supplementation with fish oil on in vivo production of inflammatory mediators in clinically normal dogs. Am J Vet Res. 2008;69(4):486–493. | |
Auwerx J. PPAR gamma, the ultimate thrifty gene. Diabetologia. 1999; 42(9):1033–1049. | |
Dunbar BL, Bigley KE, Bauer JE. Early and sustained enrichment of serum n-3 fatty acids in dogs fed a flaxseed supplemented diet. Lipids. 2010;45(1):1–10. | |
Lund EM, Armstrong PJ, Kirk CA, Kolar LM, Klauser JS. Health status and population characteristics of dogs and cats examined at private veterinary practices in the United States. J Am Vet Med Assoc. 1999;214(9):1336–1341. | |
Tvarijonaviciute A, Ceron JJ, Holden SL, et al. Obesity-related metabolic dysfunction in dogs: a comparison with human metabolic syndrome. BMC Vet Res. 2012;8:147–153. | |
Marshall WG, Hazewinkel HA, Mullen D, De Meyer G, Baert K, Carmichael S. The effect of weight loss on lameness in obese dogs with osteoarthritis. Vet Res Commun. 2010;34(3):241–253. | |
Cicuttini FM, Wluka AE. Osteoarthritis: is OA a mechanical or systemic disease? Nat Rev Rheumatol. 2014;10(9):515–516. | |
Cummings BP. Leptin therapy in type 2 diabetes. Diabetes Obes Metab. 2013;15(7):607–612. | |
Mazaki-Tovi M, Abood SK, Schenck PA. Fish oil supplementation increases concentration of adiponectin in healthy dogs. J Small Anim Pract. 2014;55(5):247–253. | |
Witzel AL, Kirk CA, Henry GA, Toll PW, Brejda JJ, Paetau-Robinson I. Use of a novel morphometric method and body fat index system for estimation of body composition in overweight and obese dogs. J Am Vet Med Assoc. 2014;244(11):1279–1284. | |
Cnop M, Havel PJ, Utzschneider KM, Carr DB, Sinah MK, Boyko EJ. Relationship of adiponectin to body fat distribution, insulin sensitivity and plasma lipoproteins: evidence for independent roles of age and sex. Diabetologia. 2003;46(4):459–469. | |
Ricci R, Bevilacqua F. The potential role of leptin and adiponectin in obesity: a comparative review. Vet J. 2012;191(3):292–298. | |
Kern PA, Di Gregorio GB, Lu T, Rassouli N, Ranganathan G. Adiponectin expression from human adipose tissue: relation to obesity, insulin resistance, and tumor necrosis factor-alpha expression. Diabetes. 2003;52(7):1779–1785. | |
Maffei M, Fei H, Lee GH, et al. Increased expression in adipocytes of ob RNA in mice with lesions of the hypothalamus and with mutations at the db locus. Proc Natl Acad Sci U S A. 1995;92(15):6957–6960. | |
Ide T. Interaction of fish oil and conjugated linoleic acid in affecting hepatic activity of lipogenic enzymes and gene expression in liver and adipose tissue. Diabetes. 2005;54(3):412–423. | |
Couet C, Delarue J, Ritz P, Antoine JM, Famisse F. Effect of dietary fish oil on body fat mass and basal fat oxidation in healthy adults. Int J Obes Relat Metab Disord. 1997;21(8):637–643. | |
Verkest KR, Rand JS, Fleeman LM, Morton JM. Spontaneously obese dogs exhibit greater postprandial glucose, triglyceride, and insulin concentrations than lean dogs. Domest Anim Endocrinol. 2012;42(2):103–112. | |
Veiga AP, Price CA, de Oliveira ST, et al. Association of canine obesity with reduced serum levels of C-reactive protein. J Vet Diagn Invest. 2008;20(2):224–228. |
 © 2015 The Author(s). This work is published and licensed by Dove Medical Press Limited. The
full terms of this license are available at https://www.dovepress.com/terms
and incorporate the Creative Commons Attribution
- Non Commercial (unported, 3.0) License.
By accessing the work you hereby accept the Terms. Non-commercial uses of the work are permitted
without any further permission from Dove Medical Press Limited, provided the work is properly
attributed. For permission for commercial use of this work, please see paragraphs 4.2 and 5 of our Terms.
© 2015 The Author(s). This work is published and licensed by Dove Medical Press Limited. The
full terms of this license are available at https://www.dovepress.com/terms
and incorporate the Creative Commons Attribution
- Non Commercial (unported, 3.0) License.
By accessing the work you hereby accept the Terms. Non-commercial uses of the work are permitted
without any further permission from Dove Medical Press Limited, provided the work is properly
attributed. For permission for commercial use of this work, please see paragraphs 4.2 and 5 of our Terms.