Back to Journals » International Journal of Chronic Obstructive Pulmonary Disease » Volume 12
The association of tidal EFL with exercise performance, exacerbations, and death in COPD
Authors Aarli BB ![]() , Calverley PM
, Calverley PM ![]() , Jensen RL, Dellacà R
, Jensen RL, Dellacà R ![]() , Eagan TM, Bakke PS, Hardie JA
, Eagan TM, Bakke PS, Hardie JA
Received 4 April 2017
Accepted for publication 30 May 2017
Published 26 July 2017 Volume 2017:12 Pages 2179—2188
DOI https://doi.org/10.2147/COPD.S138720
Checked for plagiarism Yes
Review by Single anonymous peer review
Peer reviewer comments 2
Editor who approved publication: Prof. Dr. Richard Russell
Bernt Boegvald Aarli,1,2 Peter MA Calverley,3 Robert L Jensen,4 Raffaele Dellacà,5 Tomas ML Eagan,1,2 Per S Bakke,1 Jon A Hardie1
1Department of Clinical Science, University of Bergen, 2Department of Thoracic Medicine, Haukeland University Hospital, Bergen, Norway; 3Clinical Science Centre, University Hospital Aintree, Liverpool, UK; 4LDS Hospital, Pulmonary Division, Salt Lake City, UT, USA; 5TBM-Lab, Dipartimento di Elettronica, Informazione e Bioingegneria, Politecnico di Milano University, Milano, Italy
Background: Tidal expiratory flow limitation (EFLT) is frequently found in patients with COPD and can be detected by forced oscillations when within-breath reactance of a single-breath is ≥0.28 kPa·s·L-1. The present study explored the association of within-breath reactance measured over multiple breaths and EFLT with 6-minute walk distance (6MWD), exacerbations, and mortality.
Methods: In 425 patients, spirometry and forced oscillation technique measurements were obtained on eight occasions over 3 years. 6MWD was assessed at baseline and at the 3-year visit. Respiratory symptoms, exacerbations, and hospitalizations were recorded. A total of 5-year mortality statistics were retrieved retrospectively. We grouped patients according to the mean within-breath reactance (ΔXrs), measured over several breaths at baseline, calculated as mean inspiratory–mean expiratory reactance over the sampling period. In addition to the established threshold of EFLT, an upper limit of normal (ULN) was defined using the 97.5th percentile of ΔXrs of the healthy controls in the study; 6MWDs were compared according to ΔXrs, as normal, ≥ ULN < EFLT, or ≥ EFLT. Annual exacerbation rates were analyzed using a negative binomial model in the three groups, supplemented by time to first exacerbation analysis, and dichotomizing patients at the ULN.
Results: In patients with COPD and baseline ΔXrs below the ULN (0.09 kPa·s·L-1), 6MWD was stable. 6MWD declined significantly in patients with ΔXrs ≥ ULN. Worse lung function and more exacerbations were found in patients with COPD with ΔXrs ≥ ULN, and patients with ΔXrs ≥ ULN had shorter time to first exacerbation and hospitalization. A significantly higher mortality was found in patients with ΔXrs ≥ ULN and FEV1 >50%.
Conclusion: Patients with baseline ΔXrs ≥ ULN had a deterioration in exercise performance, more exacerbations, and greater hospitalizations, and, among those with moderate airway obstruction, a higher mortality. ΔXrs is a novel independent marker of outcome in COPD.
Keywords: forced oscillation technique, reactance, COPD, exacerbations, 6-minute walk test, mortality
Introduction
COPD is a major cause of morbidity and mortality, leading to an estimated 3.1 million deaths globally in 2012.1 Although symptoms and exacerbation rate have been added to our assessment system of COPD,2 spirometry remains an important tool in assessing severity and prognosis in this disease. Changes in the forced expiratory volume in 1 second (FEV1) are still the best indicator of disease progression and the risk of dying from COPD.2,3 Yet, on an individual level, FEV1 is an unreliable marker of morbidity, especially in early disease,4–6 and there is a need to identify alternative objective tests that can aid in stratifying the risk of further patient deterioration.
Patients who exhibit tidal expiratory flow limitation (EFLT) might be such a subgroup. EFLT occurs when increases in driving pressure fail to increase expiratory flow during resting tidal breathing and is most often seen in patients with severe COPD,7,8 although it can occur with only moderate airway obstruction. Previous studies of EFLT in COPD have focused on its association with operating lung volume, exercise tolerance,9,10 and its relation to breathlessness.11–13 It is not known whether EFLT can provide longer-term prognostic information in COPD.
EFLT can be detected by the forced oscillation technique (FOT).14,15 When peripheral airways collapse on expiration, oscillatory pressure signals are prevented from reaching the alveoli. As this happens, the oscillatory compliance is reduced. Consequently, expiratory reactance (Xrsexp) becomes more negative than the inspiratory reactance (Xrsinsp), leading to a within-breath reactance difference (ΔXrs). In the absence of EFLT, reactance measured in inspiration and in expiration is almost identical. The within-breath reactance difference (ΔXrs) cut-off of 0.28 kPa·s·L−1 has been defined and validated to identify flow-limited breaths.14,15 EFLT is not only linked to dyspnea in COPD,11,16 but also to COPD exacerbations, where ΔXrs have been found to increase at the onset of COPD exacerbations and decrease when the exacerbation resolves.17
In this study, we used forced oscillation technique to define EFLT in 425 patients with COPD. We hypothesized that the presence of EFLT, assessed by increased mean ΔXrs (Δ ), would relate to changes in 6MWD, the risk of COPD exacerbations, and, possibly, mortality. We explored these hypotheses using baseline Δ as a predictor for future events. Patients with COPD with abnormally high Δ, both above the upper limit of normal (ULN) and above the established threshold of EFLT, were investigated to determine whether they differed from those without evidence of tidal expiratory flow limitation.
Methods
Study design and patients
The current data derive from the Bergen cohort of the Evaluation of COPD Longitudinally to Identify Predictive Surrogate Endpoints (ECLIPSE) study,18 with additional patients enrolled from our clinical catchment area. Written informed consent was obtained from all study subjects. The study was approved by the regional ethics committee, REK vest (REK 165.08), and performed in accordance with the Declaration of Helsinki and the Good Clinical Practice guidelines (ClinicalTrials.gov; No: NTC00292552; www.ClinicalTrials.gov).39
Inclusion criteria for patients with COPD were: age 40–75 years, FEV1 <80% predicted, FEV1/FVC <0.7, and a smoking history of ≥10 pack-years. Study patients were evaluated every 6 months for 3 years with an additional visit at 3 months after baseline, totaling eight visits. The American Thoracic Society-Division of Lung Disease (ATS-DLD-78) questionnaire and the modified Medical Research Council dyspnea scale score (mMRC) were used to record respiratory symptoms.19,20
Post-bronchodilator spirometry and oscillatory lung mechanics during tidal breathing were performed after inhalation of 0.4 mg salbutamol (GlaxoSmithKline, Ventolin, London, UK) according to American Thoracic Society/European Respiratory Society (ATS/ERS) international standards at each visit using a Jaeger MasterScope CT Impulse Oscillation System (Jaeger, Hoechberg, Germany).21,22 Local reference values were used to determine the FEV1% predicted.23 The FOT measurements were performed with the patient seated, cheeks supported, and wearing a nose clip. We performed three continuous measurements of 30 seconds, totaling 90 seconds of tidal volume breathing. Acceptability of measurements was determined using the ERS 2003 task force recommendations.22
Δ reactance was averaged over the 90-second sample, containing several breaths, and was calculated as follows: Δ = mean Xrsinsp at 5 Hz – mean Xrsexp at 5 Hz. Two cut-offs were investigated: the ULN defined as the 97.5th percentile of healthy controls in the Bergen cohort of the ECLIPSE study (Δ ≥0.09 kPa·s·L−1; Figure S1),13 and at the established EFLT defining threshold for within-breath reactance, 0.28 kPa·s·L−1, derived from single-breath analysis.14,15 To illustrate the variability of our multiple-breath measurement, Δ was plotted against time in a subset of the patients defined EFLT at baseline with complete visits (N=20).
Study outcomes
Distance walked during the 6-minute walk test (6MWT) was used to assess exercise performance. The 6MWT was supervised by a trained technician and performed in a 30-m, straight hospital corridor according to agreed standards at baseline and at the end of the study, at the 3-year visit.24
Exacerbations were defined as a worsening of respiratory symptoms over 2 days or more that required systemic corticosteroids or antibiotics, alone or in combination (“moderate exacerbations”), or exacerbations resulting in hospitalization (“severe exacerbations”). Assessment of exacerbations was performed retrospectively by the study physician at the half-yearly visits, over the 3-year study period.
Mortality statistics were retrieved on August 25, 2011, approximately 5 years after the conclusion of the baseline visit by checking vital status in our local patient file system, which is linked to the Norwegian Causes of Death Registry. The Causes of Death Registry includes deaths of all residents, regardless of whether they die in Norway or abroad, and is assumed to have information on >98% of all deaths.25
Statistics
IBM SPSS version 22, Stata 13.1, and R 3.2.3 GUI 1.66 were used for different aspects of statistical analyses. Data are presented as mean ± standard deviation, median (quartiles), mean (95% confidence interval), and absolute count or percentage. Means were compared using independent samples t-tests, paired samples t-tests, or Mann–Whitney U test when appropriate.
Patients were categorized into three groups according to Δ: normal, ≥ ULN < EFLT, and ≥ EFLT at baseline. We report the change in the 6-minute walk distance in these three groups from baseline to the 3-year visit in notched boxplots. Differences in walking distance between baseline and the end of the study were compared using paired samples t-test, grouping the patients according to the Δ and the Global Initiative for Chronic Obstructive Lung Disease (GOLD) grade.2
The rate of exacerbations in the three groups was analyzed as suggested by Keene et al using a negative binomial regression model, accounting for the yearly variability among test subjects in the exacerbation rate over the 3-year study period, adjusting for FEV1, age, sex, and a binary classifier identifying frequent exacerbators in the year prior to inclusion.26 Parameter effects of the baseline explanatory variables are reported as annual rate ratios (RRs), 95% confidence interval (CI), and P-values. Moderate and severe exacerbations requiring hospitalization were also investigated on the basis of the occurrence of Δ ≥ ULN at baseline by time to first event analysis. Groups were compared using a log-rank test. Results are displayed as 1-minus-survival plots.
Survival analysis was performed with Kaplan–Meier survival analysis, comparing distributions with the log-rank test, grouping patients by the occurrence of Δ ≥ ULN at baseline, and by dichotomizing FEV1 at 50% of that predicted.
Results
Baseline characteristics
In this population of patients with COPD, 60% were men and had moderate to very severe airway obstruction. Women were, on average, 2 years younger and had lower tobacco exposure (Table S1); 50% of patients with COPD had normal Δ, 31% were classified as being abnormal with Δ ≥ ULN < EFLT, and 18% had Δ above the threshold of EFLT (Table 1). From the normal to the abnormal group, lung function worsened with a decline in FEV1 and FVC, and an increase in body mass index (BMI) and mMRC. This difference was most marked between the normal and EFLT group. For IC, we only found a significant difference between the normal and the EFLT group.
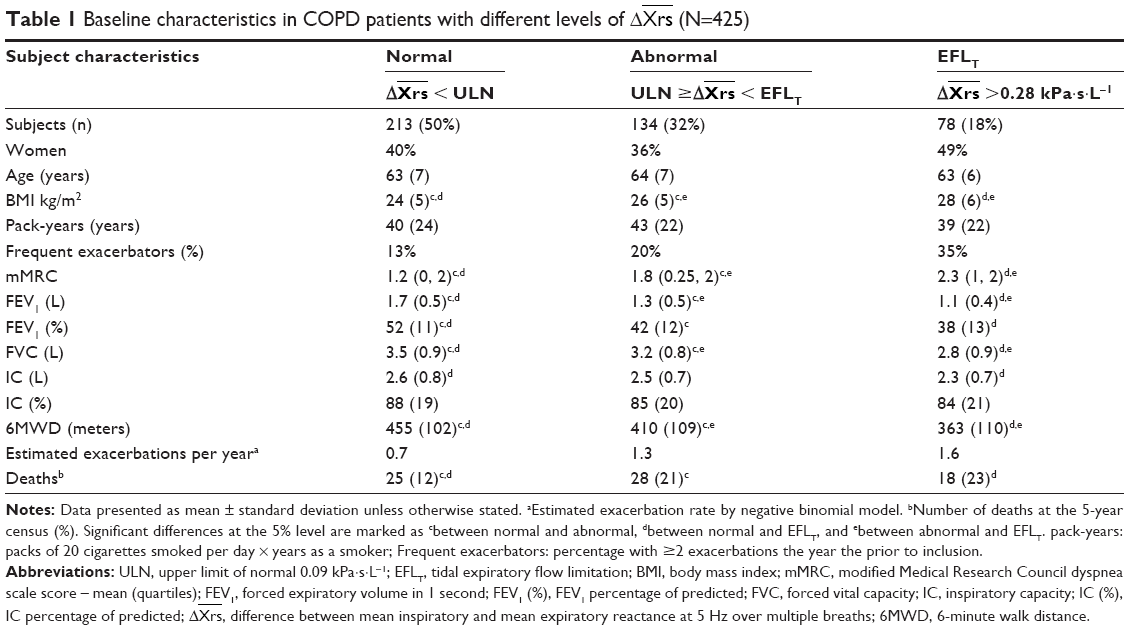 | Table 1 Baseline characteristics in COPD patients with different levels of Δ |
 (N=425)
Δ was not a stable measurement. Many patients defined as EFLT at baseline fell below the EFLT threshold during the course of the study (Figure 1). Six percent of the consequent Δ measurements were found to be normal; 23% of the patients dropped out of the study before the final visit, the main reason being death during the study period (Table 2).
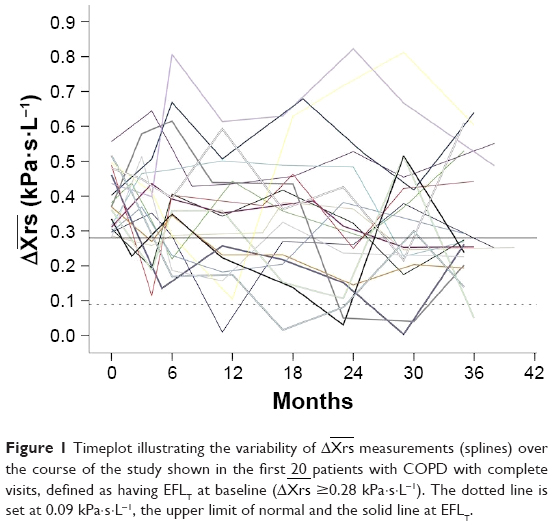 | Figure 1 Timeplot illustrating the variability of Δ |
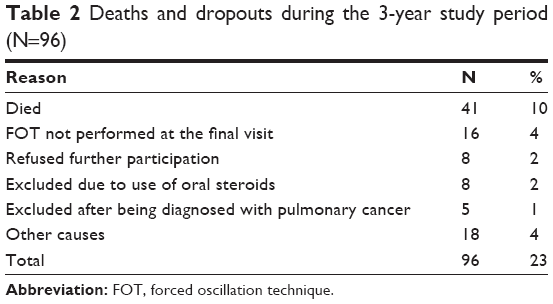 | Table 2 Deaths and dropouts during the 3-year study period (N=96) |
Relationship of EFLT to study outcomes
Δ was as poorly correlated with baseline 6-minute walking distance as FEV1 (Figure 2A and B). On a group level, 6MWD declined with increasing Δ, being 455 m in the normal, 410 m in the abnormal, and 363 m in the EFLT group (Table 1). In patients who completed both the baseline and the final visit, changes in 6MWD were compared. No significant change between the baseline and the final 3-year visit was seen in the 6MWD of patients with normal Δ. Patients with Δ ≥ ULN declined by a mean of 37 m (95% CI 15–58), P=0.001, and patients with EFLT declined by 63 m (95% CI 31–95), P<0.001 (Figure 2C). Grouping by GOLD grade produced similar boxplots. GOLD 2 patients remained stable whereas a significant decline was seen in GOLD 3–4 grades (Figure 2D).
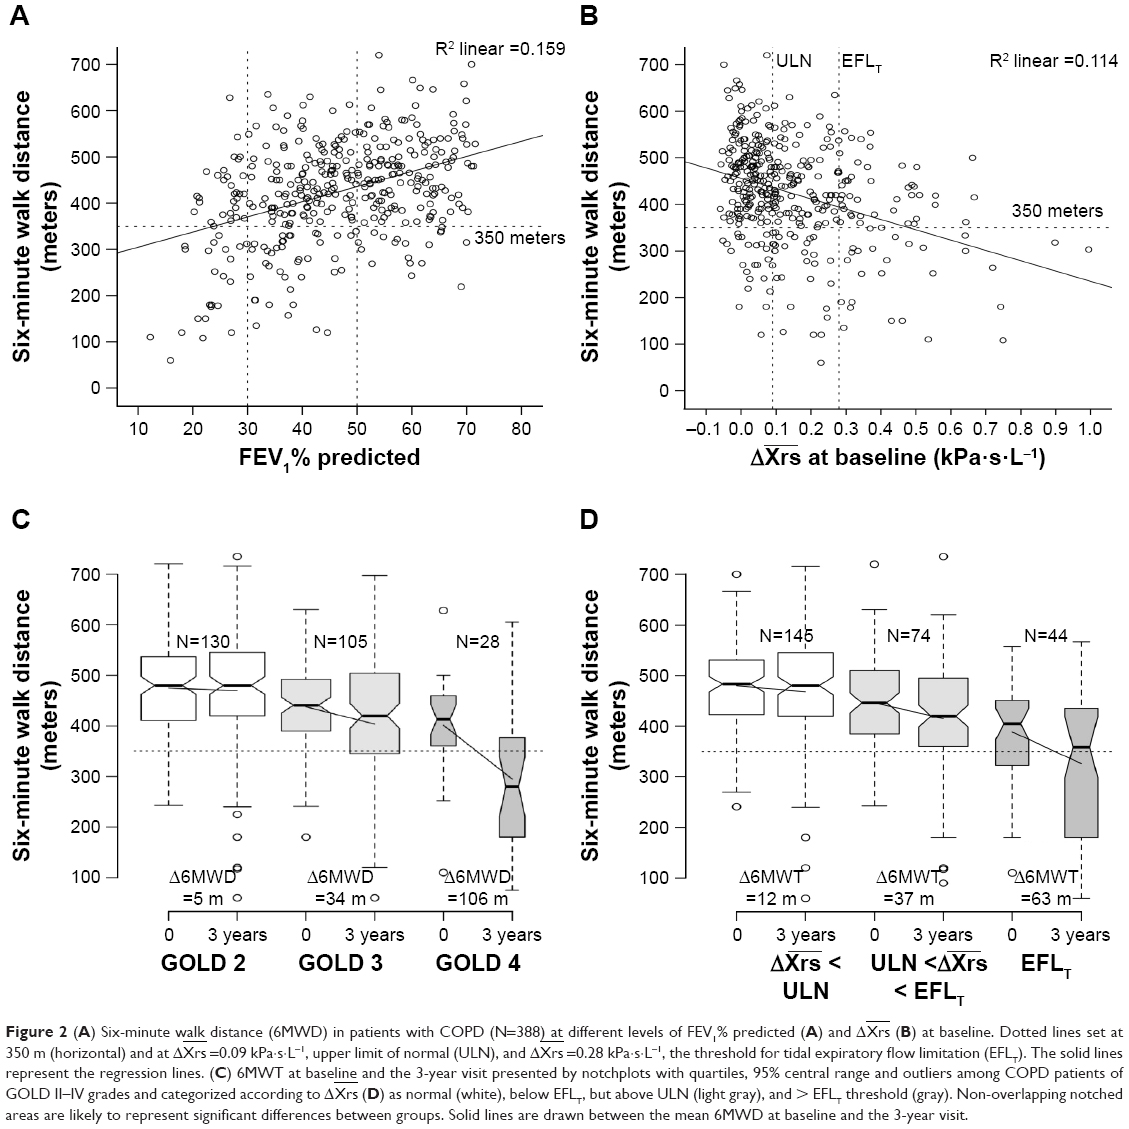 | Figure 2 (A) Six-minute walk distance (6MWD) in patients with COPD (N=388) at different levels of FEV1% predicted (A) and Δ |
A total of 1,289 moderate to severe exacerbations were recorded throughout the study. By negative binomial regression, estimated annual exacerbations rates were 0.7 in patients with normal Δ, 1.3 in patients with COPD with Δ ≥ ULN, and 1.6 in patients with EFLT. Annual exacerbation RR compared to the normal group was 1.28 for ULN patients and 1.30 for EFLT patients (Table 3). A time to first exacerbation analysis was performed in patients with COPD with and without evidence of Δ ≥ ULN at baseline. Significant differences were found in both time to first exacerbation (P=0.009) and in time to first hospitalization (P=0.017; Figure 3A). Median time to first moderate or severe exacerbation was 76 weeks in patients with COPD with normal Δ, compared with only 55 weeks in COPD patients with Δ ≥ ULN at baseline (Table 4). The time until 25% of the patients were hospitalized was 126 weeks in patients with normal Δ and 72 weeks in patients with Δ ≥ ULN.
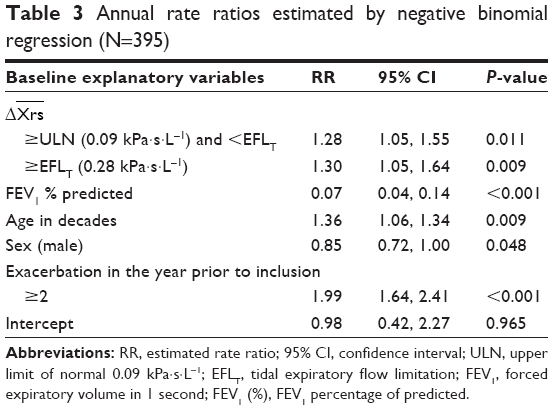 | Table 3 Annual rate ratios estimated by negative binomial regression (N=395) |
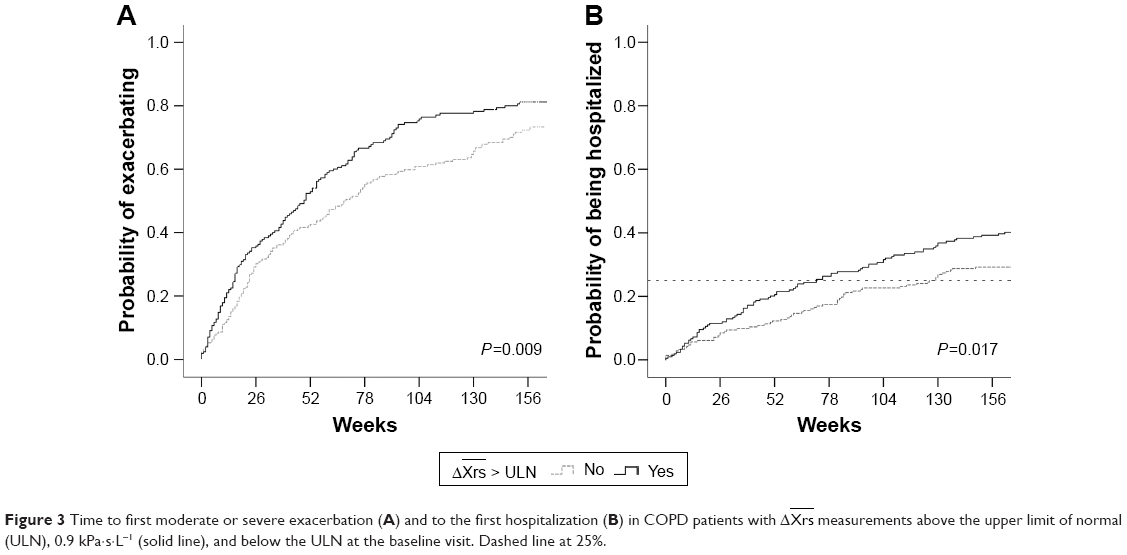 | Figure 3 Time to first moderate or severe exacerbation (A) and to the first hospitalization (B) in COPD patients with Δ |
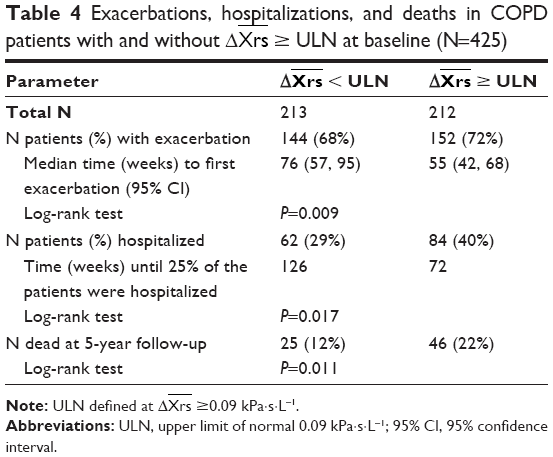 | Table 4 Exacerbations, hospitalizations, and deaths in COPD patients with and without Δ |
Mortality
At the 5-year census, 72 (17%) of the 425 patients with COPD had died. Deaths were significantly more frequent in patients with ≥ ULN than in patients with normal Δ, but not significantly different between the ≥ ULN and the EFLT, groups (Table 1). Mortality was higher in patients with FEV1 <50% (Figure 4). The difference in mortality between patients with Δ in the normal range and ≥ ULN was driven by increased mortality in patients with FEV1 >50% (Figure 4). Mortality was 17% in Δ ≥ ULN patients with FEV1 >50%, compared to 5% in patients with normal ΔXrs (P<0.001; Figure 4). Mortality in patients with ΔXrs ≥ ULN was similar to what was found in patients with COPD with much more advanced airway obstruction.
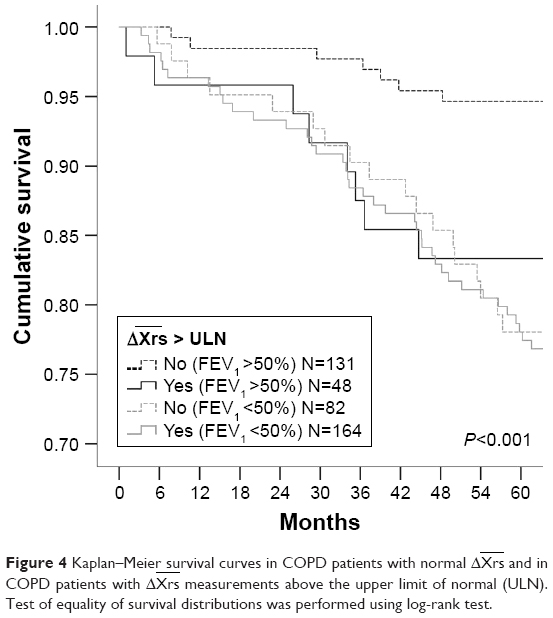 | Figure 4 Kaplan–Meier survival curves in COPD patients with normal Δ |
Discussion
Using data from the ECLIPSE study, we investigated associations between increased Δ at the ULN and at the threshold of EFLT with decline in 6MWD, risk of later exacerbations, and all-cause mortality. No change in 6MWD was found in patients with COPD with Δ in the normal range. All patients with COPD with Δ ≥ ULN deteriorated significantly in 6MWD. Patients with COPD with Δ ≥ ULN had increased risk for both moderate and severe exacerbations, and, in the patients with only moderate airway obstruction, FEV1 >50%, a significantly higher mortality. This study demonstrates that Δ provides valuable extra information in addition to FEV1 when characterizing the effects of small-airway obstruction on key COPD outcomes.
We defined the ULN at the 97.5th percentile of healthy controls included in our study. Data describing the control group have previously been published.13,18 The FOT threshold identifying a single flow-limited breath has been defined when within-breath reactance was >0.28 kPa·s·L−1.14,15 We interpreted our continuous spectrum measurements performed over several breaths as showing evidence of flow limitation when measurements between the ULN and the threshold of EFLT were found. These borderline measurements are thought to represent a mixture of normal and flow-limited breaths.
Exercise limitation is extremely common in COPD, and even small decreases in the 6MWD over time identify patients with increased risks of dying.27 When EFLT is present, patients can only increase their minute ventilation during exercise by increasing breathing frequency or by dynamic hyperinflation, allowing end-expiratory lung volume to rise.28 Dynamic hyperinflation can be induced by self-paced walking exercise. This is usually assessed by changes in operating lung volume.12,29 We did not measure lung volume during the 6MWT, but reasoned that patients with COPD showing evidence of flow limitation at baseline, either as having Δ ≥ ULN or the threshold of EFLT, were more likely to have a worse exercise tolerance at the same visit. This was true on a group level. The EFLT group had the lowest 6MWD, but neither FEV1 % predicted nor any cut-off level of Δ could identify patients with COPD with a short walking distance (<350 m), as proposed by Spruit et al.30 No significant decline was seen in patients with Δ in the normal range; in patients with COPD with Δ ≥ ULN, it declined 37 m, and in patients with EFLT, it declined by 63 m. The minimal clinically important difference on an individual level has been suggested to be 30 m in an ERS/ATS systematic review;31 consequently, the differences seen over time between our subgroups defined by Δ ≥ ULN and EFLT are likely to be clinically important.
Exacerbation and hospitalization rates at our site were similar to those reported in the completed ECLIPSE study and in the TORCH study.32,33 By negative binomial regression, the Δ cut-offs ≥ ULN and EFLT were both significant predictors for higher rates of exacerbations with very similar RR, demonstrating that the increased risk of exacerbations by EFLT is identified already at ULN. In the time to first event analysis of patients with Δ ≥ ULN, we found a shorter time to first exacerbation and a shorter time to first hospitalization than that of the COPD patients with Δ in the normal range. A previous study on hospitalized patients showed that many, but not all, have FOT-defined EFLT during a COPD exacerbation.17 FOT measurements performed during hospitalized COPD exacerbations show that Δ measurements improve during resolution of an exacerbation, although many patients remain EFLT at discharge.17 At present, there is a shortage of readily measurable biomarkers that can predict the risk of future exacerbations. Our data suggest that, after adjusting for lung function and exacerbation history, EFLT measurement can identify patients who are more likely to develop exacerbations. Further prospective studies to confirm these observations and explore their mechanism are merited.
Patients with COPD with an FEV1 >50% predicted and evidence of EFLT, defined as baseline ΔXrs ≥ ULN, had significantly higher risk of dying within the 5-year follow-up. Similar associations were not found in the patients with more advanced airway obstruction and FEV1 <50%. However, COPD is a complex, heterogeneous disease, and respiratory impairment is associated with higher incidence of comorbidities, such as hypertension, cardiovascular disease, and diabetes.34 If there is an association between Δ and mortality, the higher risk of adverse outcomes associated with comorbid disease could mask such an association with advanced disease. Although the association between death and Δ was highly significant, this sub-analysis should be interpreted with caution due to the relatively small number of deaths in patients with FEV1 >50% predicted (Table 1).
There are certain limitations of this study. The FOT threshold identifying a single flow-limited breath has been defined at Δ >0.28 kPa·s·L−1.14,15 It is not known whether the use of this threshold may lead to different results when applied to values measured over a continuous spectrum of several breaths. Previously published data show that the end-expiratory lung volume varies from breath-to-breath, affecting the prevalence of EFLT.8,15 Although the prevalence of EFLT increased as the FEV1% predicted declined, not all patients with very severe airway obstruction were found to have EFLT. In previous studies on elderly and COPD with the NEP technique, higher prevalence of EFLT have been reported than in the present study.11,35,36 Different inclusion criteria and differences in sensitivity between the NEP and the FOT technique, together with the possibility that in borderline patients the application of a NEP per se could lead to development of EFLT, are likely explanations. The wide reference range of FEV1 inevitably may also lead to an overestimation of the suspected lung function decline in many patients.23
As previously noted, EFLT varies between breaths in many patients with COPD and varies with repeat testing, likely reflecting differences in the end-expiratory lung volume on different test days.13 Physiological variability in these measurements might require the repetition of this test in different periods to increase the sensitivity of our test. Despite this limitation, important relationships related to the presence of tidal flow limitation were seen, even when the data were controlled for severity of airflow obstruction measured by FEV1. The data reflect results from the largest recruiting center in the ECLIPSE study, in which patients were carefully characterized using standardized methodologies including oscillatory mechanics.18,37
Conclusion
Consistent differences in clinically relevant outcomes were found, such as exercise capability, exacerbations, hospitalizations, and death in COPD patients with baseline Δ beyond the ULN. This is below the established threshold for EFLT. Our data support previous studies showing that patients with EFLT have worse lung mechanics than is evident from FEV1 measurement alone.11,38 The present study suggests that evidence of EFLT, measured during tidal breathing in an effort-independent fashion, can identify a subgroup of COPD patients with worse clinical outcomes.
Acknowledgments
The study was sponsored by GlaxoSmithKline. The sponsor had no role in the design of the study, collection and analysis of the data, nor in the preparation of the manuscript.
The work was performed at Haukeland University Hospital. The authors thank all participants who took part in the study, all members of the Bergen Respiratory Research Group who contributed to the data collection, and offer special thanks to Lene Svendsen, Rita Oppedal, Tina Endresen-Vinsjevik, and Eli Nordeide who performed/supervised the pulmonary function tests.
Author contributions
The corresponding author BBA wrote the manuscript, had access to all of the data in the study, and takes responsibility for the integrity of the data and the accuracy of the data analysis. PMAC was in the ECLIPSE Scientific Committee and PSB in the ECLIPSE Steering Committee. They both contributed to the development of the research design. PSB, JAH, and TMLE also contributed in the data collection. All authors, including RLJ and RD, contributed to the data analysis, the clinical interpretation of the data, and to reviewing the final submission.
Disclosure
The authors report no conflicts of interest in this work.
References
Lozano R, Naghavi M, Foreman K, et al. Global and regional mortality from 235 causes of death for 20 age groups in 1990 and 2010: a systematic analysis for the Global Burden of Disease Study 2010. Lancet. 2012;380(9859):2095–2128. | ||
From the Global Strategy for the Diagnosis, Management and Prevention of COPD. Global Initiative for Chronic Obstructive Lung Disease (GOLD) 2017. Available from: http://goldcopd.org/gold-2017-global-strategy-diagnosis-management-prevention-copd/. Accessed April 18, 2017. | ||
Soriano JB, Alfageme I, Almagro P, et al. Distribution and prognostic validity of the new Global Initiative for Chronic Obstructive Lung Disease grading classification. Chest. 2013;143(3):694–702. | ||
Franciosi LG, Page CP, Celli BR, et al. Markers of disease severity in chronic obstructive pulmonary disease. Pulm Pharmacol Ther. 2006;19(3):189–199. | ||
Gelb AF, Hogg JC, Müller NL, et al. Contribution of emphysema and small airways in COPD. Chest. 1996;109(2):353–359. | ||
Global Strategy for the Diagnosis, Management and Prevention of COPD, Global Initiative for Chronic Obstructive Lung Disease (GOLD) 2011. 2011. Available from: www.goldcopd.org. Accessed January 2, 2012. | ||
Hyatt RE. The interrelationships of pressure, flow, and volume during various respiratory maneuvers in normal and emphysematous subjects. Am Rev Respir Dis. 1961;83:676–683. | ||
O’Donnell DE. Ventilatory limitations in chronic obstructive pulmonary disease. Med Sci Sports Exerc. 2001;33(7 Suppl):S647–S655. | ||
Calverley PM, Koulouris NG. Flow limitation and dynamic hyperinflation: key concepts in modern respiratory physiology. Eur Respir J. 2005;25(1):186–199. | ||
Diaz O, Villafranca C, Ghezzo H, et al. Role of inspiratory capacity on exercise tolerance in COPD patients with and without tidal expiratory flow limitation at rest. Eur Respir J. 2000;16(2):269–275. | ||
Eltayara L, Becklake MR, Volta CA, Milic-Emili J. Relationship between chronic dyspnea and expiratory flow limitation in patients with chronic obstructive pulmonary disease. Am J Respir Crit Care Med. 1996;154(6 Pt 1):1726–1734. | ||
O’Donnell DE, Webb KA. Exertional breathlessness in patients with chronic airflow limitation. The role of lung hyperinflation. Am Rev Respir Dis. 1993;148(5):1351–1357. | ||
Aarli BB, Calverley PM, Jensen RL, Eagan TM, Bakke PS, Hardie JA. Variability of within-breath reactance in COPD patients and its association with dyspnoea. Eur Respir J. 2015;45(3):625–634. | ||
Dellacà RL, Duffy N, Pompilio PP, et al. Expiratory flow limitation detected by forced oscillation and negative expiratory pressure. Eur Respir J. 2007;29(2):363–374. | ||
Dellacà RL, Santus P, Aliverti A, et al. Detection of expiratory flow limitation in COPD using the forced oscillation technique. Eur Respir J. 2004;23(2):232–240. | ||
O’Donnell DE, Laveneziana P. Dyspnea and activity limitation in COPD: mechanical factors. COPD. 2007;4(3):225–236. | ||
Jetmalani K, Timmins S, Brown NJ, et al. Expiratory flow limitation relates to symptoms during COPD exacerbations requiring hospital admission. Int J Chron Obstruct Pulmon Dis. 2015;10:939–945. | ||
Vestbo J, Anderson W, Coxson HO, et al; ECLIPSE investigators. Evaluation of COPD longitudinally to identify predictive surrogate end-points (ECLIPSE). Eur Respir J. 2008;31(4):869–873. | ||
Mahler DA, Wells CK. Evaluation of clinical methods for rating dyspnea. Chest. 1988;93(3):580–586. | ||
Ferris BG. Epidemiology Standardization Project (American Thoracic Society). Am Rev Respir Dis. 1978;118(6 Pt 2):1–120. | ||
Standardization of spirometry, 1994 update. American Thoracic Society. Am J Respir Crit Care Med. 1995;152(3):1107–1136. | ||
Oostveen E, MacLeod D, Lorino H, et al; ERS Task Force on Respiratory Impedance Measurements. The forced oscillation technique in clinical practice: methodology, recommendations and future developments. Eur Respir J. 2003;22(6):1026–1041. | ||
Gulsvik A, Tosteson T, Bakke P, Humerfelt S, Weiss ST, Speizer FE. Expiratory and inspiratory forced vital capacity and one-second forced volume in asymptomatic never-smokers in Norway. Clin Physiol. 2001;21(6):648–660. | ||
ATS Committee on Proficiency Standards for Clinical Pulmonary Function Laboratories. ATS statement: guidelines for the six-minute walk test. Am J Respir Crit Care Med. 2002;166(1):111–117. | ||
Pedersen AG, Ellingsen CL. Data quality in the Causes of Death Registry. Tidsskr Nor Laegeforen. 2015;135(8):768–770. | ||
Keene ON, Calverley PM, Jones PW, Vestbo J, Anderson JA. Statistical analysis of exacerbation rates in COPD: TRISTAN and ISOLDE revisited. Eur Respir J. 2008;32(1):17–24. | ||
Polkey MI, Spruit MA, Edwards LD, et al. Six-minute-walk test in chronic obstructive pulmonary disease: minimal clinically important difference for death or hospitalization. Am J Respir Crit Care Med. 2013;187(4):382–386. | ||
Guenette JA, Webb KA, O’Donnell DE. Does dynamic hyperinflation contribute to dyspnoea during exercise in patients with COPD? Eur Respir J. 2012;40(2):322–329. | ||
Marin JM, Carrizo SJ, Gascon M, Sanchez A, Gallego B, Celli BR. Inspiratory capacity, dynamic hyperinflation, breathlessness, and exercise performance during the 6-minute-walk test in chronic obstructive pulmonary disease. Am J Respir Crit Care Med. 2001;163(6):1395–1399. | ||
Spruit MA, Polkey MI, Celli B, et al; Evaluation of COPD Longitudinally to Identify Predictive Surrogate Endpoints (ECLIPSE) study investigators. Predicting outcomes from 6-minute walk distance in chronic obstructive pulmonary disease. J Am Med Dir Assoc. 2012;13(3):291–297. | ||
Singh SJ, Puhan MA, Andrianopoulos V, et al. An official systematic review of the European Respiratory Society/American Thoracic Society: measurement properties of field walking tests in chronic respiratory disease. Eur Respir J. 2014;44(6):1447–1478. | ||
Hurst JR, Vestbo J, Anzueto A, et al; Evaluation of COPD Longitudinally to Identify Predictive Surrogate Endpoints (ECLIPSE) Investigators. Susceptibility to exacerbation in chronic obstructive pulmonary disease. N Engl J Med. 2010;363(12):1128–1138. | ||
Jenkins CR, Jones PW, Calverley PM, et al. Efficacy of salmeterol/fluticasone propionate by GOLD stage of chronic obstructive pulmonary disease: analysis from the randomised, placebo-controlled TORCH study. Respir Res. 2009;10:59. | ||
Mannino DM, Thorn D, Swensen A, Holguin F. Prevalence and outcomes of diabetes, hypertension and cardiovascular disease in COPD. Eur Respir J. 2008;32(4):962–969. | ||
de Bisschop C, Marty ML, Tessier JF, Barberger-Gateau P, Dartigues JF, Guénard H. Expiratory flow limitation and obstruction in the elderly. Eur Respir J. 2005;26(4):594–601. | ||
Koulouris NG, Valta P, Lavoie A, et al. A simple method to detect expiratory flow limitation during spontaneous breathing. Eur Respir J. 1995;8(2):306–313. | ||
Crim C, Celli B, Edwards LD, et al; ECLIPSE investigators. Respiratory system impedance with impulse oscillometry in healthy and COPD subjects: ECLIPSE baseline results. Respir Med. 2011;105(7):1069–1078. | ||
O’Donnell DE, Bertley JC, Chau LK, Webb KA. Qualitative aspects of exertional breathlessness in chronic airflow limitation: pathophysiologic mechanisms. Am J Respir Crit Care Med. 1997;155(1):109–115. | ||
GlaxoSmithKline. Evaluation of COPD (Chronic Obstructive Pulmonary Disease) to Longitudinally Identify Predictive Surrogate Endpoints (ECLIPSE). Available from: https://clinicaltrials.gov/show/NCT00292552?. NLM identifier: NCT00292552. Accessed April 4, 2017. |
Supplementary materials
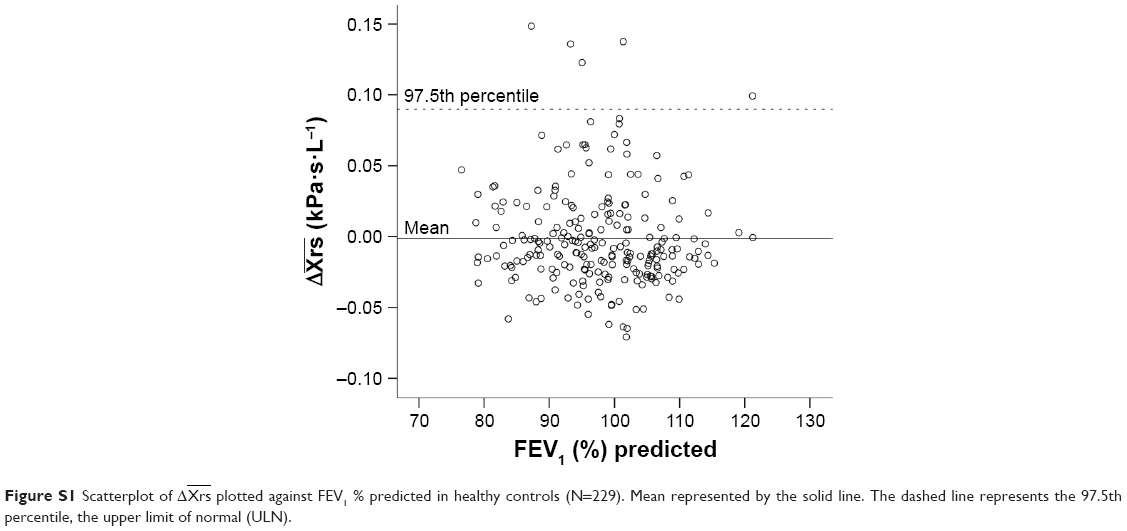 | Figure S1 Scatterplot of Δ |
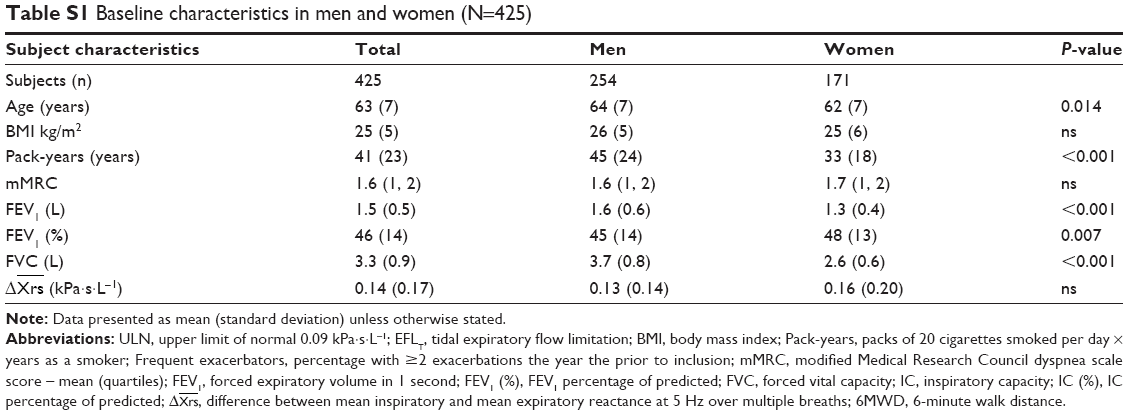 | Table S1 Baseline characteristics in men and women (N=425) |
 © 2017 The Author(s). This work is published and licensed by Dove Medical Press Limited. The
full terms of this license are available at https://www.dovepress.com/terms
and incorporate the Creative Commons Attribution
- Non Commercial (unported, 3.0) License.
By accessing the work you hereby accept the Terms. Non-commercial uses of the work are permitted
without any further permission from Dove Medical Press Limited, provided the work is properly
attributed. For permission for commercial use of this work, please see paragraphs 4.2 and 5 of our Terms.
© 2017 The Author(s). This work is published and licensed by Dove Medical Press Limited. The
full terms of this license are available at https://www.dovepress.com/terms
and incorporate the Creative Commons Attribution
- Non Commercial (unported, 3.0) License.
By accessing the work you hereby accept the Terms. Non-commercial uses of the work are permitted
without any further permission from Dove Medical Press Limited, provided the work is properly
attributed. For permission for commercial use of this work, please see paragraphs 4.2 and 5 of our Terms.