Back to Journals » International Journal of General Medicine » Volume 14
The Association Between Red Blood Cell Distribution Width and the Severity of Diabetic Chronic Kidney Disease
Received 5 August 2021
Accepted for publication 1 October 2021
Published 16 November 2021 Volume 2021:14 Pages 8355—8363
DOI https://doi.org/10.2147/IJGM.S332848
Checked for plagiarism Yes
Review by Single anonymous peer review
Peer reviewer comments 2
Editor who approved publication: Dr Scott Fraser
Li Gu,1 Song Xue2
1Department of Endocrinology, People’s Hospital of Gaochun, Nanjing, 211300, People’s Republic of China; 2Department of Pathology, People’s Hospital of Gaochun, Nanjing, 211300, People’s Republic of China
Correspondence: Li Gu
Department of Endocrinology, People’s Hospital of Gaochun, No. 53 Maoshan Road, Gaochun District Economic Development Zone, Nanjing, 211300, People’s Republic of China
Tel +86 13851529447
Email [email protected]
Purpose: Red cell distribution width (RDW) has been evidenced to be related to various diabetes-associated macrovascular and microvascular complications. However, the studies on the association between RDW and diabetic chronic kidney disease (CKD) are still scarce. The aim of the study is to explore whether there is any association between RDW and the severity of diabetic CKD.
Patients and Methods: The study recruited 396 patients diagnosed with diabetic CKD at People’s Hospital of Gaochun from January 2006 to April 2021. Baseline characteristics were gathered and laboratory tests were performed to measure clinical indexes. Patients were also categorized into three groups based on their CKD stages. Correlation analysis and multivariate ordinal logistic regression were performed to investigate the association between RDW and the severity of diabetic CKD. The risk size was described as odds ratio (OR) and 95% confidence interval (CI).
Results: We found a significant association between RDW and the severity of CKD, with a correlation coefficient of 0.32 (P < 0.01). We used three models for multivariate ordinal logistic regression to investigate the relationship between RDW and the severity of CKD. Results showed that RDW is an independent and significant risk factor of diabetic CKD after adjustment for demographic data, physiological indexes, and drug history [Model 3 OR (95% CI) = 1.225 (1.023– 1.467)]. In subgroup analysis, RDW remained a significant risk factor in all three models for patients who had diabetes of 5– 10 years [Model 3 OR (95% CI) = 1.480 (1.067– 2.052)] and had a HbA1c level > 7% [(Model 3 OR (95% CI) = 1.478 (1.184– 1.845)].
Conclusion: RDW is significantly associated with the disease stages of diabetic CKD, and the risk is higher for people with 5– 10 years of diabetes and for those who do not control the HbA1c level well. This study has implications for the diagnosis, monitoring, and timely treatment of the diabetic CKD.
Keywords: red cell distribution width, diabetic chronic kidney disease, correlation, inflammation
Introduction
Red cell distribution width (RDW) is the measure of the size variability of red blood cells, and is not different in women compared to men.1 It is often used in the assessment of anemia, as the increase in RDW levels is related to impaired red blood cell production or red blood cell degradation.2 Additionally, RDW is also considered as a novel inflammatory marker associated with conditions characterized by subtle or overt inflammation, which included thyroiditis,3 rheumatoid arthritis,4 hepatic steatosis,5 vertebral disc hernia,6 malignant thyroid nodules,7 and T2 DM.8 Previous study pointed that an increase in RDW level has been shown to be closely related to T2 DM or its complications, and may also be marker of worsening diabetes control.8 Not only that, in a study conducted by Zhang et al,9 higher RDW values were found to be negatively correlated with estimated glomerular filtration rate (eGFR) and positively correlated with heavier proteinuria, lower levels of albumin, which indicated that the increase in RDW could bring the higher risk of diabetic nephropathy patients, with possible mechanisms of accelerating chronic inflammation and increasing oxidative stress. RDW values were also significantly associated with the risk of progression from DN to ESRD as reported by Chen et al.10 However, there are few research reports on the relationship between RDW and diabetes-related complications, especially on the severity of diabetic CKD.
Previous study that focused on RDW as a risk factor of diabetic nephropathy generally divided patients into several categories based on their RDW levels. Therefore, our study aimed to explore whether an association exists between the severity of diabetic CKD and patients’ RDW values. A better understanding of the relationship between RDW and diabetic CKD could inform and facilitate doctors in assessing the severity of the diabetic CKD, formulating targeted treatment plans, and inferring prognosis.
Materials and Methods
Patient and Public Involvement
Participants received no extra interventions and the only risk came from the conventional treatment, thus requiring no informed consents.
Study Design
The study was a retrospective, observational study that analyzed the data gathered previously. We enrolled 396 patients with diagnosed diabetic CKD at People’s Hospital of Gaochun from January 2006 to April 2021. Participants received no extra interventions and the only risk came from the conventional treatment, thus requiring no informed consents. Patients’ information should be deidentified to protect privacy. This study was conducted in accordance with the Declaration of Helsinki; The study was approved by the Institutional Review Board (IRB: No. 2021–164-01) from People’s Hospital of Gaochun.
Inclusion Criteria
Patients must meet all of the following criteria in order to be included in the study: 1) age ≥ 18 years old; 2) Diagnosed with diabetic CKD (diagnostic criteria see Table 1) through clinical and laboratory tests; 3) eGFR > 15mL/min*1.73m2; 4) Intact data on baseline, clinical and laboratory examinations.
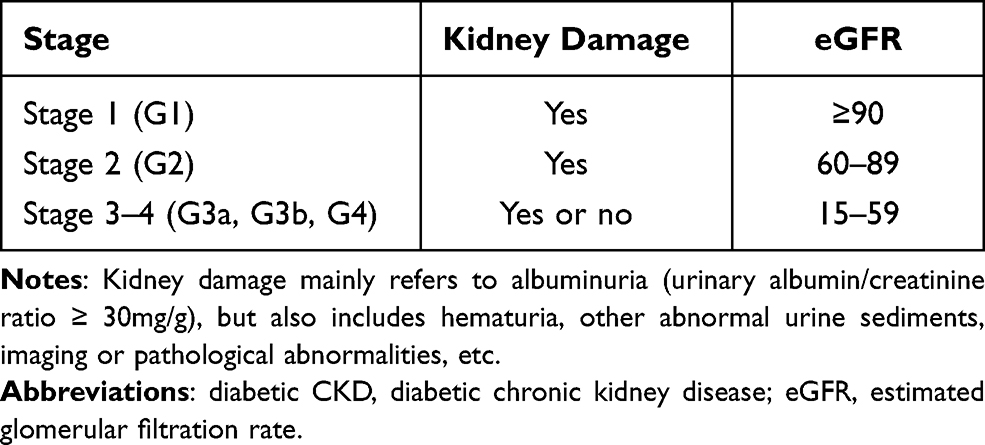 |
Table 1 Groups of Diabetic CKD |
Exclusion Criteria
Patients meeting any one of the following criteria should be excluded from the study: 1) having other systematic diseases (acute pancreatitis, iron deficiency anemia, pernicious anemia); 2) having acute diabetic complications; 3) having malignant tumors; 4) having other kidney diseases; 5) having taken drugs that could affect the RDW within one week of the blood draw; 6) having taken other test drugs or under other clinical trials within 1 month of the study.
Data Collection
Baseline characteristics included age, gender, weight, height, diastolic blood pressure, systolic blood pressure, duration of diabetes, smoking history, drinking history, etc. The laboratory tests measured RDW, C-reactive protein (CRP), fasting blood glucose (FBG), glycosylated hemoglobin (HbAlc), total cholesterol (TC), triglycerides (TG), blood uric acid (UA), and history of drug use; of which the determination of RDW adopted automated blood cell counter (model number: SYSMEX XN9000); the other biochemical indexes were measured by biochemical detector (model number: Beckman 5800).
Statistical Analysis
All statistical analysis was performed using SAS 9.4. All statistical tests were two-sided and used α=0.05 as a statistically significant level. Kolmogorov–Smirnov test was used to test the normality of the qualitative data, and the continuous variables of normal distribution were used as mean ± standard deviation (Mean ± SD). Comparison between groups is tested by analysis of variance. Data of non-normal distribution is represented by the median and interquartile range, and the comparison between groups was analyzed by Kruskal-Wallis H rank sum test. Categorical variables described the number and percentage of each type, and comparisons between groups will be processed by chi-square (χ2) test. A correlation coefficient heat map was used to display the correlation between laboratory indicators and the severity of diabetic CKD. A multivariate ordinal logistic regression was performed with the severity of diabetic CKD as the dependent variable and the RDW as the independent variable. Model 1 only includes RDW. Model 2 adjusted for the factors of gender, age, diabetic course and UA. Model 3 adjusted for gender, age, diabetic course, UA and other factors that have been shown to be related to diabetic CKD in previous literature. Based on the duration of diabetes, patients were divided into three subgroups for analysis of correlation between RDW and the severity of diabetic CKD: <5 years, 5–10 years, and >10 years. A cutoff of HbA1c >7% was also used to categorize the patients into two subgroups and examine the correlation between RDW and the severity of the disease of interest.
P < 0.05 was regarded as statistically significant.
Results
Comparison Between Groups
Patients were divided into three groups based on the stage of the diabetic CKD: stage 1, stage 2, stage 3–4. The results for comparison between groups in demographic data and laboratory measurements were shown in Tables 2 and 3. Significant differences in demographic data were found between groups in age (stage 1: 55.07 ± 13.23, stage 2: 64.59 ± 11.14, stage 3–4: 66.66 ± 11.29), gender [stage 1: 66 (40.49) male, stage 2: 75 (54.35), stage 3–4: 49 (51.58)], duration of diabetes [stage 1: 60.00 (6.00, 120.00), stage 2: 120.00 (60.00, 168.00), stage 3–4: 120.00 (60.00, 120.00)], and smoking history [stage 1:20 (12.27), stage 2: 13 (9.42), stage 3–4: 3 (3.16)]. In laboratory measurements, systolic blood pressure (stage 1: 142.14 ± 19.30, stage 2: 147.21 ± 20.60, stage 3–4: 148.07 ± 24.18), RDW (stage 1: 13.04 ± 1.34, stage 2: 13.52 ± 1.08, stage 3: 13.78± 1.25), FBG [stage 1: 10.65 (7.84, 13.78), stage 2: 10.17 (6.86, 12.87), stage 3–4: 8.23 (5.93, 10.76)], HbAlc (stage 1: 10.10 ± 2.30, stage 2: 9.62 ± 2.21, stage 3–4: 8.75 ± 2.30), HDL-C (stage 1: 1.21 ± 0.30, stage 2: 1.30 ± 0.35, stage 3–4: 1.37 ± 0.44), and UA (stage 1: 289.09 ± 85.60, stage 2: 335.27 ± 95.69, stage 3–4: 414.76 ± 116.20) showed statistically significant difference between the three groups. In medication history, the use of renin–angiotensin–aldosterone system (RAAS) [stage 1: 42 (25.77), stage 2: 49 (35.51), stage 3–4: 39 (41.05)] and antihypertensive drugs [stage 1: 49 (30.06), stage 2: 62 (44.93), stage 3–4: 49 (51.58)] differed significantly between three groups. The factors that showed significant differences between groups were adjusted in future models of logistic regression.
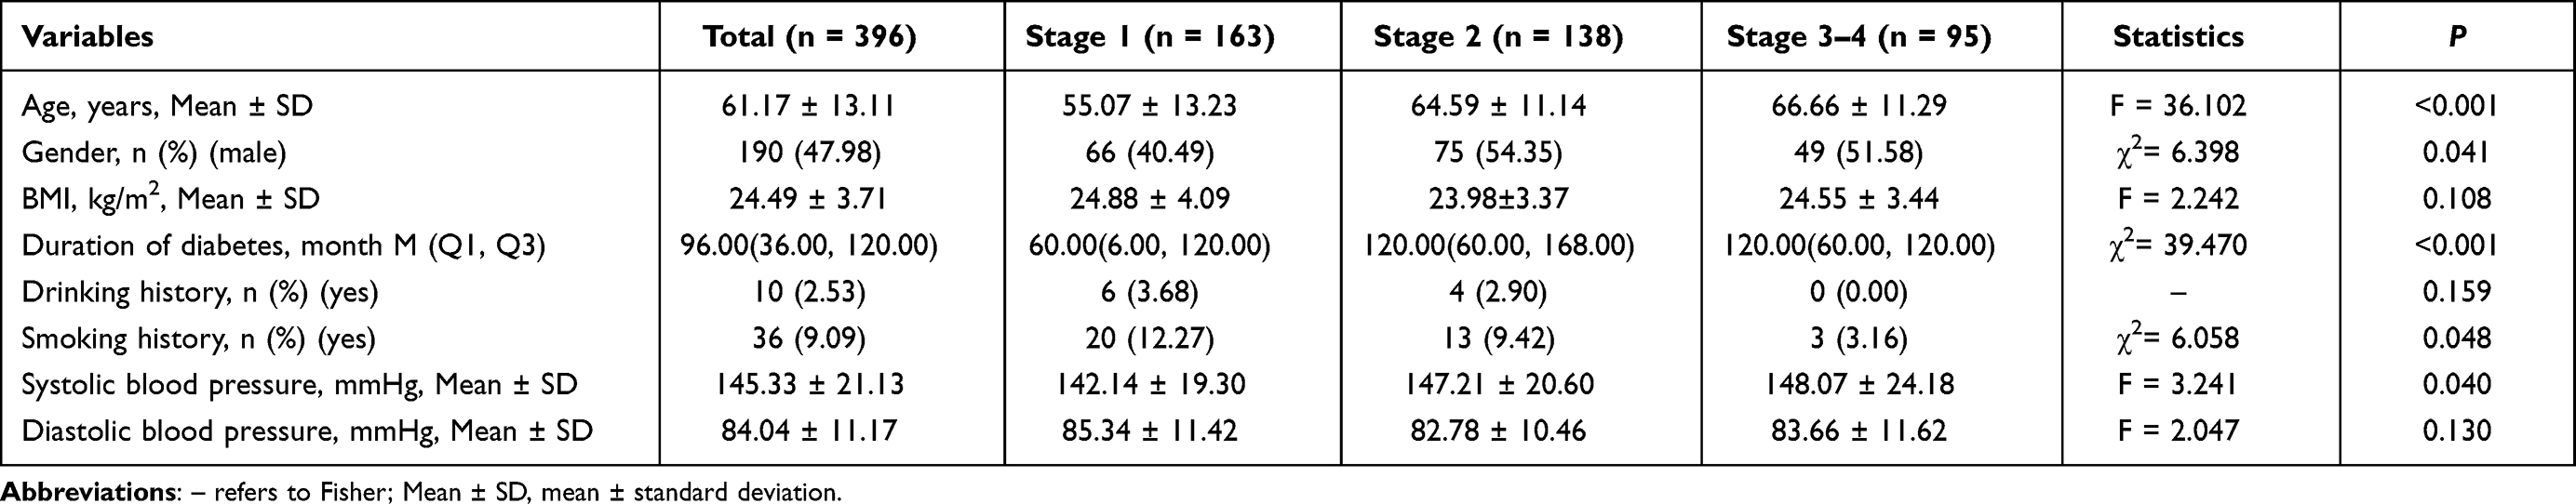 |
Table 2 Comparison Among the Three Groups in Demographic Data |
 |
Table 3 Comparison Among the Three Groups in Laboratory Measurements |
To further pinpoint the difference between groups in RDW levels, we drew a violin plot (Figure 1) and found significant differences between patients in stage 2 and stage 1, and between patients in stage 3–4 and stage 1. However, the difference between patients in stage 2 and stage 3–4 did not reach the significant level.
 |
Figure 1 Violin plot of RDW for three groups. ***P<0.001. |
Correlation Analysis
From the Spearman correlation analysis matrix heat map, we found that the correlation coefficient between RDW and the severity of diabetic CKD was 0.32, second only to the correlation coefficient between uric acid and the severity of diabetic CKD (0.42). The P value was <0.01 (Figure 2), indicating a significant correlation.
 |
Figure 2 Correlation coefficient heat map. *P < 0.1, **P < 0.05, ***P < 0.001 (CKD represents the severity of kidney disease). Abbreviations: RDW, red blood cell distribution width; UA, blood uric acid; GLU, glucose; HbAlc, glycosylated hemoglobin; TC, total cholesterol; TG, triglycerides; CRP, C-reactive protein; diabetic CKD, diabetic chronic kidney disease. |
We also made a scattered plot matrix to illustrate the relationship between various laboratory measurements (Figure 3). Results showed a negative correlation between eGFR and RDW.
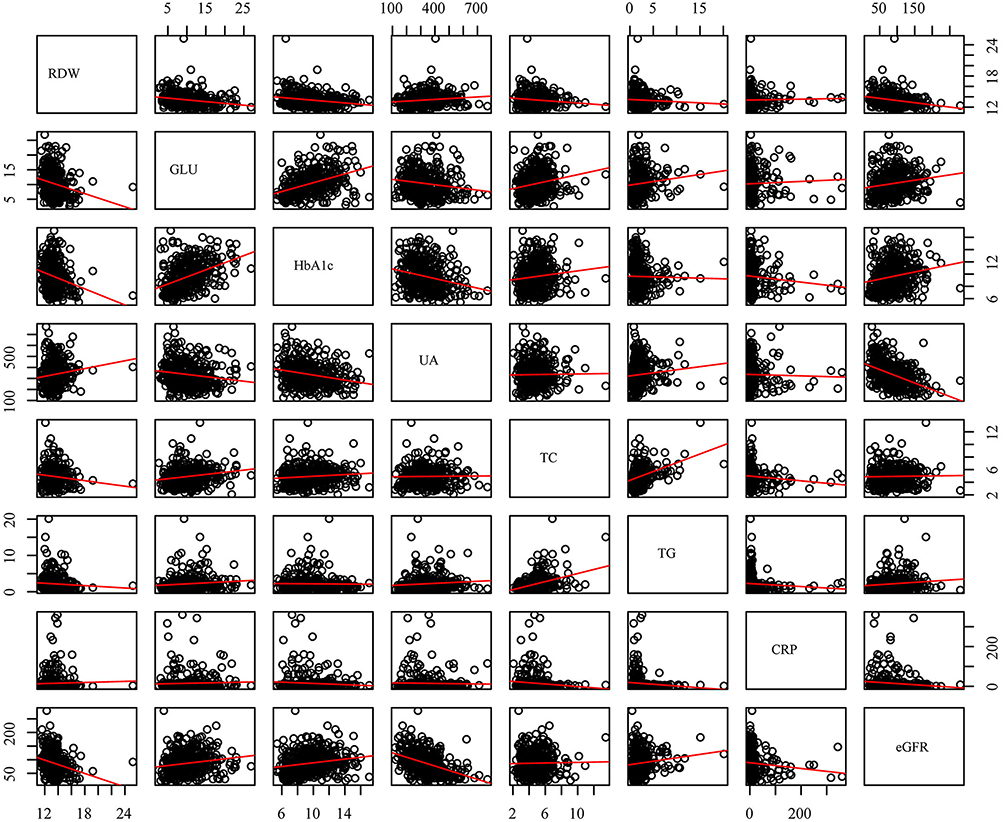 |
Figure 3 Scatter plot matrix of laboratory measurements. |
Multivariate Ordinal Logistic Regression
We used three models to evaluate the association between RDW and the severity of diabetic CKD. Model 1 was a crude model that only included RDW [OR (95% CI) = 1.546 (1.302–1.835)] as the dependent variable without any adjustment of other factors. Model 2 adjusted for gender, age, duration of diabetes, and UA. The OR (95% CI) of RDW in model 2 was 1.289 (1.070–1.540). Model 3 further adjusted for gender, age, duration of diabetes, smoking history, systolic blood pressure, FBG, HbA1c, UA, CRP, and history of renin-angiotensin-aldosterone-system (RAAS) drug and antihypertensive drug use, resulting in an OR (95% CI) of 1.2225 (1.023–1.467). It can be seen that RDW has been a consistent significant risk factor for CKD in all three models, though the effect size declined with the inclusion of more adjusted factors (Figure 4).
 |
Figure 4 Multivariate ordinal logistic regression. Abbreviations: RDW, red blood cell distribution width; UA, blood uric acid; SBP, systolic pressure; GLU, glucose; HbAlc, glycosylated hemoglobin; CRP, C-reactive protein; RAAS, renin–angiotensin–aldosterone system; OR, odds ratio; CI, confidence interval. |
Subgroup Analysis
We divided patients into three subgroups based on the duration of diabetes and performed multivariate ordinal logistic regression analysis for each subgroup using all three models. We found that only in patients who have diabetes for 5–10 years, RDW was a significant risk factor in all three models [Model 3 OR (95% CI) = 1.480 (1.067–2.052)] (Figure 5).
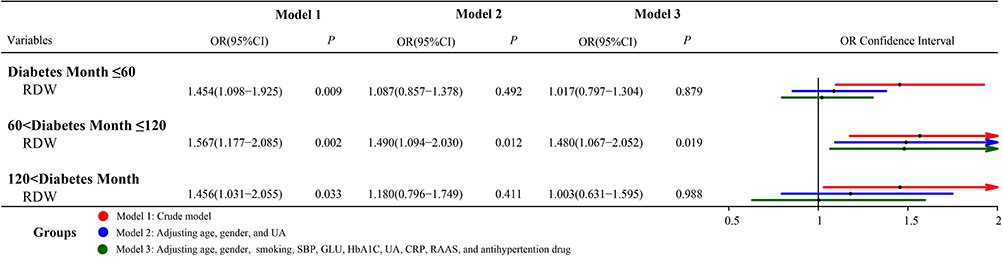 |
Figure 5 Multivariate ordinal logistic regression for subgroups (duration of diabetes). Abbreviations: RDW, red blood cell distribution width; UA, blood uric acid; SBP, systolic pressure; GLU, glucose; HbAlc, glycosylated hemoglobin; CRP, C-reactive protein; RAAS, renin–angiotensin–aldosterone system; OR, odds ratio; CI, confidence interval. |
We also divided patients into two subgroups using a HbA1c cutoff value of 7%. When the HbA1c level is not well controlled (>7%), RDW is a significant risk factor for all three models [Model 3 OR (95% CI) = 1.478 (1.184–1.845)] (Figure 6).
 |
Figure 6 Multivariate ordinal logistic regression for subgroups (HbA1c). Abbreviations: RDW, red blood cell distribution width; UA, blood uric acid; SBP, systolic pressure; GLU, glucose; HbAlc, glycosylated hemoglobin; CRP, C-reactive protein; RAAS, renin–angiotensin–aldosterone system; OR, odds ratio; CI, confidence interval. |
Discussion
Our study found a significant association between the severity of diabetic CKD and the RDW level. Higher RDW levels were associated with more severe forms of diabetic CKD. The RDW remained an independent risk factor of diabetic CKD after adjustment and the risk increased for patients who had diabetes for 5–10 years and who did not control the HbA1c level well. The RDW level could be a useful prognostic biomarker in stratifying patients regarding the disease stages of CKD.
The findings of our study are mostly in line with previous research. In recent years, there has been a growing interest in investigating the relationship between RDW and diabetic CKD due to a recognition of the role that RDW plays in cardiovascular diseases through the possible mechanism of increasing oxidative stress and inducing vascular inflammation.11 One study divided patients into four quartiles based on their RDW levels (Q1 < 12.4%, 12.4% < Q2 < 12.9%, 12.9%< Q3 < 13.5%, Q4 > 13.5%) found that the incidence of diabetic CKD was higher in Q3 or Q4 group compared with Q1.12 A study in Egypt that divided 100 patients into five groups–diabetic patients, pre-renal failure patients, diabetic pre-renal failure patients, renal failure patients, and diabetic renal failure patients–also showed that patients from the diabetic renal dysfunction group have elevated levels of RDW compared to normal people in the control group.13
RDW could be a potential predictive index of the kidney damage by serving as an indicator of elevated level of inflammation in the body. Low grade, persistent inflammation is considered as the hallmark of CKD.14 Inflammation could affect the growth, shorten half-life of red blood cells and induce anisocytosis, which then leads to increased level of RDW.15 Not only that, RDW has also been proved by previous studies to be linked to CPR and interleukin-6 (IL-6). CPR and IL-6 are both well-established biomarkers reflecting the inflammatory status and are evidenced to be involved in the development of diabetic complications. Diabetic CKD, was a disease associated with inflammation, may lead to an increase in inflammatory cytokines, leading to an increase in RDW.16 Additionally, oxidative stress is another important factor that cannot be ignored in the progression of diabetic CKD.17 It can cause the abnormality and deformity of red blood cells,18 providing another possible explanation regarding the association between RDW and diabetic CKD. Zhang et al19 studied a group of 320 patients with newly diagnosed type 2 diabetes and reported that RDW is independently associated with microalbuminuria (MAU), which is an indicator of oxidative stress and inflammatory response in the body and is associated with CKD.
Inflammatory status and oxidative stress in the development of diabetic CKD reflected in elevated RDW levels, which may accelerate kidney damage. Increased RDW values have also been reported in end-stage renal disease (ESRD) patients of hemodialysis,20 which indicated the association between RDW and renal functions. However, there have been some contrary reports to note that RDW was not associated with inflammatory conditions such as coronary heart disease21 and vitamin D deficiency,22 because accompanied diseases, such as iron deficiency anemia, might also affect RDW values as well as, which caused an enhance in RDW. Therefore, our conclusion needs to be confirmed by more related studies.
Previous studies have already identified Cystatin C, serum neutrophil gelatinase-associated lipocalin, and Chitinase-3-like protein 1 (YKL-40) etc. as effective predictive biomarkers of diabetic CKD. Our study adds to the current knowledge that RDW could be another potential biomarker for the severity stratification and prognostic prediction of patients with diabetes. Moreover, the subgroup analysis revealed that it might be of higher predictive value for patients with 5–10 years of diabetes duration and those who have HbA1c levels higher than 7%. Therefore, physicians should pay closer attention to those populations in monitoring their RDW values and the severity of the diabetic CKD in order to provide timely treatment.
Compared with previous studies, our study presents its own strength. Previous studies have mainly focused on the association between eGFR and RDW. None of them have examined the association by looking at the specific CKD stage that the patients belonged to. Our study analyzed the association between RDW and diabetic CKD by categorizing patients into three groups based on their CKD stage, which might be of higher practical value for physicians. We also performed subgroup analysis according to the duration of disease and HbA1c level. The variations in the association found between subgroups indicate that the effectiveness of using RDW as a prognostic biomarker might differ for population with different characteristics. Certain groups of populations should be more cautious in monitoring the risk of developing more severe forms of CKD if they have elevated levels of RDW. Moreover, our study used laboratory testing data and is therefore without subjective bias associated with self-reporting results. However, our study does have limitations. One is that it is a single-center study with data from one country, so the results might not be able to be extrapolated to other clinical settings or other ethnic groups. Another limitation is that the study was an observational study so we could not establish a causal relationship between RDW and the CKD status. Also, other factors might have an impact on the RDW level but were not examined or controlled in this study, such as the mineral level like iron and vitamin level like B12 and folic acid.14
Conclusion
In summary, our study established an association between RDW and the severity of diabetic CKD. High RDW level indicates a greater risk of developing more severe forms of diabetic CKD. The risk size also differs between subgroups with a higher risk for patients who have diabetes for 5–10 years or have HbA1c levels >7%. RDW could be a potential biomarker for the screening, diagnosis and prognosis of the diabetic CKD, providing a new approach in determining the disease stage and thus planning for the best possible health care for patients. Future research is still needed to unveil the biological and physiological mechanisms behind the association and determine whether a causal relationship exists.
Ethics Approval and Informed Consent
The study was approved by the Institutional Review Board (IRB: No. 2021-164-01) from People’s Hospital of Gaochun. Written informed consent has been obtained from all participants.
Consent for Publication
Written informed consent has been obtained from all participants.
Author Contributions
All authors made a significant contribution to the work reported, whether that is in the conception, study design, execution, acquisition of data, analysis and interpretation, or in all these areas; took part in drafting, revising or critically reviewing the article; gave final approval of the version to be published; have agreed on the journal to which the article has been submitted; and agree to be accountable for all aspects of the work.
Funding
There is no funding to report.
Disclosure
The authors report no conflicts of interest in this work.
References
1. Duman TT, Aktas G, Meryem Atak B, et al. General characteristics of anemia in postmenopausal women and elderly men. Aging Male. 2020;23:780–784. doi:10.1080/13685538.2019.1595571
2. Evans TC, Jehle D. The red blood cell distribution width. J Em Med. 1991;9 Suppl 1:71–74. doi:10.1016/0736-4679(91)90592-4
3. Aktas G, Sit M, Dikbas O, et al. Could red cell distribution width be a marker in Hashimoto’s thyroiditis? Exp Clin Endocrinol Diabetes. 2014;122:572–574. doi:10.1055/s-0034-1383564
4. Cakır L, Aktas G, Mercimek OB, et al. Are red cell distribution width and mean platelet volume associated with rheumatoid arthritis? Biomed Res. 2016;27:292–294.
5. Aktas G, Alcelik A, Tekce BK, et al. Mean platelet volume and red cell distribution width in hepatosteatosis. National j Med Res. 2013;3:264–266.
6. Dagistan Y, Dagistan E, Aktas G, et al. Could red cell distribution width and mean platelet volume be a predictor for lumbar disc hernias? Ideggyogy Sz. 2016;69:411–414. doi:10.18071/isz.69.0411
7. Aktas G, Sit M, Karagoz I, et al. Could red cell distribution width be a marker of thyroid cancer? J Coll Physicians Surg Pak. 2017;27:556–558.
8. Bilgin S, Aktas G, Kocak ZM, et al. Association between novel inflammatory markers derived from hemogram indices and metabolic parameters in type 2 diabetic men. Aging Male. 2020;23:923–927. doi:10.1080/13685538.2019.1632283
9. Zhang J, Zhang R, Wang Y, et al. The association between the red cell distribution width and diabetic nephropathy in patients with type-2 diabetes mellitus. Ren Fail. 2018;40:590–596. doi:10.1080/0886022X.2018.1532906
10. Chen TK, Knicely DH, Grams ME. Chronic kidney disease diagnosis and management: a review. JAMA. 2019;322:1294–1304. doi:10.1001/jama.2019.14745
11. Magri CJ, Fava S. Red blood cell distribution width and diabetes-associated complications. Diabetes Metab Syndr. 2014;8:13–17. doi:10.1016/j.dsx.2013.10.012
12. Xiong XF, Yang Y, Chen X, et al. Red cell distribution width as a significant indicator of medication and prognosis in type 2 diabetic patients. Sci Rep. 2017;7:2709. doi:10.1038/s41598-017-02904-9
13. Abdel-Moneim A, Mahmoud B, Nabil A, Negeem Z. Correlation between oxidative stress and hematological profile abnormalities in diabetic nephropathy. Diabetes Metab Syndr. 2019;13:2365–2373. doi:10.1016/j.dsx.2019.06.014
14. Mihai S, Codrici E, Popescu ID, et al. Inflammation-related mechanisms in chronic kidney disease prediction, progression, and outcome. J Immunol Res. 2018;2018:2180373. doi:10.1155/2018/2180373
15. Weiss G, Goodnough LT. Anemia of chronic disease. N Engl J Med. 2005;352:1011–1023. doi:10.1056/NEJMra041809
16. Solak Y, Yilmaz MI, Saglam M, et al. Red cell distribution width is independently related to endothelial dysfunction in patients with chronic kidney disease. Am J Med Sci. 2014;347:118–124. doi:10.1097/MAJ.0b013e3182996a96
17. Sifuentes-Franco S, Padilla-Tejeda DE, Carrillo-Ibarra S, Miranda-Díaz AG. Oxidative stress, apoptosis, and mitochondrial function in diabetic nephropathy. Int J Endocrinol. 2018;2018:1875870. doi:10.1155/2018/1875870
18. Friedman JS, Lopez MF, Fleming MD, et al. SOD2-deficiency anemia: protein oxidation and altered protein expression reveal targets of damage, stress response, and antioxidant responsiveness. Blood. 2004;104:2565–2573. doi:10.1182/blood-2003-11-3858
19. Zhang M, Zhang Y, Li C, He L. Association between red blood cell distribution and renal function in patients with untreated type 2 diabetes mellitus. Ren Fail. 2015;37:659–663. doi:10.3109/0886022X.2015.1010938
20. Tekce H, Kin tekce B, Aktas G, Tanrisev M, Sit M. The evaluation of red cell distribution width in chronic hemodialysis patients. Int J Nephrol. 2014;2014:754370. doi:10.1155/2014/754370
21. Sincer I, Mansiroglu AK, Aktas G, Gunes Y, Kocak MZ. Association between Hemogram Parameters and Coronary Collateral Development in Subjects with Non-ST-Elevation Myocardial Infarction. Rev Assoc Med Bras. 2020;66:160–165. doi:10.1590/1806-9282.66.2.160
22. Erkus E, Aktas G, Atak BM, Kocak MZ, Duman TT, Savli H. Haemogram Parameters in Vitamin D Deficiency. J Coll Physicians Surg Pak. 2018;28:779–782.
 © 2021 The Author(s). This work is published and licensed by Dove Medical Press Limited. The
full terms of this license are available at https://www.dovepress.com/terms
and incorporate the Creative Commons Attribution
- Non Commercial (unported, 3.0) License.
By accessing the work you hereby accept the Terms. Non-commercial uses of the work are permitted
without any further permission from Dove Medical Press Limited, provided the work is properly
attributed. For permission for commercial use of this work, please see paragraphs 4.2 and 5 of our Terms.
© 2021 The Author(s). This work is published and licensed by Dove Medical Press Limited. The
full terms of this license are available at https://www.dovepress.com/terms
and incorporate the Creative Commons Attribution
- Non Commercial (unported, 3.0) License.
By accessing the work you hereby accept the Terms. Non-commercial uses of the work are permitted
without any further permission from Dove Medical Press Limited, provided the work is properly
attributed. For permission for commercial use of this work, please see paragraphs 4.2 and 5 of our Terms.