Back to Journals » Journal of Pain Research » Volume 8
The association between lower back pain and health status, work productivity, and health care resource use in Japan
Authors Sadosky A, DiBonaventura M, Cappelleri J ![]() , Ebata N
, Ebata N ![]() , Fujii K
, Fujii K
Received 30 October 2014
Accepted for publication 5 December 2014
Published 25 February 2015 Volume 2015:8 Pages 119—130
DOI https://doi.org/10.2147/JPR.S76649
Checked for plagiarism Yes
Review by Single anonymous peer review
Peer reviewer comments 3
Editor who approved publication: Dr Michael Schatman
Alesia B Sadosky,1 Marco DiBonaventura,2 Joseph C Cappelleri,3 Nozomi Ebata,4 Koichi Fujii4
1Pfizer Inc, New York, NY, USA; 2Kantar Health, New York, NY, USA; 3Pfizer Inc, Groton, CT, USA; 4Pfizer Japan Inc, Tokyo, Japan
Introduction: This study investigated the effect of pain severity on health status, work productivity, health care resource use, and costs among respondents with lower back pain (LBP), in Japan.
Materials and methods: Data from the 2013 Japan National Health and Wellness Survey, a survey of Japanese adults, were analyzed (N=30,000). All respondents provided informed consent, and the protocol was institutional review board-approved. Respondents who reported experiencing LBP were propensity score–matched to those without LBP, based on demographics and health history. Using regression modeling, patients with mild, moderate, and severe pain were compared against matched controls, with respect to health status (Mental and Physical Component Summary scores, and health utilities from the Short Form®-36 Health Survey version 2), work productivity (Work Productivity and Activity Impairment – General Health version), health care resource use, and annual per-patient costs (estimated using published annual wages and resource use event costs).
Results: A total 1,897 patients reported experiencing LBP in the past month (6.32%); 52.45% reported their pain as mild, 32.79% as moderate, and 14.76% as severe. Increasing pain severity was associated with significantly lower levels of mental component scores (46.99 [mild], 42.93 [moderate], and 40.58 [severe] vs 48.10 [matched controls]), physical component scores (50.29 [mild], 46.74 [moderate], and 43.94 [severe] vs 52.93 [matched controls]), and health utilities (0.72 [mild], 0.66 [moderate], and 0.62 [severe] vs 0.76 [matched controls]) (all P<0.05). Indirect costs were significantly higher (P<0.05) among those with moderate (¥1.69 million [MM] [equivalent to $17,000, based on United States dollar exchange rates on September 1, 2014]) and severe (¥1.88 MM [$19,000]) pain, relative to matched controls (¥0.95 MM [$9,500]). Direct costs were only marginally different (P=0.05) between those with severe pain and matched controls (¥1.33 MM [$13,000] vs ¥0.54 MM [$5,000]).
Conclusion: Increasing pain severity among respondents with LBP was associated with significantly worse health status, to a clinically-relevant degree, along with greater indirect and direct costs, in Japan.
Keywords: low back pain, pain severity, quality of life, cost
Introduction
According to the Global Burden of Disease study, lower back pain (LBP) is the leading global cause of disability.1–3 LBP is also among the most common sources of pain,4 affecting between 12% (point prevalence) and 40% (lifetime prevalence) of the global population, depending upon the time frame assessed.5 Research in the United States has found that that its presence is associated with significant decrements in quality of life and functioning, and increased levels of work-related impairment, health care resource-use, and societal costs.6,7 Indeed, indirect costs for those with chronic LBP in the workforce were reported to be between $7,000 and $25,000 per employee per year, depending upon the level of pain severity.6 A claims analysis by Gore et al estimated direct medical costs of chronic LBP at over $8,000 per patient per year, more than twice that of matched controls.8
Studies in Japan have reported similar findings. Research has suggested that the point prevalence of LBP is between 20% and 25% of the adult population,9 with approximately half of those who experience LBP reporting it as their primary source of pain.10 Research has also demonstrated the association between the presence of LBP and patient outcomes. A survey study by Suka and Yoshida administered the EuroQoL-5D (EQ™-5D) to assess quality of life of respondents across five health care centers in Japan.11 The results suggested a significant burden of LBP as patients with LBP (with and without daily activity impairment) reported significantly worse quality of life than “no pain” controls, for both men and women.11
Similarly, a number of studies have shown the effect of LBP on the level of impairment in daily activities. As reported by Suka and Yoshida, 18% of daily activities were impaired because of LBP, after adjusting for age and sex.10
Although these studies examined the burden of LBP in Japan, no previous study, to our knowledge, stratified quality of life and economic outcomes by the degree of pain severity, in Japan.
Characterizing the level of LBP severity and its association with patient outcomes can better inform the development and evaluation of future management strategies. As suggested by studies in the West, LBP severity can potentially explain significant variation in patient outcomes.7,8 The objectives of this study was to further contribute to the literature of the burden of LBP in Japan by examining the cross-sectional association between pain severity and various health outcomes, including health status, work productivity, impairment in daily activities, health care resource use, societal costs, and sleep impairment.
Methods
Data source
The data source for this study was the 2013 Japan National Health and Wellness Survey (NHWS) (N=30,000). The NHWS is a self-administered, Internet-based questionnaire distributed to a nationwide sample of adults (aged 18 years or older). Potential respondents for this study were identified through the Lightspeed Research (LSR) general panel. Panel members explicitly agreed to join the LSR panel and receive periodic invitations to participate in online surveys (not just health-related). Members of the panel were recruited through a variety of means, including coregistration with other Internet panels, e-newsletter campaigns, and banner placements among other channels. The recruitment of panel members is not conducted strictly by convenience – an attempt is made to approximate the distribution of the adult population in the country of interest. For example, in Japan, the sex (52% vs 49% female in the adult population and panel, respectively) and annual income (eg, 32% vs 31% below ¥4 million [MM] in the population and panel, respectively) distributions are nearly identical. Similarly, the regional distribution of the adult Japanese population and of the panel is within 2% of one another, with the exception of Kanto (which comprises 32% of the adult population but 43% of the panel).12
Members of the LSR panel were invited to complete the NHWS through a randomly stratified sampling method, to further ensure the final composition of the NHWS sample matched that of the adult Japanese population. Specifically, the International data base of the United States Census was used to calculate the proportion of the population in each age and sex stratum.13 Members of the LSR panel were recruited in this way to match these characteristics. As reported in an article by Liu et al, even though the stratified sample did not account for other demographic factors, such as income, education, or region, the NHWS sample was generally comparable with the population, with respect to these characteristics.14 A total of 607,712 invitations were sent (response rate =4.94%). The survey received Institutional Review Board approval (Essex Institutional Review Board, Inc., Lebanon, NJ, USA), and all respondents provided informed consent prior to participating.
Sample
All respondents of the 2013 Japan NHWS were included in the analysis (N=30,000).
Measures
LBP
All respondents were asked whether or not they had experienced pain in the past year. Those who answered affirmatively were then asked whether they had experienced pain in the past month. Those who again answered affirmatively were then presented with a list of different types of pain (eg, LBP, headache, joint, surgery/medical procedure-related, etc). Respondents who reported “lower back pain” as the source of their pain were considered to have LBP. All others were considered not to have LBP (ie, “controls”). Respondents were not asked to list their primary pain.
Pain severity
The primary predictor was pain severity, which was measured in the form of a numeric rating scale of pain in the last week (0–10). This continuous measure of pain severity was categorized into mild (scores 0–3), moderate (scores 4–6), or severe (scores 7–10) pain categories. Control respondents (ie, those without LBP) were automatically assigned a category of “none”.
Demographics
Age (entered continuously), education (coded as university degree vs all else), household income (coded as <¥3 MM; ¥3 MM to <¥5 MM; ¥5 MM to <¥8 MM; ¥8 MM or more; or decline to answer), and health insurance (national health insurance, social insurance, late-stage elderly insurance, other, or no insurance) was assessed for all respondents.
Health history
Smoking habits (coded as current, former, or never smoker), exercise behavior (the number of days exercised in the past month as reported directly by the respondents), alcohol use (measured by the frequency of alcohol use, from daily to never, though coded as currently consumes alcohol vs abstains), body mass index (BMI) category (coded, based on the World Health Organization recommendation for Asian populations, as: underweight [<18.5 kg/m2], acceptable risk [18.5 to <23 kg/m2], increased risk [23 to <27.5 kg/m2], high risk [≥27.5 kg/m2], or decline to provide weight),15 and the Charlson Comorbidity Index (CCI; a measure of comorbidity burden)16 were also included.
Sleep difficulties
All respondents in the NHWS were asked: “Thinking of the sleeplessness or difficulty sleeping that you experience, which of the following sleep problems or symptoms do you regularly experience? Please select all that apply”. Respondents then selected the applicable symptoms from a set list. For the purposes of this study, the presence (or absence) of “difficulty falling asleep”, “waking during the night and not being able to get back to sleep”, “waking up several times during the night”, and “poor quality of sleep” were used as outcomes of pain severity as they most closely reflect the insomnia domains of the Diagnostic and Statistical Manual of Mental Disorders, Fifth Edition (DSM-V):sleep onset symptoms, sleep maintenance symptoms, and restorative sleep.17 Each of these symptoms were examined individually, and a total sleep difficulties variable was also created; all respondents with at least one symptom were assigned to the “sleep difficulties” group, and the remaining respondents were considered not to have sleep difficulties.
Health outcomes
Health status was assessed using the Physical Component Summary (PCS) and Mental Component Summary scores of the Short Form®-36 Health Survey version 2 (SF-36v2™), along with the eight domain scores: Bodily Pain, Physical Functioning, Physical Role Limitations, General Health, Vitality, Social Functioning, Emotional Role Limitations, and Mental Health.18,19 Health utility scores (SF-6D), derived from the SF-36v2, were also included. Work productivity and impairment was assessed using the Work Productivity and Activity Impairment – General Health (WPAI-GH) questionnaire.20 Four subscales (absenteeism [the percentage of time missed from work], presenteeism [the percentage of impairment experienced while at work], overall work impairment [the combination of absenteeism and presenteeism], and activity impairment [the percentage of impairment in daily activities]) are generated from the WPAI-GH in the form of percentages, with higher values indicating greater impairment due to the patient’s health. Only respondents currently employed (full-time, part-time, or self-employed) provided data with respect to absenteeism, presenteeism, and overall work impairment. Health care utilization was defined by the number of health care providers seen in the past 6 months, the number of emergency room (ER) visits, and the number of times hospitalized in the past 6 months.
Cost variables
Indirect and direct costs were estimated from the available NHWS data. Annual indirect costs were calculated by integrating information, from the WPAI-GH, and hourly wage rates, from the Japan Basic Survey on Wage Structure, 2011, using the Lofland method.21,22 For each employed respondent, his or her annual wage was estimated based on median weekly rates (provided by demographic strata) multiplied by the number of work weeks in a year. Direct costs were estimated by multiplying the number of physician visits and hospitalizations by two (to estimate annual number of visits) and then multiplied by the corresponding unit cost for each, which was obtained from Japan’s Ministry of Health, Labour and Welfare (ER visits were not included in the cost calculations as with the exception of the use of an ambulance, which was not asked of our respondents, these are associated with trivial independent costs in Japan).23 In the case of hospitalizations, only a cost per day was obtained from the Ministry of Health, Labour and Welfare, while the NHWS asked respondents for the number of hospitalizations. To align them, we multiplied the cost per day by the average number of days per hospitalization as reported by the Organisation for Economic Cooperation and Development.24 All costs figures were provided in Japanese yen with a conversion to the United States dollar, based on the exchange rate (¥104 per $1) as of September 1, 2014.
Statistical analyses
Identifying a matched control group
To minimize a sample size imbalance between pain severity groups and controls (ie, those without LBP), which would have overpowered our statistical findings, a propensity score matching process was used to identify a group without LBP that closely resembled those with LBP. To do so, patients with LBP (regardless of severity) were compared with patients without LBP with respect to sociodemographic (as described above) and health history variables (as described above) using chi-square analyses and one-way analysis of variance models. Variables that differed between groups at a level of P<0.25 were then entered into a logistic regression to predict pain presence (ie, LBP vs no LBP). Propensity score values from this model were saved and then used as the basis for matching each LBP patient with a respondent without LBP whose propensity score value was identical, using a “greedy matching” algorithm.25 Matched respondents were then considered a “no LBP”-matched control group; respondents who were not matched were removed from further analyses.
Patients with mild, moderate, and severe pain were compared with matched no LBP controls with respect to sociodemographics and health history variables, using chi-square analyses and one-way analysis of variance models. Variables that differed at P<0.25 were considered covariates and were included in subsequent regression models. This included age, sex, education, annual household income, BMI category, exercise behavior, smoking habits, alcohol consumption, and the CCI. We included these covariates because even though the overall LBP group and the matched control group may not have differed with respect to these variables, there was significant variability across severity. Therefore, to rule out alternative explanations (eg, whether differences in outcomes were due to the CCI as opposed to increasing severity), we utilized this second-stage regression approach after the propensity score matching.
Pain severity categories (none, mild, moderate, and severe) were then used as the primary nominal predictor of health outcomes, using generalized linear models, holding the identified covariates constant. The “none” category (ie, matched no LBP controls) served as the reference category. Normal distributions with identity link functions were used for predicting health status; negative binomial distributions with log link functions were used for predicting work productivity loss, and health care resource use and costs; and binomial distributions with logit functions were used for predicting the presence of sleep symptoms. Adjusted means for all outcomes were calculated by severity level, using a maximum likelihood algorithm, and were reported on their original metric by level of severity. All analyses were conducted in SAS 9.3.
Results
A total of N=1,898 respondents reported experiencing LBP (6.33%); 28,102 respondents reported no LBP in the past month and were considered no LBP controls. Of those who reported LBP, 52.48% reported their pain as mild, 32.77% as moderate, and 14.75% as severe. Compared with the no LBP controls (prior to matching), respondents with LBP were significantly older and more likely to be of lower socioeconomic status (ie, lower education and household income) (Table 1) (all P<0.05). With respect to health characteristics, respondents with LBP were significantly more likely to be at high-risk BMI levels, were more likely to have smoked, and had a greater comorbidity burden as measured by the CCI, compared with those without LBP (all P<0.05). Focusing just on those with LBP, increasing severity was associated with an increased probability of being female, lower socioeconomic status, high-risk BMI levels, not exercising, and smoking (all P<0.05).
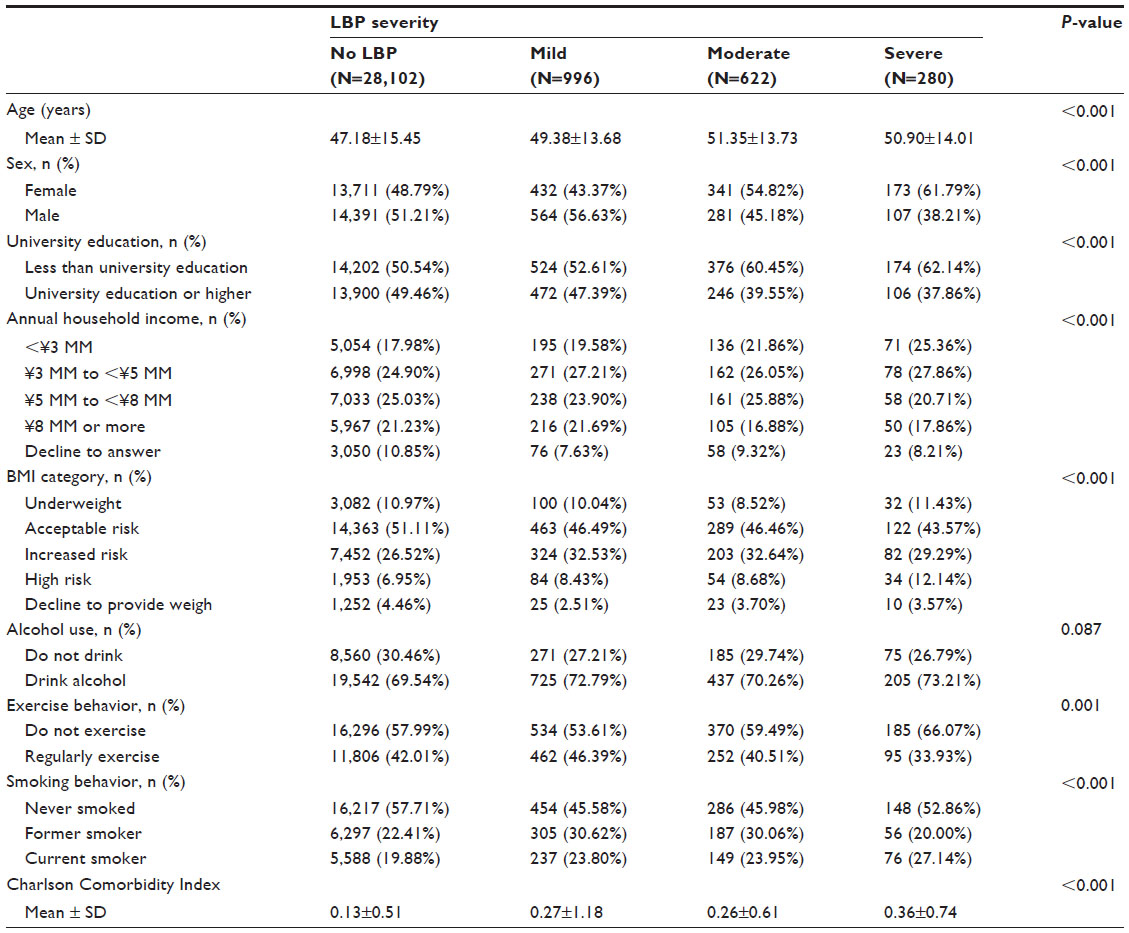 | Table 1 Demographic and health characteristic differences among those with LBP and varying pain severity, and those without LBP |
A matched no LBP control group was identified from those without LBP, using a propensity score matching approach (as described above). Each respondent with LBP was paired with a suitable no LBP respondent, based on their demographic and health history characteristics. One LBP respondent had a sufficiently extreme pattern of demographic and health history characteristics that no suitable control was found. Therefore, the remaining analyses focused on the N=1,897 respondents who reported LBP, and the matched no LBP control group of N=1,897 (Table 2).
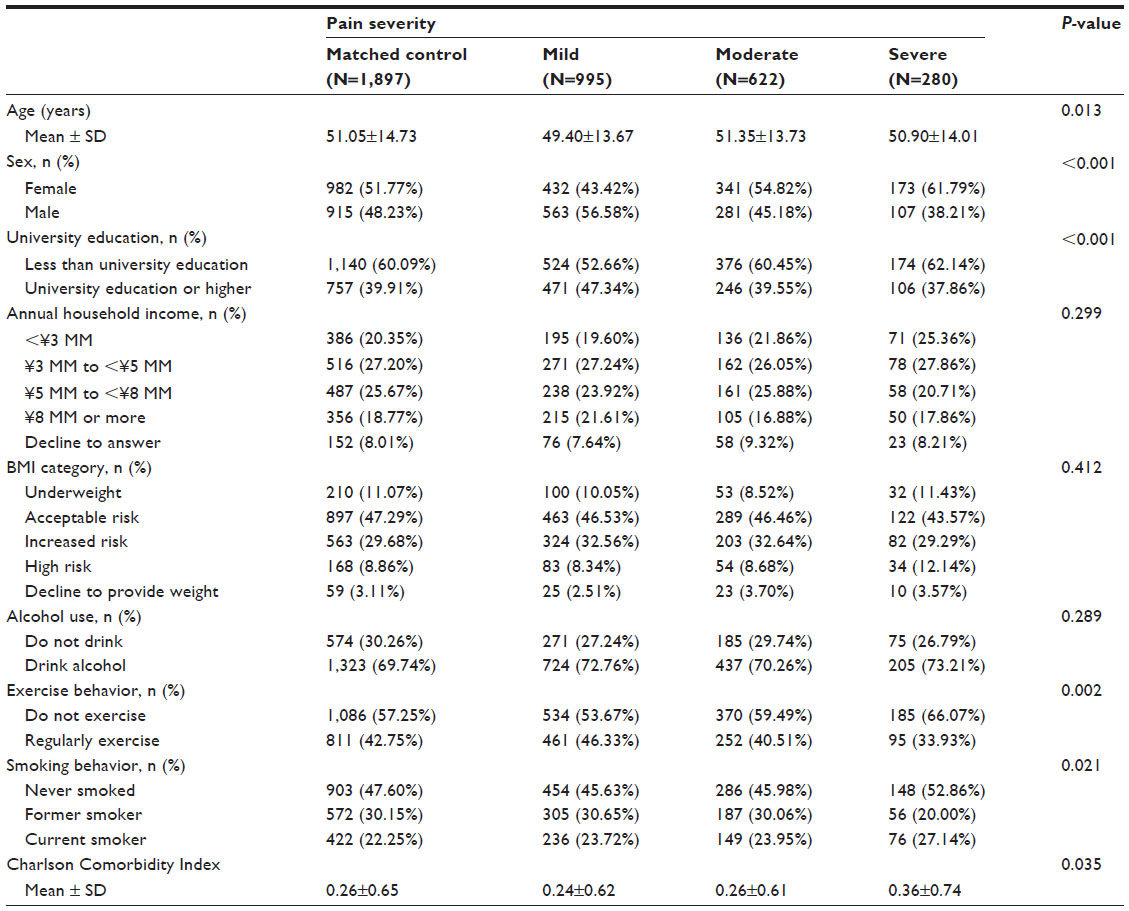 | Table 2 Demographic and health characteristic differences among those with LBP and varying pain severity, and matched control respondents without LBP |
The pain characteristics of respondents with LBP are reported in Table 3. Frequency of pain was highly associated with its severity; for example, only 17.59% of patients with mild pain reported daily pain compared with 37.94% of those with moderate pain and 63.21% of those with severe pain (P<0.05). Prescription medication use was uncommon overall (only 20% of all LBP respondents used a prescription treatment), whether in isolation or in combination with an over-the-counter treatment), though rates of use increased significantly by severity (from 10.05% to 40.71% in patients with mild to severe pain, respectively) (P<0.05). Opioid use was extremely uncommon but also increased by level of severity (0.40% to 2.86%) (P<0.05).
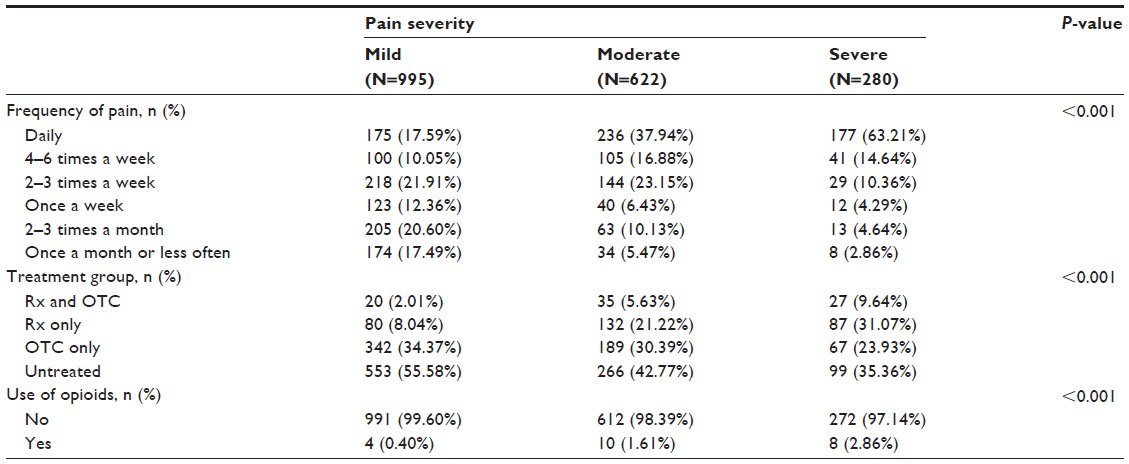 | Table 3 Pain history among those with LBP |
Prior to covariate adjustment, levels of health status for respondents with LBP were significantly worse than for matched no LBP controls and decreased concomitantly with increasing severity (Table 4). Similarly, levels of work impairment, activity impairment, and health care provider visits were also significantly higher than in matched controls and increased along with severity (all P<0.05). No significant differences were observed in terms of the number of ER visits or hospitalizations in the past 6 months.
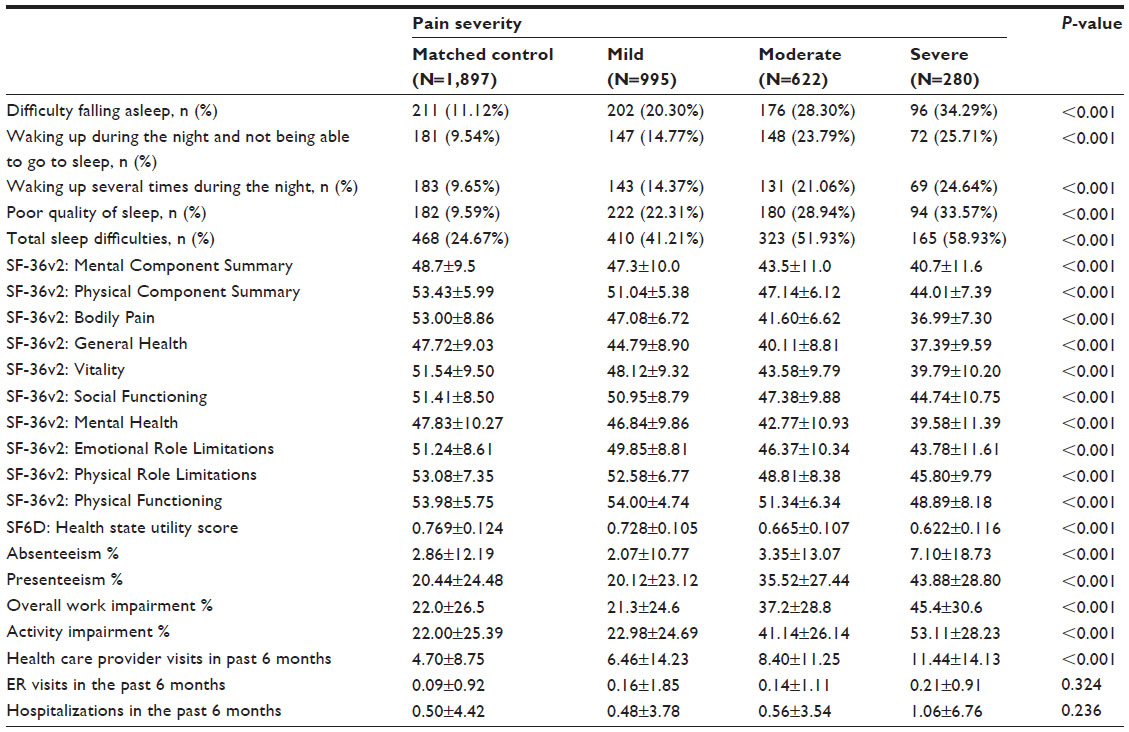 | Table 4 Health outcomes differences among those with LBP and varying pain severity, and matched control respondents without LBP |
Adjusting for relevant demographic and health history variables, significant decrements in health status were observed for both SF-36v2 summary scores and health utilities when comparing those with varying levels of pain severity and matched no LBP controls (Table 5). Specifically, PCS levels decreased from 48.10 (no LBP) to 46.99 (mild), to 42.93 (moderate), and to 40.58 (severe), and PCS levels decreased from 52.93 (no LBP) to 50.29 (mild), to 46.74 (moderate), and to 43.94 (severe) (all severity groups significantly lower than matched controls) (P<0.05). Respondents with moderate and severe pain also reported significantly worse domain scores than did matched no LBP controls (all P<0.05). Although patients with mild pain generally reported significantly lower domain scores as well, no statistically significant differences were observed with respect to Social Functioning, Mental Health, and Physical Functioning domain scores.
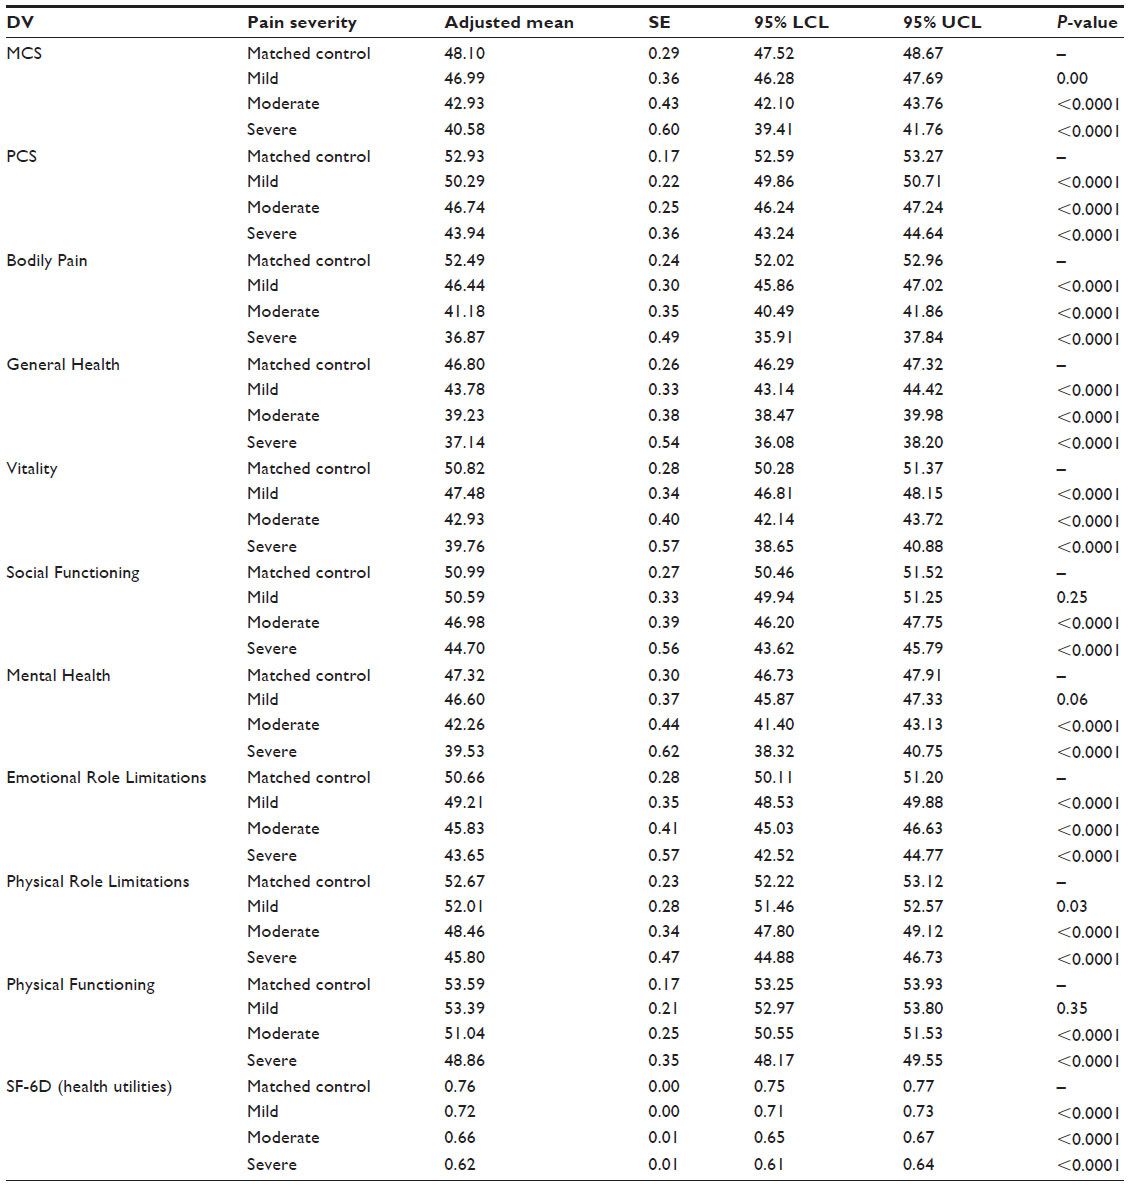 | Table 5 Adjusted means of SF-36v2™ component summary and domain scores by level of pain severity |
Among those employed, moderate and severe pain was associated with significantly higher levels of presenteeism (36.99% and 43.85%, respectively) and overall work impairment (38.48% and 45.13%, respectively) compared with matched no LBP controls (20.48% and 21.98% for presenteeism and overall work impairment, respectively) (all P<0.05) (Table 6). No effect of pain severity was observed for absenteeism, and LBP respondents with mild pain did not significantly differ from matched no LBP controls. Levels of impairment in daily activities were significantly higher among those with moderate (42.41%) and severe pain (52.00%) compared with matched no LBP controls (22.15%) (all P<0.05); again, no differences were observed between patients with mild pain and matched no LBP controls. Finally, indirect costs, calculated from observed overall work impairment rates and estimated annual incomes, were significantly higher for those with moderate (¥1.69 MM [approximately $17,000]) and severe (¥1.88 MM [approximately $19,000]) pain compared with matched no LBP controls (¥950,243 [approximately $9,500]) (all P<0.05).
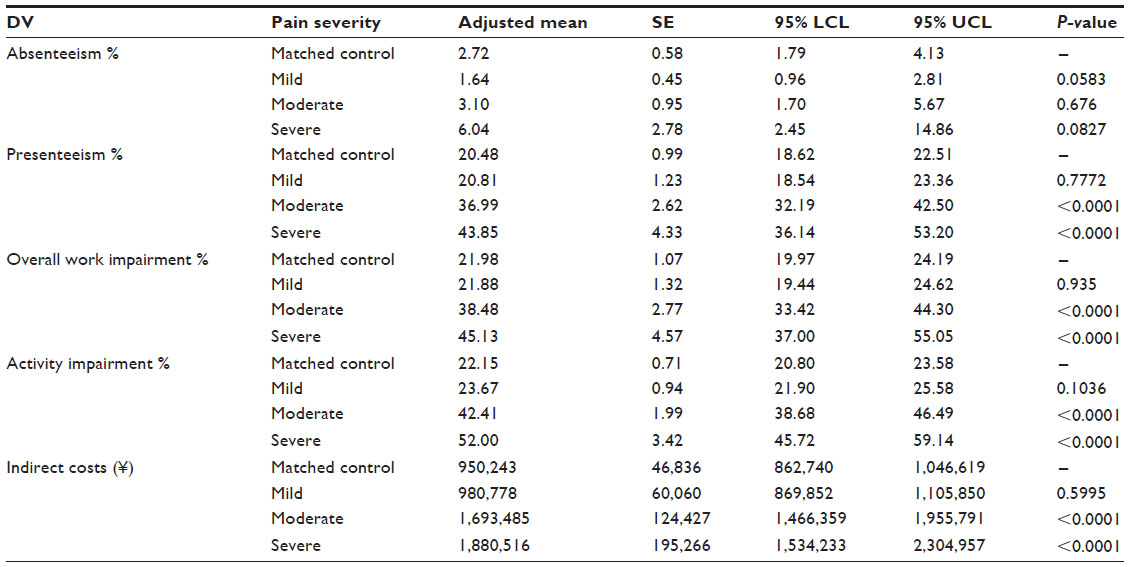 | Table 6 Adjusted means of the probability of employment and work productivity and activity impairment, by level of pain severity |
With respect to health care resource use visits, the number of physician visits in the past 6 months increased concomitantly with severity, relative to matched controls (4.05 [matched no LBP control], 5.94 [mild], 8.12 [moderate], and 10.16 [severe]) (all groups P<0.05). (Table 7). Only patients with severe pain reported significantly more ER visits (0.33 vs 0.10) (P<0.05) in the past 6 months and annualized direct costs (P<0.05) than did the matched no LBP controls. No differences in the number of hospitalizations in the past 6 months were observed. Similarly, no differences in total direct costs were observed, though those for patients with severe pain were marginally higher than those for patients with no LBP (¥1.33 MM [approximately $13,000] vs ¥0.54 MM [approximately $5,000]) (P=0.05).
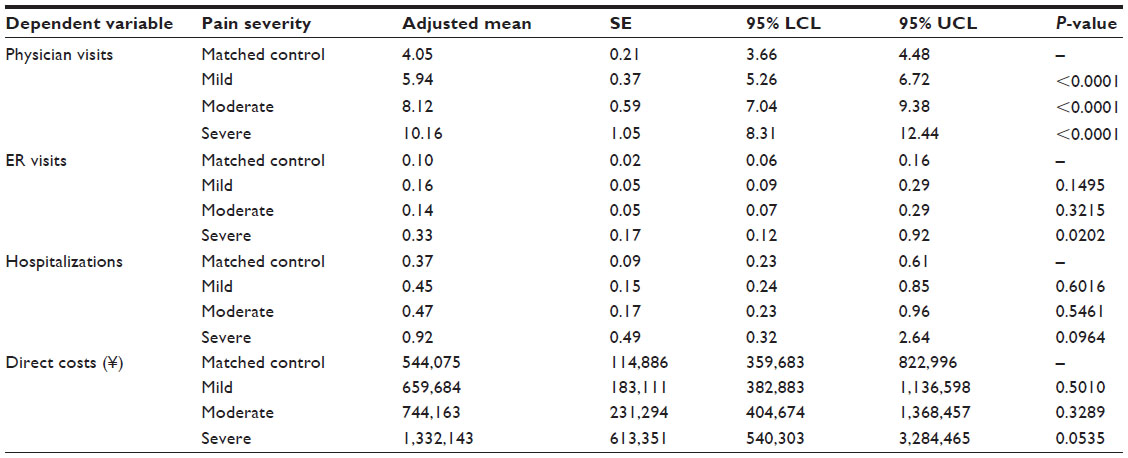 | Table 7 Adjusted means of health care resource use visits and direct costs in the past 6 months, by level of pain severity |
Finally, a significant association between pain severity and sleep difficulties was observed. For each sleep symptom assessed, the adjusted probability of experiencing that symptom increased along with severity. Compared with matched no LBP controls (23%), the adjusted percentage of experiencing any of the assessed symptoms was significantly higher among those with mild (40%), moderate (51%), and severe (56%) pain (all P<0.05) (Table 8).
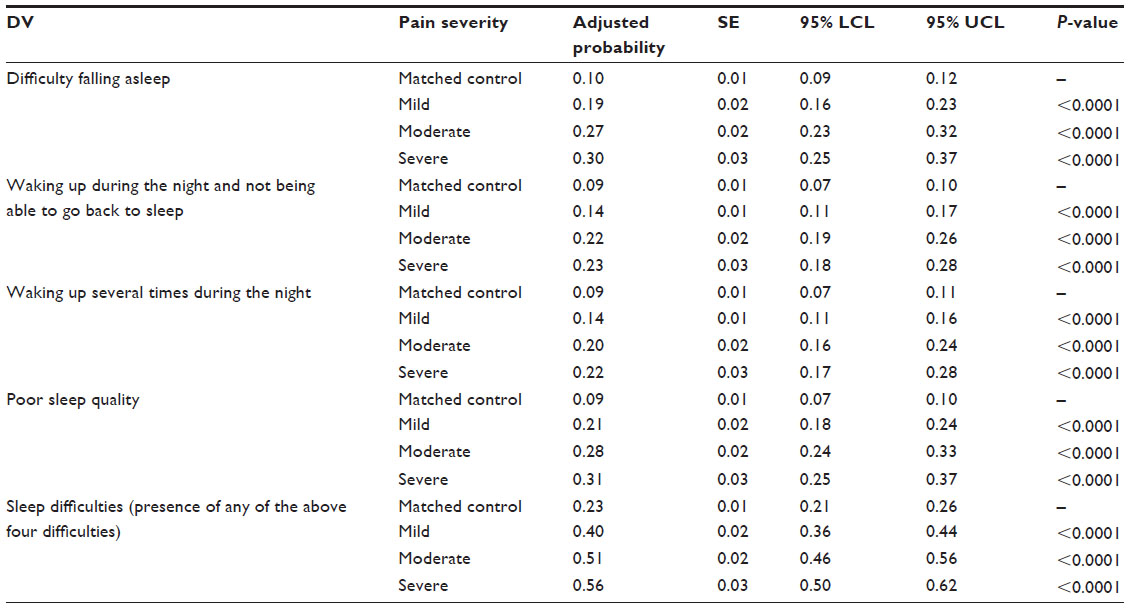 | Table 8 Adjusted probabilities of having sleep difficulties, by level of pain severity |
Discussion
Although prior studies in Japan have examined the association between LBP and patient outcomes,9–11 the stratification by severity is a notable advancement. Our results suggest that all forms of LBP are not equal; indeed, the greatest decrement in health status was observed for those with moderate and severe pain, among whom each group had both significant and clinically relevant decrements in health status relative to matched no LBP controls. Although physically debilitating, as would be expected, pain was also associated with significant and clinically significant decrements in mental health status.
We also found that LBP was associated with an increased probability of experiencing sleep difficulties and that this probability increased along with pain severity. Although not previously reported in Japan, to our knowledge, the relationship between pain and sleep has been observed in other studies in the United States and Europe.8,26–28 These results reinforce the broader effect pain has on the patient.
LBP was not significantly associated with greater rates of absenteeism, but moderate-to-severe pain was associated with greater rates of presenteeism and subsequently, overall work impairment and indirect costs. These findings are consistent with those observed in the West, where it has been found that pain tended to disproportionately affect presenteeism more than absenteeism.6 Mild pain was comparable with matched no LBP controls, in terms of work impairment and indirect costs.
Increasing severity was associated with an increased number of physician visits, though no differences (with the exception of the comparison between patients with severe pain and matched no LBP controls, in terms of ER visits) were observed on other health care resource utilization events. Only patients with severe pain had marginally higher estimated direct costs than did matched no LBP controls. This is a weaker pattern than that observed in the United States,7 although beyond fundamental cultural and health care system differences, there were also differences in method (eg, claims analysis vs patient-reported) that may account for the discrepancy.
Overall, the stratification by severity in the current study provides a useful extension of the literature. These results suggest that the severity of LBP pain may dictate the manifestation of its effects. For example, patients presenting with mild pain may have an impact on their quality of life, but the effects on their ability to work may be less perceptible. In contrast, patients presenting with moderate-to-severe are likely to have effects on both their quality of life and work productivity. Additionally, from a patient-outcomes perspective, there appears to be substantially more to gain by alleviating the pain experienced for those in the moderate-to-severe category.
Another implication of this study is a call for improved management among patients with LBP in Japan. Despite the severity and frequency of pain reported by patients, and the poor outcomes observed, the majority of patients were not being prescribed a treatment for their pain. As this study was not intended to assess treatment effectiveness or reasons for lack of treatment, more studies are needed to better understand the lack of sufficient management of pain in Japan and to potentially address this through, among other things, additional education for patients.
Limitations
Although the NHWS was not designed to assess the prevalence of LBP, the prevalence of LBP in our study was noticeably lower than that reported in the literature (10%–20% or more, vs 6% in our study).5,9 We attribute this largely to method differences. Due to the Internet survey method, patients with debilitating LBP were likely underrepresented as the severity of their condition might have prevented them from being able to join an Internet panel and complete survey studies. Also, the NHWS uses a series of questions to assess LBP (“Have you experienced pain in the past 12 months?”, “Have you experienced pain in the past month?”, “What type of pain?” with approximately 20 possible selections). It is possible we ended up excluding more patients by asking several incrementally leading questions prior to asking about LBP, compared with other surveys that asked about LBP directly.
This study was entirely patient-reported, and no confirmation of diagnosis, treatment usage, or health care resource utilization was available. This study also focused exclusively on LBP only, and relevant subgroups (such as chronic LBP) could not be examined due to lack of sufficient sample size. The NHWS is cross-sectional, and therefore a causal relationship between pain severity and health outcomes cannot be established. Related to this point, we identified as many confounding variables as possible, but other variables not assessed may have contributed. The cross-sectional nature of the survey also prevented us from fully exploring potential mediating relationships. For example, it is possible that LBP could have contributed to a lack of exercise and an increased BMI (among other things), which in turn could have affected health outcomes. By controlling for these factors (as we did), we may have underestimated the effect of LBP since we ignored these indirect pathways. This should be further explored in future studies. Our analytical approach also assumed independence between LBP and matched controls; the significance testing would have been affected (ie, more liberal) had we chosen to assume these groups were dependent.
It also should be noted that there are many dimensions to the experience of pain (eg, frequency and intensity). We asked patients directly to report their severity, but it was unclear which specific dimensions of pain led to their responses. As a final limitation, the NHWS is broadly representative of the adult Japanese population with respect to key demographic characteristics; however, there may be other differences (eg, comorbidity profile, health care attitudes, etc) that may limit the generalizability of the findings. For example, those without Internet access and disenfranchised groups would be underrepresented.
Conclusion
Worldwide, LBP represents one of the most common and one of the most debilitating forms of pain. Although studies from Japan have found an effect of LBP on health outcomes, no previous study, to our knowledge, stratified the various outcomes by the level of pain severity. Our results suggest an increasing burden on the patient and society as severity increases, particularly for moderate-to-severe pain.
Disclosure
The data source for this study, the National Health and Wellness Survey (NHWS), was a survey conducted by Kantar Health. Pfizer, Inc. purchased access to the NHWS data and funded the analysis and preparation of this manuscript. Kantar Health acted as a paid consultant group to Pfizer in connection with the development of this manuscript.
Dr DiBonaventura is an employee of Kantar Health. Drs Sadosky, Cappelleri, and Fujii, and Ms Ebata were employed by Pfizer Inc. at the time of the study. The authors report no other conflicts of interest.
No off-label or investigational use is discussed in this paper.
References
Buchbinder R, Blyth FM, March LM, Brooks P, Woolf AD, Hoy DG. Placing the global burden of low back pain in context. Best Pract Res Clin Rheumatol. 2013;27(5):575–589. | |
Vos T, Flaxman AD, Naghavi M, et al. Years lived with disability (YLDs) for 1160 sequelae of 289 diseases and injuries 1990–2010: a systematic analysis for the Global Burden of Disease Study 2010. Lancet. 2012;380(9859):2163–2196. | |
Murray CJ, Vos T, Lozano R. Disability-adjusted life years (DALYs) for 291 diseases and injuries in 21 regions, 1990–2010: a systematic analysis for the Global Burden of Disease Study 2010. Lancet. 2012; 380(9859):2197–2223. | |
van Tulder M, Koes B, Bombardier C. Low back pain. Best Pract Res Clin Rheumatol. 2002;16(5):761–775. | |
Hoy D, Bain C, Williams G, et al. A systematic review of the global prevalence of low back pain. Arthritis Rheum. 2012;64(6):2028–2037. | |
Sadosky AB, Taylor-Stokes G, Lobosco S, Pike J, Ross E. Relationship between self-reported low-back pain severity and other patient-reported outcomes: results from an observational study. J Spinal Disord Tech. 2013;26(1):8–14. | |
McDonald M, DiBonaventura Md, Ullman S. Musculoskeletal pain in the workforce: the effects of back, arthritis, and fibromyalgia pain on quality of life and work productivity. J Occup Environ Med. 2011;53(7):765–770. | |
Gore M, Sadosky A, Stacey BR, Tai KS, Leslie D. The burden of chronic low back pain: clinical comorbidities, treatment patterns, and health care costs in usual care settings. Spine (Phila Pa 1976). 2012;37(11):E668–E677. | |
Yamada K, Matsudaira K, Takeshita K, Oka H, Hara N, Takagi Y. Prevalence of low back pain as the primary pain site and factors associated with low health-related quality of life in a large Japanese population: a pain-associated cross-sectional epidemiological survey. Mod Rheumatol. 2014;24(2):343–348. | |
Suka M, Yoshida K. Musculoskeletal pain in Japan: prevalence and interference with daily activities. Mod Rheumatol. 2005;15(1):41–47. | |
Suka M, Yoshida K. Low back pain deprives the Japanese adult population of their quality of life: a questionnaire survey at five healthcare facilities in Japan. Environ Health Prev Med. 2008;13(2):109–115. | |
Lightspeed Research. Lightspeed Research Panel Book. Warren, NJ: Lightspeed Research; 2011. | |
census.gov [homepage on the Internet]. International data base. United States Census Bureau; 2013 [updated Dec 2013; cited September 30, 2014]. Available from: http://www.census.gov/population/international/data/idb/informationGateway.php. Accessed December 19, 2014. | |
Liu GG, DiBonaventura Md, Yuan Y, et al. The burden of illness for patients with viral hepatitis C: evidence from a national survey in Japan. Value Health. 2012;15(1 Suppl):S65–S71. | |
WHO Expert Consultation. Appropriate body-mass index for Asian populations and its implications for policy and intervention strategies. Lancet. 2004;363(9403):157–163. | |
Charlson ME, Pompei P, Ales KL, MacKenzie CR. A new method of classifying prognostic comorbidity in longitudinal studies: development and validation. J Chronic Dis. 1987;40(5):373–383. | |
American Psychiatric Association. Diagnostic and Statistical Manual of Mental Disorders, Fifth Edition (DSM-5). Washington, DC: American Psychiatric Association; 2013. | |
Fukuhara S, Bito S, Green J, Hsiao A, Kurokawa K. Translation, adaptation, and validation of the SF-36 Health Survey for use in Japan. J Clin Epidemiol. 1998;51(11):1037–1044. | |
Fukuhara S, Ware JE, Kosinski M, Wada S, Gandek B. Psychometric and clinical tests of validity of the Japanese SF-36 Health Survey. J Clin Epidemiol. 1998;51(11):1045–1053. | |
Reilly MC, Zbrozek AS, Dukes EM. The validity and reproducibility of a work productivity and activity impairment instrument. Pharmacoeconomics. 1993;4(5):353–365. | |
Lofland JH, Pizzi L, Frick KD. A review of health-related workplace productivity loss instruments. Pharmacoeconomics. 2004;22(3):165–184. | |
Economic and Social Research Institute. [Effect analysis of outpatient visits optimization measures in the medical insurance system]. Tokyo: Economic and Social Research Institute; 2003. Available from: http://www.esri.go.jp/jp/archive/tyou/tyou002/tyou002a.pdf. Accessed September 3, 2014. [Japanese]. | |
Ministry of Health, Labour and Welfare. [2013 Fiscal Year Trends of Medical Expenses]. Tokyo: Ministry of Health, Labour and Welfare; 2014. Available from: http://www.mhlw.go.jp/topics/medias/year/13/dl/iryouhi_data.pdf. Accessed September 3, 2014. Japanese. | |
oecd-ilibrary.org [homepage on the Internet]. Health at a glance 2011: OECD indicators: Average length of stay in hospital. Organisation for Economic Cooperation and Development (OECD); 2011 [cited September 30, 2014]. Available from: http://www.oecd-ilibrary.org/sites/health_glance-2011-en/04/05/index.html?itemId=/content/chapter/health_glance-2011-33-en&_csp_=7437a3773df7eb771d0f1145cc7940bf. Accessed December 19, 2014. | |
Parsons LS. Reducing bias in a propensity score matched-pair sample using greedy matching techniques. 2001. Poster presented at: SAS Users Group International; April 22–25; 2001; Long Beach, CA. | |
van de Water AT, Eadie J, Hurley DA. Investigation of sleep disturbance in chronic low back pain: an age- and gender-matched case-control study over a 7-night period. Man Ther. 2011;16(6):550–556. | |
O’Donoghue GM, Fox N, Heneghan C, Hurley DA. Objective and subjective assessment of sleep in chronic low back pain patients compared with healthy age and gender matched controls: a pilot study. BMC Musculoskelet Disord. 2009;10:122. | |
Langley PC, Ruiz-Iban MA, Molina JT, De Andres J, CastellÓn JR. The prevalence, correlates and treatment of pain in Spain. J Med Econ. 2011;14(3):367–380. |
 © 2015 The Author(s). This work is published and licensed by Dove Medical Press Limited. The
full terms of this license are available at https://www.dovepress.com/terms
and incorporate the Creative Commons Attribution
- Non Commercial (unported, 3.0) License.
By accessing the work you hereby accept the Terms. Non-commercial uses of the work are permitted
without any further permission from Dove Medical Press Limited, provided the work is properly
attributed. For permission for commercial use of this work, please see paragraphs 4.2 and 5 of our Terms.
© 2015 The Author(s). This work is published and licensed by Dove Medical Press Limited. The
full terms of this license are available at https://www.dovepress.com/terms
and incorporate the Creative Commons Attribution
- Non Commercial (unported, 3.0) License.
By accessing the work you hereby accept the Terms. Non-commercial uses of the work are permitted
without any further permission from Dove Medical Press Limited, provided the work is properly
attributed. For permission for commercial use of this work, please see paragraphs 4.2 and 5 of our Terms.