Back to Journals » Neuropsychiatric Disease and Treatment » Volume 15
The association between cortisol:C-reactive protein ratio and depressive fatigue is a function of CRP rather than cortisol
Authors Sharpley CF ![]() , Bitsika V, McMillan ME
, Bitsika V, McMillan ME ![]() , Jesulola E
, Jesulola E ![]() , Agnew LL
, Agnew LL ![]()
Received 29 April 2019
Accepted for publication 29 July 2019
Published 27 August 2019 Volume 2019:15 Pages 2467—2475
DOI https://doi.org/10.2147/NDT.S213839
Checked for plagiarism Yes
Review by Single anonymous peer review
Peer reviewer comments 2
Editor who approved publication: Dr Yu-Ping Ning
Christopher F Sharpley,1 Vicki Bitsika,1 Mary E McMillan,1 Emmanuel Jesulola,2 Linda L Agnew1
1Brain-Behaviour Research Group, University of New England, Armidale, NSW 2351, Australia; 2Emergency Department, Bathurst Base Hospital, Bathurst, NSW 2795, Australia
Correspondence: Christopher F Sharpley
Brain-Behaviour Research Group, University of New England, Queen Elizabeth Drive, Armidale, NSW 2350, Australia
Tel +61 26 773 2596
Email [email protected]
Purpose: Hormonal and inflammatory factors have been suggested as potentially influencing depressive state and depressive symptoms, but rarely compared for their relative contribution to these states and to specific depressive symptoms. This study examined cortisol:C-reactive protein (CRP) ratio, plus cortisol and CRP separately, as correlates of global depression and fatigue-related depression.
Patients and methods: One hundred and twenty-six community volunteers from rural Australia provided saliva and serum samples, and also completed a depression inventory.
Results: There was a significant correlation between cortisol:CRP ratio and depression-related fatigue, and this resolved to the effects of CRP rather than cortisol. Most of the variance in this association came from patients who were “depressed”, and there were no significant gender associations.
Conclusion: Inflammation, rather than HPA-axis activity, was associated with depression-related fatigue, supporting a model that places inflammation as a contributor to one of the major symptoms and predictors of depression. Individualization of therapy for depression-related fatigue in chronically stressed or physically ill patients might benefit from future research into cytokine therapy.
Keywords: depression, fatigue, CRP, cortisol
Depression is the leading cause of ill health and disability worldwide, and costs US$1 trillion globally each year from losses to households, employers and governments.1 People with depression have a relative risk of mortality from all causes that is 1.86 times that for non-depressed individuals, and 2.74 million people die each year from depression.2 However, only 16.5% of people with depression report receiving treatment at minimal standards3 and standard pharmacological and psychological treatments for depression are effective in only about 74% of cases, even when combined.4 It has been argued that some of the responsibility for depression’s relatively poor treatment efficacy is due to difficulties in diagnosis and assessment processes that are too “global” and which inhibit “personalized medicine” approaches to depression.5 The suggestion that has arisen from that discussion is to focus upon “subtypes” of depression that coalesce about specific diagnostic criteria for that disorder, and to investigate possible biological markers of those subtypes.6 Although a very great deal of attention has been given to the identification of possible genetic markers for depression, this has proven fruitless,7 leading researchers to focus upon other biological candidates such as hormones and inflammatory factors.
The most commonly diagnosed form of depression is Major Depressive Disorder (MDD), as set out in the Diagnostic and Statistical Manual (5th ed.) (DSM-5) of the American Psychiatric Association.8 A diagnosis of MDD requires the presence of at least five of nine symptoms, and includes cognitive, emotional, somatic and anhedonic symptoms, which are quite different kinds of behaviors and are based upon different neurobiological substrates and require different treatment approaches.9 There are also a large number of Associated Features for MDD, which are linked to the nine major criteria but describe slightly different depressive behaviors.8 Due to this heterogeneity in symptoms and Associated Features, there are 1497 possible ways of fulfilling the diagnosis of MDD.10 This arithmetical heterogeneity was confirmed by actual symptom data from nearly 4000 depressed outpatients in the STAR*D trial,11 which identified 1030 unique symptom profiles in that sample alone, 83.9% of which were endorsed by five or fewer patients and 48.6% of which were endorsed by only one patient. Those authors argued that this symptom heterogeneity might account for the relative lack of universal efficacy of standard treatments for depression. This high level of MDD symptom heterogeneity was not significantly influenced by depression severity, and those authors have consequently argued for the examination of specific depression symptoms rather than a dichotomous diagnosis of MDD based upon the presence/absence of a number of symptoms.12
Although all of the various MDD symptoms are relevant, one that has particular importance is fatigue.13 Fatigue is strongly associated with overall depression14,15 and longitudinal studies have shown fatigue to also be an independent risk factor for depression.16 Although fatigue can be minor and transitory, or chronic and debilitating, and may be divided into physical and mental components,17 depression-associated fatigue represents a valuable focus of research because of its likely link with chronic stress,18 which in turn has been significantly associated with vulnerability for depression.19 One of the indicators of chronic stress is elevated HPA-axis activity, commonly measured by the presence of hypercortisolemia.20,21 Perhaps because of its association with chronic stress, elevated cortisol has repeatedly been found to be significantly associated with depression,22,23 to the point where “The notion that depressive illness is associated with hypersecretion of cortisol has reached the status of a textbook truism”.23
Another aspect of the stress response is inflammation, which is considered to be “contained within the stress response”.24 One particular inflammatory cytokine that has been significantly linked to depression is C-reactive protein (CRP), a major acute-phase plasma protein that recognizes altered and foreign molecules and binds to various ligands to play a role in the innate immune system and to stimulate phagocytosis.25,26 CRP has been found to be elevated in patients with a range of psychiatric disorders, including MDD.27,28
Thus, there is a hypothetical association between HPA-axis responses (cortisol), CRP and depression-associated fatigue. However, although there have been some reports of the association between HPA-axis responses, inflammatory factors and depression,29,30 relatively little attention has been paid to the specific relationships between HPA-axis responses, CRP and depression-related fatigue. Investigation of this association has the potential to provide a link between the stress-related HPA-axis and inflammatory responses of the individual and one of the major somatic symptoms of MDD that is also an antecedent of full MDD as demonstrated within longitudinal studies.16 In addition, by directly comparing the relative contribution that cortisol versus CRP make to depression-related fatigue, the nature of that antecedent pathway might be clarified by identifying if there is a more powerfully associated factor (ie, cortisol or CRP). This has the potential to inform treatment of MDD, particularly in those persons who may be at greater risk of developing this disorder because of physical illness31 or other major chronic stressors.32 Therefore, this study was designed to investigate the individual and combined effects of cortisol and CRP as correlates of depression-associated fatigue. Due to the paucity of previous research on this issue, no formal hypothesis could be stated for testing.
Several methodological issues were considered before undertaking this study because they had implications for the definition of the dependent and independent variables. First, depression-associated fatigue was defined as participant responses to a fatigue-related item on a common depression inventory. Although there are several multi-item scales for assessing a range of fatigue-related behaviors, these do not necessarily relate to depression per se, but rather ask participants about their cognitive difficulties, such as The Fatigue Scale,33 or their need to recover from demand via the Need for Recovery Scale.34 Although they are valid measures of overall fatigue, these scales do not focus on fatigue as it is related to depression. Second, cortisol shows a Diurnal Rhythm (DR) initiated by the circadian clock within the hypothalamus, and this DR exhibits a maximum concentration of cortisol about 45 mins after waking in the morning and a nadir during the early evening.35 Collection of “morning cortisol” about 45 mins after waking can provide an overall indicator of HPA-axis responsivity, and elevated concentrations of morning cortisol have been shown to be consistently associated with depression.23,36,37 Third, there is some evidence of an interaction between cortisol and inflammatory cytokines38 and the ratio of cortisol to CRP has previously been used as an indicator of that interaction,38 calculated as described below under “Methods” section. It has been argued that the cortisol:CRP ratio represents a negative feedback loop between the HPA-axis and inflammatory systems.39 Patients with rheumatic disease exhibit significantly lower cortisol:CRP ratios, indicative of HPA-axis hyporesponsivity relative to elevated levels of CRP, based upon evidence that this ratio reflects the bidirectional influences between the immune system and the HPA-axis.40 This has some relevance to studies of depression, where low ratios have suggested the presence of high inflammation and lower cortisol levels among depressed women,41 and high ratios have suggested the opposite, which is consistent with a large literature attesting to elevated cortisol in depressed persons.22,23 The cortisol:CRP ratio, therefore, allows for identification of both scenarios, whereby particular types of inflammation and HPA-axis states can be measured.
Methods
Participants
Volunteers from one of the Australian Electoral Office electorates covering a large rural land area in northern New South Wales were invited by letter to participate in a study “about your mental health”. The letter emphasized that individuals who had not experienced mental health problems were welcome as much as those who had such experiences so that comparative data could be collected. Inclusion criteria were that participants were to be at least 18 years of age. Exclusion criteria were the presence of an acute medical illness.
Instruments
Background questionnaire
Participants were asked to state their age (years) and sex.
Depression-related fatigue
Item 10 from the 20-item Zung Self-rating Depression Scale (SDS)42 was selected to tap depression-related fatigue (“I get tired for no reason”). The SDS is based on data from factor analytic studies of Major Depressive Disorder (MDD)43 and fits the most recent definitions of that disorder.8 Respondents indicate the frequency of each of those 20 items by answering: “None or a little of the time” (score of 1), “Some of the time” (2), “Good part of the time” (3) or “Most or all of the time” (4), which produce a total score range from 20 to 80. A raw score of 40 and above represents the cutoff for “clinically significant depression”.44 The SDS has demonstrated split-half reliability of 0.81,42 0.7945 and 0.94.46 Internal consistency (alpha) has been reported as 0.88 for depressed patients and 0.93 for non-depressed patients47 and as 0.84 for a previous Australian sample.48 The SDS has been shown to be superior to the MMPI Depression Scale and the Beck Depression Inventory for assessing depression in male psychiatric inpatients.47 SDS item 10 and SDS total raw scores were used in this study.
Cortisol extraction
Cortisol in saliva was measured using a specific salivary cortisol ELISA kit from Abnova Corporation (KA1885, Taipei, Taiwan). This is a solid-phase ELISA using a polyclonal rabbit antibody directed against cortisol. The assay is based on the principle of competitive binding, and endogenous cortisol in the sample competes with a cortisol-horseradish peroxidase conjugate for binding to the antibody. This ELISA has an intra-assay variability of 8.27% and inter-assay variability of 8.33%, with a spiking recovery of 100% and calibration range of 0.1–30 ng/mL. Salivary cortisol was assayed according to the manufacturer’s instructions. Briefly, 50 µL of neat saliva from participants or cortisol standards (0.1–30 ng/mL) were transferred to the appropriate wells of the 96-well microtitre plate. Fifty µL enzyme-conjugate was dispensed into each well with thorough mixing. The plate was incubated at room temperature with gentle rocking for 60 mins. The contents of each well were aspirated followed by four rinses with 300 µL wash solution. Substrate (200 µL) was added to each well and the plate was incubated at room temperature for 30 mins. The reaction was stopped with the addition of 50 µL stop solution and absorbance was read at 450 nm immediately. All standards, controls and samples were assayed in duplicate and results were calculated using a 4-parameter logistics curve fit.
CRP assays
Blood samples were collected and centrifuged at 1000 g for 15 mins. The sera were frozen at −80°C until analysis of C-reactive protein. Serum concentrations of CRP were determined using a Siemens Dimension XPand Plus Autoanalyser (Siemens, Newark, USA), using the CRP extended range (RCRP) Flex reagent cartridge (DF34, Siemens Dimension, Newark, USA) according to the manufacturers’ instructions. This assay is based on the particle-enhanced turbidimetric immunoassay (PETIA) technique, where synthetic particles coated with anti-CRP antibodies aggregate in the presence of CRP, increasing turbidity in proportion to CRP concentration. Concentrations are reported in mg/L.
Procedure
From a list of 20,000 random names and addresses (balanced for equal numbers of males and females) supplied by the Australian Electoral Commission in 2013, sufficient participants were recruited to exceed the sample size required by a priori power analysis for a correlational analysis to detect a “medium” effect of 0.3 or greater49 with alpha = 0.05 and power = 0.95 (GPower 3.1). Participants received a link to an online portal or a copy of the questionnaire booklet containing an explanatory statement and consent form, plus the background questionnaire and the SDS, a small container (Salivette) and written instructions for collection of morning cortisol saliva, which they were asked to freeze until they came to the researchers’ lab a few days later to provide a blood sample for CRP assay. Some previous research has collected salivary cortisol data on several days, assumedly to improve generalisability of those data. However, as well as placing an increased research burden upon participants, and increasing the likelihood of participant drop-out in community participants, there are sufficient data from studies of repeated collections of salivary cortisol to argue that there is acceptable long-term agreement between concentrations of salivary cortisol over periods of several months,50 which is much longer than the few days that was the gap between saliva collection and serum collection in this study. CRP is also relatively stable over time and shows no DR.38 The project was approved by the University of New England Human Research Ethics Committee. All participants gave written consent to the study. This study was conducted in accordance with the Declaration of Helsinki.
Statistical analyses
Data were tested for normality. Pearson correlation coefficients were calculated to test for any significant age effects on the DVs, and gender was also tested for its effect via MANOVA. The cortisol:CRP ratio was derived by dividing cortisol concentration by the CRP-value as described by Suarez et al.38,39 Pearson correlation coefficients were calculated for the associations between the CRP and cortisol variables and the SDS variables, with a Bonferroni correction for multiple testing, and partial correlations tested for the relative effects of cortisol and CRP, respectively, on these associations. MANOVA was used to test for significant differences in variables between males and females, and between quartiles of cortisol:CRP ratio.
Results
Data
A total sample of 126 participants were recruited for this study (M age =51.9 yr, SD =17.1 yr, range =18–85 yr), including 46 males (36.5%) and 80 females (63.5%). Using the Kolmogorov-Smirnov statistic, Cortisol, CRP and Cortisol:CRP ratio, data were skewed and log transformed, but SDS total score and item 10 data did not require transformation. There were no significant correlations between age and CRP log, cortisol log, SDS total score or SDS item 10, nor any significant differences in these variables according to gender. Table 1 shows the mean, SD and range scores for all DVs.
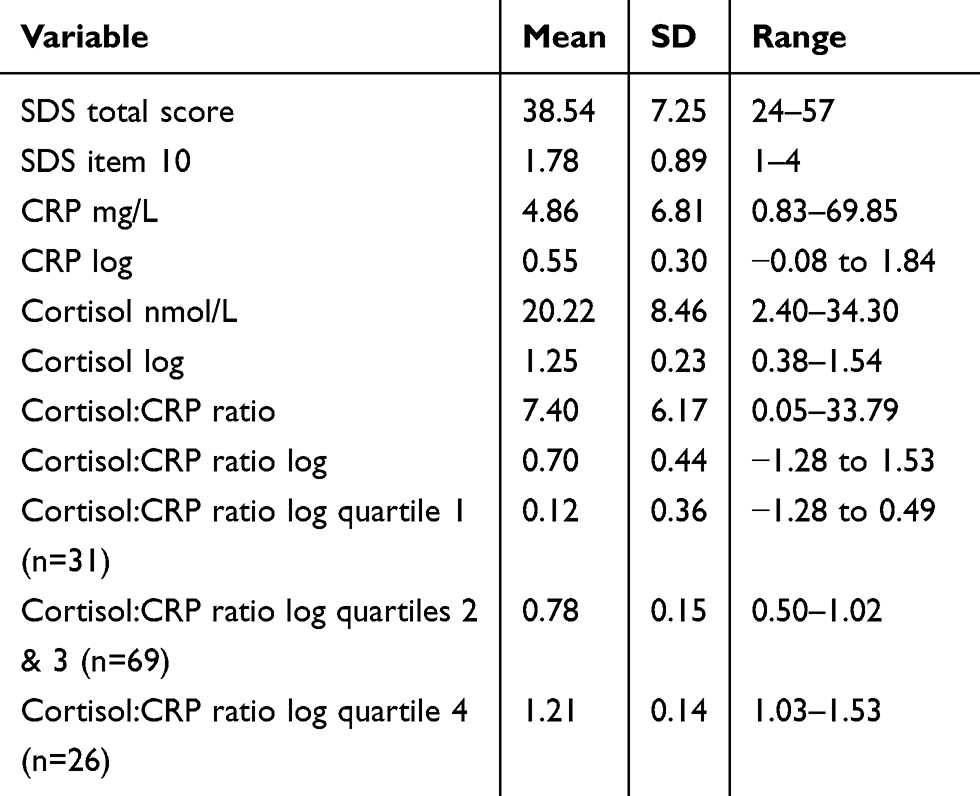 |
Table 1 Distributions of all dependent variables |
Associations between variables
To test for the presence of significant associations between cortisol, CRP and their ratio with SDS total score and SDS item 10 score, Pearson correlation coefficients were calculated and appear in Table 2. Allowing for the correction to reduce Type 1 error rates (ie, 0.05/5= 0.01), there was a significant correlation between the SDS total score and SDS item 10, verifying the depression-relevance of this fatigue index. There was no significant correlation between cortisol log and SDS item 10, but there were significant correlations between CRP log and SDS item 10, and between the cortisol:CRP ratio log and SDS item 10. Partial correlation analysis revealed that the significant association between cortisol:CRP log and SDS item 10 (r = −0.260, p= 0.005) reduced to non-significance (r = −0.030, p= 0.750) when the effect of CRP log was controlled for. By contrast, when cortisol log was controlled for, the correlation between cortisol:CRP log and SDS item 10 increased slightly (r = −0.262) and the actual p-value only changed from 0.0048 to 0.0046.
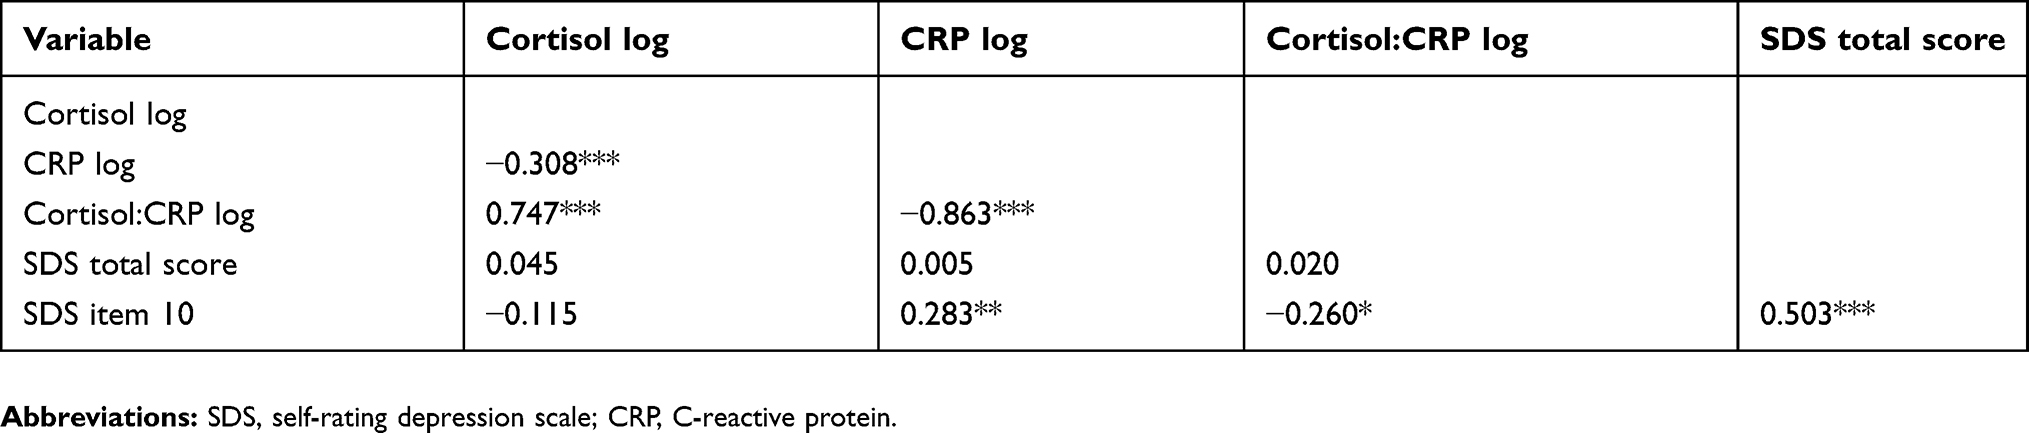 |
Table 2 Pearson correlation coefficients between variables |
Effects of cortisol:CRP ratio
As shown in Table 1, the ratio of cortisol:CRP log ranged from −1.28 to 1.53. Following the procedure described by Suarez et al,38 this range may be subdivided into three categories on the basis of the quartile ranges (lowest = quartile 1, middle = quartiles 2 and 3, highest = quartile 4), which represent the distribution of cortisol:CRP ratios as “pro-inflammatory”, “homeostatic” and “hyper-cortisolemic”.38 Table 1 presents the mean (SD) and range of cortisol:CRP log values for each of these three subgroups. There were no significant differences in male versus female cortisol log, CRP log, cortisol:CRP log or SDS total scores within any of these three subgroups. Quartile subgroups 1 and 3 represent different types of inflammation:HPA-axis relationships, and a significant MANOVA main effect was found between these two subgroups for the combination of cortisol, CRP, SDS total score and SDS item 10 score F(5.45) =67.865, p< 0.001); univariate effects were significant for all of these except SDS total score (Table 3). With a mean SDS item 10 score of 2.14, quartile 1 respondents scored in the range of “A good part of the time”, whereas quartile 3 respondents scored in the range of “Some of the time”. A total of 20.7% of quartile 1 respondents gave a response of “Good part of the time” and 13.8% gave a response of “Most or all of the time”, but only 4.3% of quartile 3 respondents gave a response of “Good part of the time” and none gave a response of “Most or all of the time”. These findings argue for a model of depression-associated fatigue that is more severely reported by respondents with a low cortisol and high CRP ratio rather than a high cortisol and low CRP ratio.
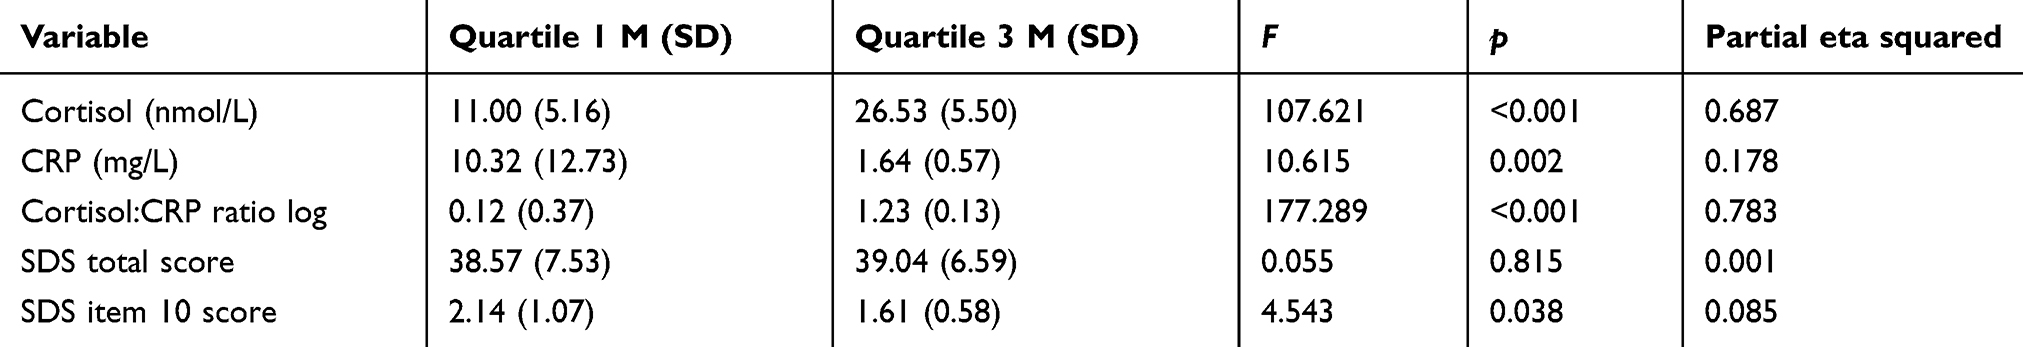 |
Table 3 Univariate effects for MANOVA on first vs third cortisol:CRP log quartiles |
Effects of depressive severity
As mentioned in the “Methods” section, there is a cutoff score of 40 for the SDS total score that represents “clinically significant depression”, where patients require further attention.44 By applying this cutoff, 54 (42.86%) participants fell into this category, were defined by their clinical case-ness and were referred to as “depressed”. There was no significant gender difference in the category of participants’ clinical case-ness (Chi-square (1) =0.465, p= 0.561). To test if the effect of cortisol upon the correlation between cortisol:CRP ratio log and SDS item 10 was changed by the clinical case-ness of participants, those partial correlation coefficients were re-calculated separately for each of these two subgroups of participants. While there was no significant effect of Cortisol log upon the association between cortisol:CRP log and SDS item 10 for either the non-depressed (r = 0.050, p= 0.706) or depressed (r = −0.027, p= 0.846) subgroups, the depressed subgroup’s results mirrored those for the entire sample when the effects of CRP log were controlled for (change from r = −0.479, p< 0.001 to r = −0.027, p= 0.846) but the non-depressed subgroup did not show any change in significance when CRP log was controlled for (r = −0.018, p= 0.881 to r = −0.079, p= 0.551).
Discussion
The major finding from this study is that the association between cortisol:CRP ratio and depression-related fatigue is a function of CRP rather than cortisol, and that this is mostly as a result of the responses from the “depressed” portion of the sample. This is an advance in the field because recent research has focused upon the cortisol:CRP ratio itself without unpacking the relative contributions of cortisol versus CRP38,39 or the relative contributions from “depressed” versus “non-depressed” sections of the community samples used in that research. While those previous studies identified that a low level of cortisol paired with elevated CRP (ie, the overall cortisol:CRP ratio) was a contributing factor in determining sensitivity to a standardized stressor in depressed individuals, and depression overall, those results did not allow for the further identification of the specific aspects of that ratio and their effects upon specific symptoms of MDD, such as fatigue. Although MDD may be characterized by many different sets of symptom profiles (see “Introduction“ section), fatigue is one of the major indicators and antecedents of MDD, and is associated with some physical illnesses such as cancer,51,52 as well as the longer-term effects of chronic stress18,53 that are also significantly associated with depression.
Although the current findings appear to disagree with those reported by Bhagwagar et al,23 who found elevated cortisol in depressed persons, that study did not compare inflammatory factors with cortisol, allowing for the possibility that the cortisol:CRP ratio may have revealed a different outcome. However, the current results do fit with those previously reported by Miller et al41 among depressed women whose CRP-values were greater than their cortisol values, and extend them by including men as well as women, and by failing to demonstrate any significant differences between the sexes in this study. The lack of a significant correlation between either cortisol, CRP or their ratio and the total SDS score, even within the “depressed” subgroup, plus the lack of gender-specific results, offers a challenge to some previous results and suggests that other factors may be involved in those relationships that have been found to be significant in previous studies.
By directly comparing the relative contribution that cortisol versus CRP make to depression-related fatigue, the nature of the antecedent pathway from chronic stress to depression symptoms might be clarified by these findings. That is, because it appears from these data that the inflammatory system is more closely linked with depression-related fatigue than the HPA-axis is, it follows that dysregulation of the immune pathway was a more likely antecedent for depression-related fatigue. This finding is consistent with models of depression symptoms as arising within a “sickness behavior” response to chronic stressors.54 Fatigue also constitutes one aspect of the overall “behavioral withdrawal” that has been posited as underlying depression.55 That model argues that sleepiness (arising from fatigue) may have a survival benefit by helping the infected individual preserve energy and fight invasive pathogens.56 This does not argue for a “cytokine-alone” causal model of depression, but rather for a reciprocal interaction model wherein depression (and fatigue) interact with inflammation.57,58
These findings also hold some initial suggestions for treatment options. For example, identification of fatigue arising from chronic stress or a medical condition is already accepted as a risk sign for eventual development of MDD16 but the current findings also argue for consideration of the state of the fatigued individual’s CRP status. Because CRP is a major acute-phase plasma protein that recognizes altered and foreign molecules,25,26 and has been observed to be elevated in patients with MDD,27,28 it may function as an “early warning” sign that the individual’s fatigue is serious enough to warrant attention as a possible precursor to full MDD. Those persons might already be experiencing a major physical illness31 or other chronic stressors32 and are thus more likely to develop depression in need of treatment. Although the data regarding the use of anti-inflammatory treatments for depression are only suggestive at this stage,59 they do indicate a potentially valuable role for cytokine modulators in depressed persons who are also chronically inflamed (perhaps due to physical illness).60
As in all research, this study has several limitations upon the generalisability of its findings. First, the sample was geographically limited to a particular area of rural Australia, and no implications are made for other cultures or nations. Second, data were collected at a single point in time and are restricted in their ability to generalize over time and circumstance. Third, depression-related fatigue data were self-reported and, although this is a recognized methodology in research settings, it is not the “gold standard” of clinical assessment (ie, the Structured Clinical Interview). Fourth, cortisol sampling was taken on a single day at one specific time, and no information was provided regarding the overall DR of participants’ HPA-axis status. Although this is not necessarily a cause of invalidity (see the discussion of single-observation salivary cortisol sampling in “Methods” section), future studies might further inform this field with more data regarding the HPA-axis DR. CRP is relatively stable, and may be regarded as not reasonably differing in the time between saliva sampling and blood collection in this study, but simultaneous sampling might provide greater confidence in results. Fifth, the data were collected from volunteers and it may be that this produced a biased sample. Several strengths are also apparent in the methodology used in this study, including the community source of participants, use of a well-validated scale for measuring depression and depression-related fatigue, a focus upon one of the major diagnostic indicators and correlates of MDD rather than a global measure of depression, adequate sample size and statistical power and the uncoupling of CRP and cortisol as correlates of depression and fatigue.
In conclusion, these findings explain a further link in the stress–inflammation–depression pathway, and do so by highlighting the nature of the cortisol:CRP ratio in its association with fatigue. The lack of replication of the cortisol:CRP association with full depression in this sample, even among the “depressed” participants, provides some more data regarding the links between inflammation, the HPA-axis and depression, and opens the way for further studies of intervening variables that may influence that relationship.
Author contributions
CFS, VB and LLA planned the study, analyzed the data and drafted the manuscript. MEM carried out the genotyping and assisted with the drafting of the manuscript. EJ assisted with data collection and reduction and assisted with the drafting of the manuscript. All authors contributed to data analysis, drafting and revising the article, gave final approval of the version to be published, and agree to be accountable for all aspects of the work.
Disclosure
The authors report no conflicts of interest in this work.
References
1. Depression: “let’s Talk” Says WHO, as Depression Tops List of Causes of Ill Health [press Release]. Geneva: World Health Organisation.
2. Walker E, McGee R, Druss B. Mortality in mental disorders and global disease burden implications: a systematic review and meta-analysis. JAMA Psych. 2015;72:334–341. doi:10.1001/jamapsychiatry.2014.2502
3. Thornicroft G, Chatterji S, Evans-Lacko S, Gruber M. Undertreatment of people with major deperssive disorder in 21 countries. Brit J Psych. 2017;210:119–124. doi:10.1192/bjp.bp.116.188078
4. Rush A, Trivedi M, Wisniewski S, Nierenberg A, Stewart J, Warden D. Acute and longer-term outcomes in depressed outpatients requiring one or several treatment steps: a STAR* report. Am J Psychy. 2006;163:1905–1917. doi:10.1176/ajp.2006.163.11.1905
5. Insel T. Transforming diagnosis. 2013; Post. Available from: www.nimh.nih.gov/about/director/2013/transforming-diagnosis-shtml.
6. Kapur S, Phillips A, Insel T. Why has it taken so long for biological psychiatry to develop clinical tests and what to do about it? Mol Psych. 2012;17:1174. doi:10.1038/mp.2012.105
7. Border R, Johnson E, Evans L, et al. No support for historical candidate gene or candidate gene-by-interaction hypotheses for major depression across multiple large samples. Am J Psych. 2019. doi:10.1176/appi.ajp.2018.18070881
8. APA. Diagnostic and Statistical Manual of Mental Disorders.
9. Sharpley C, Bitsika V. Differences in neurobiological pathways of four “clinical content” subtypes of depression. Behav Brain Res. 2013;256:368–376. doi:10.1016/j.bbr.2013.08.030
10. Ostergaard S, Jensen S, Bech P. The heterogeneity of the depressive syndrome: when numbers get serious. Acta Psych Scand. 2011;124:495–496. doi:10.1111/j.1600-0447.2011.01744.x
11. Fried E, Nesse R. Depression is not a consistent syndrome: an investigation of unique symptom patterns in the STAR*D study. J Affective Dis. 2015;172:96–102. doi:10.1016/j.jad.2014.10.010
12. Fried E, Nesse R. Depression sum-scores don’t add up: why analyzing specific deperssion symptoms is essential. Cur Cont Psych. 2015;13.
13. Koschera L, Hickie I, Hadzi-Pavlovic D, Wilson A, Lloyd A. Prolonged fatigue, anxiety and depression: exploring relationships in a primary care sample. ANZ J Psych. 1999;33:545–552.
14. Wessely S, Chalder T, Hirsch S, Wallace P, Wright D. Psychological symptoms, somatic symptoms, and psychiatric disorder in chronic fatigue and chronic fatigue syndrome: a prospective study in the primary care setting. Am J Psych. 1996;153:1050–1059. doi:10.1176/ajp.153.8.1050
15. Bakshi R, Shaikh Z, Miletich R, et al. Fatigue in multiple sclerosis and its relationship to depression and neurologic disability. Mult Scler. 2000;6:181–185. doi:10.1177/135245850000600308
16. Skapinakis P, Lewis G, Mavreas V. Temporal relations between unexplained fatigue and depression: longitudinal data from an international study in primary care. Psychosom Med. 2004;66:330–335.
17. Lee K, Hicks G, Nino-Murcia G. Validity and reliability of a scale to asses fatigue. Psych Res. 1991;36:291–298. doi:10.1016/0165-1781(91)90027-M
18. Davis M, Zautra A, Younger J, Motivala S, Attrep J, Irwin M. Chronic stress and regulation of cellular markers of inflammation in rheumatoid arthritis: implications for fatigue. Brain Behav Immun. 2008;22(1):24–32. doi:10.1016/j.bbi.2007.06.013
19. Chrousos G. Stress and disorders of the stress system. Nat Rev Endo. 2009;5:374–381. doi:10.1038/nrendo.2009.106
20. Pariante C, Lightman S. The HPA axis in major depression: classical theories and new developments. Trends Neurosci. 2008;31:464–468. doi:10.1016/j.tins.2008.06.006
21. Stetler C, Miller G. Depression and hypothalamic-pituitary-adrenal activation: a quantitative summary of four decades of research. Psychosom Med. 2011;73:114–126. doi:10.1097/PSY.0b013e31820ad12b
22. Bhagwagar Z, Hafizi S, Cowen P. Increase in concentration of waking cortisol in recovered patients with depression. Am J Psych. 2003;160:1890–1891.
23. Bhagwagar Z, Hafizi S, Cowen P. Increased salivary cortisol after waking in depression. Psychopharmacol. 2005;182:54–57. doi:10.1007/s00213-005-0062-z
24. Black P, Garbutt L. Stress, inflammation and cardiovascular disease. J Psychosom Res. 2002;52(1):1–23. doi:10.1016/S0022-3999(01)00302-6
25. Black S, Kushner I, Samols D. C-reactive protein. J Biol Chem. 2004;279:48478–48490. doi:10.1074/jbc.R400025200
26. Volanakis J. Human C-reactive protein: expression, structure, and function. Mol Immun. 2001;38:189–197. doi:10.1016/S0161-5890(01)00042-6
27. Wysokinski A, Margulska A, Strzelecki D, Kloszewska I. Levels of C-reactive protein (CRP) in patients with schizophrenia, unipolar depression and bipolar disorder. Nordic J Psych. 2015;69:346–353. doi:10.3109/08039488.2014.984755
28. Chang H, Wang T-H, Lee I, et al. C-reactive protein: a differential biomarker for major depressive disorder and bipolar II disorder. World J Biol Psych. 2017;18(1):63–70. doi:10.3109/15622975.2016.1155746
29. Karlović D, Serretti A, Vrkić N, Martinac M, Marčinko D. Serum concentrations of CRP, IL-6, TNF-α and cortisol in major depressive disorder with melancholic or atypical features. Psych Res. 2012;198(1):74–80. doi:10.1016/j.psychres.2011.12.007
30. Lamers F, Vogelzangs N, Merikangas K, de Jonge P, Beekman A, Penninx B. Evidence for a differential role of HPA-axis function, inflammation and metabolic syndrome in melancholic versus atypical depression. Mol Psych. 2013;18:692–699. doi:10.1038/mp.2012.144
31. Katon W, Lin E, Kroenke K. The association of depression and anxiety with medical symtpkm burden in patients with chronic medical illness. Gen Hosp Psych. 2007;29:147–155. doi:10.1016/j.genhosppsych.2006.11.005
32. Willner P. The chronic mild stress (CMS) model of depression: history, evaluation and usage. Neurobiol Stress. 2017;6:78–93. doi:10.1016/j.ynstr.2016.08.002
33. De Vries J. Vermoeidheidsschaal [Fatigue Scale]. Tilburg, Netherlands: Tilburg University; 1998.
34. Van Veldhoven M, Meijman T. Het Meten Van Psychosociale Arbeidsbelasting Met Een Vragenlijst: De Vragenlijst Beleving En Beoordeling Van De Arbeid (VBBA). Amsterdam: NIA; 1995.
35. Clow A, Hucklebridge F, Stalder T, Evans P, Thorn L. The cortisol awakening response: more than a measure of HPA axis function. Neurosci Biobehav Rev. 2010;35:97–103. doi:10.1016/j.neubiorev.2009.12.011
36. Holsboer F. The corticosteroid hypothesis of depression. Neuropsychopharm. 2000;23:477–501. doi:10.1016/S0893-133X(00)00159-7
37. Young E, Korszun A. Sex, trauma, stress hormones and depression. Mol Psych. 2010;15:23–28. doi:10.1038/mp.2009.94
38. Suarez E, Sundy J. The Cortisol: C-reactiveprotein ratio and negative affect reactivity in depressed adults. Health Psychol. 2017;36:852–862. doi:10.1037/hea0000517
39. Suarez E, Sundy J, Erkanli A. Depressogenic vulnerability and gender-specific patterns of neuroimmune dysregulation: what the ratio of cortisol to C-reactive protein can tell us about loss of normal regulatory control. Brain Behav Immun. 2015;44:137–147. doi:10.1016/j.bbi.2014.09.008
40. Tsigos C, Papanicolaou D, Defensor R, Mitsiadis C, Kyrou I, Chrousos G. Dose effects of recombinant human lnterleukin-6 on pituitary hormone secretion and energy expenditure. Neuroendocrin. 1997;66(1):54–62. doi:10.1159/000127219
41. Miller G, Rohleder N, Stetler C, Kirschbaum C. Clinical depression and regulation of the inflammatory response during acute stress. Psychosom Med. 2005;67:679–687. doi:10.1097/01.psy.0000174172.82428.ce
42. Zung W. A self-rating depression scale. Arch Gen Psych. 1965;12:63–70. doi:10.1001/archpsyc.1965.01720310065008
43. APA. Diagnostic and Statistical Manual of Mental Disorders (4th Ed, Text Revision). Washington, DC: American Psychiatric Association; 2000.
44. Zung W. From art to science: the diagnosis and treatment of depression. Arch Gen Psych. 1973;29:328–337. doi:10.1001/archpsyc.1973.04200030026004
45. DeJonge J, Baneke J. The Zung self-rating depression scale: a replication study on reliability, validity and prediction. Psychol Rep. 1989;64:833–834. doi:10.2466/pr0.1989.64.3.833
46. Gabrys J, Peters K. Reliability, discriminant and predictive validity of the Zung self-rating depression scale. Psychol Reps. 1985;57:1091–1096. doi:10.2466/pr0.1985.57.3f.1091
47. Schaefer A, Brown J, Watson C, et al. Comparison of the validities of the Beck, Zung and MMPI depression scales. J Cons Clin Psychol. 1985;53:415–418. doi:10.1037/0022-006X.53.3.415
48. Sharpley C, Bitsika V, Christie D. Understanding the causes of depression among prostate cancer patients: development of the effects of prostate cancer on lifestyle questionnaire. Psycho-Oncol. 2009;18:162–168. doi:10.1002/pon.1382
49. Cohen J. Statistical Power for the Behavioural Sciences. Hillsdale, NJ: Erlbaun; 1988.
50. Sharpley C, Bitsika V, Agnew L, Andronicos N. Eight-month test–retest agreement in morning salivary cortisol, self- and parent-rated anxiety in boys with an autism spectrum disorder. Physiol Behav. 2015;151:207–212. doi:10.1016/j.physbeh.2015.07.027
51. Ho S, Rohan K, Parent J, Tager F, McKinley P. A longitudinal study of depression, fatigue, and sleep disturbances as a symptom cluster in women with breast cancer. J Pain Sympt Manag. 2015;49(4):707–715. doi:10.1016/j.jpainsymman.2014.09.009
52. Bortolato B, Hyphantis T, Valpione S, et al. Depression in cancer: the many biobehavioral pathways driving tumor progression. Cancer Treat Rev. 2017;52:58–70. doi:10.1016/j.ctrv.2016.11.004
53. van Dam A. Subgroup analysis in burnout: relations between fatigue, anxiety, and depression. Front Psychol. 2016;7:90. doi:10.3389/fpsyg.2016.00090
54. Dantzer R, O’Connor JC, Freund GG, Johnson RW, Kelley KW. From information to sickness and depression: when the immune system subjugates the brain. Nature Rev Neurosci. 2007;9:45–56.
55. Bolling M, Kohlenberg R, Parker C. Behavior analysis and depression. In: Dougher MJ, editor. Clinical Behavior Analysis. Reno, Nevada: Context Press; 1999:127–153.
56. Hart BL. Biological basis of the behavior of sick animals. Neurosci Biobehav Rev. 1988;12(2):123–137. doi:10.1016/S0149-7634(88)80004-6
57. Dunn A. The cytokines and depression hypothesis: an evaluation. NeuroImmune Biol. 2008;6:485–506.
58. Dunn A, Swiergiel A, de Beaurepaire R. Cytokines as mediators of depression: what can we learn from animal studies? Neurosci Biobehav Rev. 2005;29(4):891–909. doi:10.1016/j.neubiorev.2005.03.023
59. Köhler O, Benros M, Nordentoft M, et al. Effect of anti-inflammatory treatment on depression, depressive symptoms, and adverse effects: a systematic review and meta-analysis of randomized clinical trials. JAMA Psych. 2014;71:1381–1391. doi:10.1001/jamapsychiatry.2014.1611
60. Kappelmann N, Lewis G, Dantzer R, Jones P, Khandaker G. Antidepressant activity of anti-cytokine treatment: a systematic review and meta-analysis of clinical trials of chronic inflammatory conditions. Mol Psych. 2016;23:335. doi:10.1038/mp.2016.167
 © 2019 The Author(s). This work is published and licensed by Dove Medical Press Limited. The
full terms of this license are available at https://www.dovepress.com/terms
and incorporate the Creative Commons Attribution
- Non Commercial (unported, 3.0) License.
By accessing the work you hereby accept the Terms. Non-commercial uses of the work are permitted
without any further permission from Dove Medical Press Limited, provided the work is properly
attributed. For permission for commercial use of this work, please see paragraphs 4.2 and 5 of our Terms.
© 2019 The Author(s). This work is published and licensed by Dove Medical Press Limited. The
full terms of this license are available at https://www.dovepress.com/terms
and incorporate the Creative Commons Attribution
- Non Commercial (unported, 3.0) License.
By accessing the work you hereby accept the Terms. Non-commercial uses of the work are permitted
without any further permission from Dove Medical Press Limited, provided the work is properly
attributed. For permission for commercial use of this work, please see paragraphs 4.2 and 5 of our Terms.