Back to Journals » Clinical Interventions in Aging » Volume 18
The Association Between Chronological Age and Dyslipidemia: A Cross-Sectional Study in Chinese Aged Population
Authors Li Q ![]() , Jiang Y, Song A, Li Y, Xu X, Xu R
, Jiang Y, Song A, Li Y, Xu X, Xu R ![]()
Received 28 January 2023
Accepted for publication 14 April 2023
Published 20 April 2023 Volume 2023:18 Pages 667—675
DOI https://doi.org/10.2147/CIA.S406237
Checked for plagiarism Yes
Review by Single anonymous peer review
Peer reviewer comments 3
Editor who approved publication: Dr Zhi-Ying Wu
Qingyao Li,1,2,* Ying Jiang,2,* Anqi Song,2 Yun Li,1 Xinyi Xu,3 Renying Xu2
1Department of Preventive Medicine, School of Public Health, North China University of Science and Technology, Tangshan, People’s Republic of China; 2Department of Clinical Nutrition, Ren Ji Hospital, Shanghai Jiao Tong University School of Medicine, Shanghai, People’s Republic of China; 3School of Economics and Management, Shanghai Polytechnic University at Jing Hai Road, Shanghai, People’s Republic of China
*These authors contributed equally to this work
Correspondence: Renying Xu, Department of Clinical Nutrition, Ren Ji Hospital, School of Medicine, Shanghai Jiao Tong University, Shanghai, People’s Republic of China, Tel +86-21-68383335, Email [email protected] Yun Li, Department of Preventive Medicine, School of Public Health, North China University of Science and Technology, Tangshan, People’s Republic of China, Tel +86-315-8805586, Email [email protected]
Background and Aims: Dyslipidemia is obviously an important risk factor for cardiovascular diseases, which might further lead to disability and death in aged population. We thus performed the current study to evaluate the association between chronological age and dyslipidemia.
Subjects and Methods: A total number of 59,716 Chinese aged population (31,174 men and 28,542 women, average age 67.8y) were included in the current study. Age and sex were abstracted from medical records. Height, body weight, and blood pressure were measured by trained nurses. Serum concentration of total cholesterol (TC) and total triglycerides were performed by enzyme-linked immunosorbent method after at least 8-h fast. Dyslipidemia was defined if total cholesterol≥ 5.7 mmol/L, or total triglycerides≥ 1.7 mmol/L, or self-reported history of dyslipidemia.
Results: The prevalence of dyslipidemia was 50.4% in the current study population. Compared to the youngest age group (60– 64y), the adjusted odds ratio was 0.88 (95% CI: 0.84, 0.92), 0.77 (95% CI: 0.73, 0.81), 0.66 (95% CI: 0.61, 0.70), 0.55 (95% CI: 0.50, 0.59) for the participants who were 65 to 69, 70– 74, 75– 79, and ≥ 80 years old (p trend < 0.001). Excluding participants with low body weight and with overweight and obesity, with high blood pressure and history of hypertension, with high fasting blood glucose and history of diabetes, generated similar results with main analysis.
Conclusion: Chronological age was closely associated with the risk of dyslipidemia in Chinese aged population.
Keywords: age, total cholesterol, TC, total triglycerides, TG, dyslipidemia
Introduction
China, as well as the whole world, is experiencing a dramatical increase in aged population.1 Obviously, aged population are in high risk of atherosclerosis and further infarction, hemorrhage, and stroke.2 Among which, dyslipidemia was believed to be involved both in the development of atherosclerosis and cardiovascular disease.3 A national-wide cross-sectional study reported that the prevalence of high total cholesterol and high total triglycerides was 7.1% and 16.9% in Chinese adults.4 As for older Chinese adults, another cross-sectional study reported that the prevalence of high total cholesterol and high total triglycerides was 8.4% and 11.4% in 2018 Chinese older adults (60–98 years old).5 Further, the trend in the prevalence of dyslipidemia linearly increased: hypercholesterolemia increased from 1.6% in 2002, to 5.6% in 2010, and then to 5.8% in 2015, while hypertriglyceridemia increased from 5.7% to 13.6% and then to 15.0% during the same study period.6
Unbalanced dietary pattern and sedentary behavior in China obviously contributed to high prevalence of dyslipidemia in the country. Subjects with dyslipidemia are prone to oxidative stress and endothelial dysfunction, contributing to formation of foam cells and atherosclerotic lesions under the action of chemical attractants and pro-inflammatory cytokines.7 In addition, it will lead to decreased vasoconstriction and increased blood pressure, which will aggravate the pathological changes and development of atherosclerosis.8 Followed after hypertension (78.5%), overweight or obesity (61.6%), dyslipidemia (54.4%) was the third risk factor identified in 6580 stroke patients.9
Lipid-lowering therapy, such as statin, is suggested to treat dyslipidemia. However, when to start treatment is important due to specific physiological change in lipid metabolism in aged population.10 Dyslipidemia awareness and control rates in China were 3- and 7-fold lower than US rates, respectively.11 Furthermore, the association between chronological age and concentration of lipid profiles remains controversial. A cross-sectional study reported that the risk of dyslipidemia was lower in aged population (65–75y), compared with young adults (35–44y); however, the participants were young (mean age: 54.5±9.3y).12 Another cross-sectional study performed in aged population (60–98y) reported concentration of total cholesterol (TC) and total triglycerides (TG) decreased as chronological age increased, however, the risk of high low-density-lipoprotein cholesterol (LDL-C) increased.5 A third cross-sectional study reported dyslipidemia was negatively associated with chronological age in participants with abnormal glucose metabolism but not in those with non-diabetic participants.13 Some other studies performed in adult participants reported that the concentration of TC and TG peaked at about 50–60 years old,14–16 which meant that the levels of TC and TG remained relatively stable after 60 years old.17
Therefore, we performed the current cross-sectional study in a large sample size (≈ 60,000) of Chinese aged population who were recruited from Healthy Management Center in our hospital. Exploring the association between chronological age and the risk of dyslipidemia might provide evidence to whether it is necessary to start statin treatment and when to start.
Subjects and Methods
Study Population
This is a cross-sectional study. All the potential participants were recruited from Medical Health Center of Ren Ji Hospital, School of Medicine, Shanghai Jiao Tong University from 2014 to 2021. The inclusion criteria were participants who were 60 years old or older. The exclusion criteria were listed as following: (1) participants without anthropometrical data (n=6868); (2) participants without information on blood pressure (n=707); (3) participants without biochemical test data (n=4938); (4) participants with history of cancer (n=220); (5) participants with history of chronic kidney disease (n=79) and whose estimated glomerular filtration rate <60 mL/min/1.73m2 (n=3372).18 The details are shown in Figure 1. This study was conducted according to the guidelines laid down in the Declaration of Helsinki, and all procedures involving human subjects/patients were approved by the Ethical Committee of Ren Ji Hospital, School of Medicine, Shanghai Jiao Tong University (No. KY-2019-112). As a retrospective study, patients’ written consent was waived by the same Ethical Committee. Data was stored and analyzed in the special computer to ensure confidentiality and patients’ personal information was concealed by re-coding procedure.
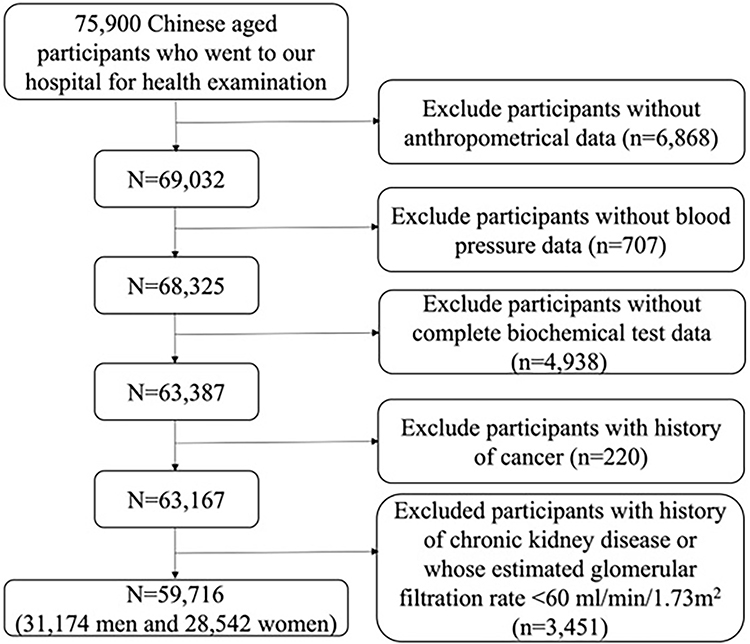 |
Figure 1 The process of sample recruitment. |
Measure of Biochemical Parameters
All the biochemical analyses were completed at the Department of Laboratory Medicine, Ren Ji Hospital after fasting for at least 8 h. Venous blood was drawn and transfused into a tube containing EDTA. Total cholesterol, total triglycerides, fasting blood glucose, aspartate transaminase, and alanine transaminase were measured by enzyme-linked immunosorbent method. Estimated glomerular filtration rate was estimated by the Chronic Kidney Disease Epidemiology Collaboration (CKD-EPI) equation.19
Dyslipidemia was defined if total cholesterol ≥5.7 mmol/L, or total triglycerides ≥1.7 mmol/L, or self-reported history of dyslipidemia.20
Measurement of Other Information
Age and sex were abstracted from medical record. Participants were further classified into following groups based on their age: ≤64y, 65–69y, 70–74y, 75–79y, and ≥80y. Body weight and height were measured in light clothes with bare foot. Body weight was measured with an accuracy of 0.1 kg, and height was measured with an accuracy of 0.5 cm. BMI was calculated as weight in kilograms divided by squared height in meters. Based on the recommendation for Chinese adults, participants were classified into the following: underweight (BMI <18.5 kg/m2), normal weight (18.5 kg/m2 ≤BMI< 24.0 kg/m2), overweight (24.0 kg/m2 ≤ BMI <28.0 kg/m2), and obesity (BMI ≥28.0 kg/m2).21
Blood pressure was measured using an automatic blood pressure monitor (HBP-9020, Omron, China) after at least 10-min rest. If the blood pressure was higher than normal, the measurement was repeated after 10 min of rest and the mean of the 2 measurements was recorded for further analysis. The history of hypertension, diabetes, dyslipidemia, and cancer were collected by a self-reported questionnaire (please see Supplementary Figure 1).
Statistical Analysis
All the analyses were performed using SAS version 9.3 (SAS Institute, Cary, NC, USA). Two-sided P<0.05 was considered statistically significant. Kolmogorov–Smirnov test was used to test the normality of the continuous variables; if it was in normal distribution, data were presented as means and standard deviations (SD), and if it was in abnormal distribution, data were presented as median and interquartile range. Non-paired t-test was used to compare difference in continuous variables between men and women if they were in normal distribution. If continuous variables were in abnormal distribution, the differences between men and women were compared with chi-square test. The difference in total cholesterol and total triglycerides across age groups was compared by ANOVA. Categorical variables were shown as proportion and Chi squared test was used to test the difference. In the current study, chronological age is the exposure and the case of dyslipidemia was the outcome. The association between age and the risk of dyslipidemia was assessed using multivariate logistic regression. We adjusted for potential confounders in different models: model 1, adjusting sex; model 2, adjusting sex and further adjusting systolic blood pressure (mmHg), diastolic blood pressure (mmHg), fasting blood glucose (mmol/L), and BMI (kg/m2); model 3, adjusting variables in model 2 and further adjusting estimated glomerular filtration rate (mL/min/1.73m2), alanine aminotransferase (IU/L), and aspartate aminotransferase (IU/L).
To test the robustness, we further performed three sensitivity analyses: excluding participants with low body weight,22 or with overweight and obesity,23,24 excluding those with high blood pressure or with history of hypertension,25 and excluding those with high fasting blood glucose or with history of diabetes.26
Results
The average age, BMI, TC, and TG were 67.8±6.3y, 24.7±3.2 kg/m2, 5.1±1.0 mmol/L and 1.4 mmol/L (interquartile range: 1.01 mmol/L, 1.99 mmol/L), respectively, in the current study. Men were older, taller, and had a greater body weight and BMI than women. The FBG level was also higher in men than that in women; however, SBP, TC, and TG were higher in women than those in men (Table 1).
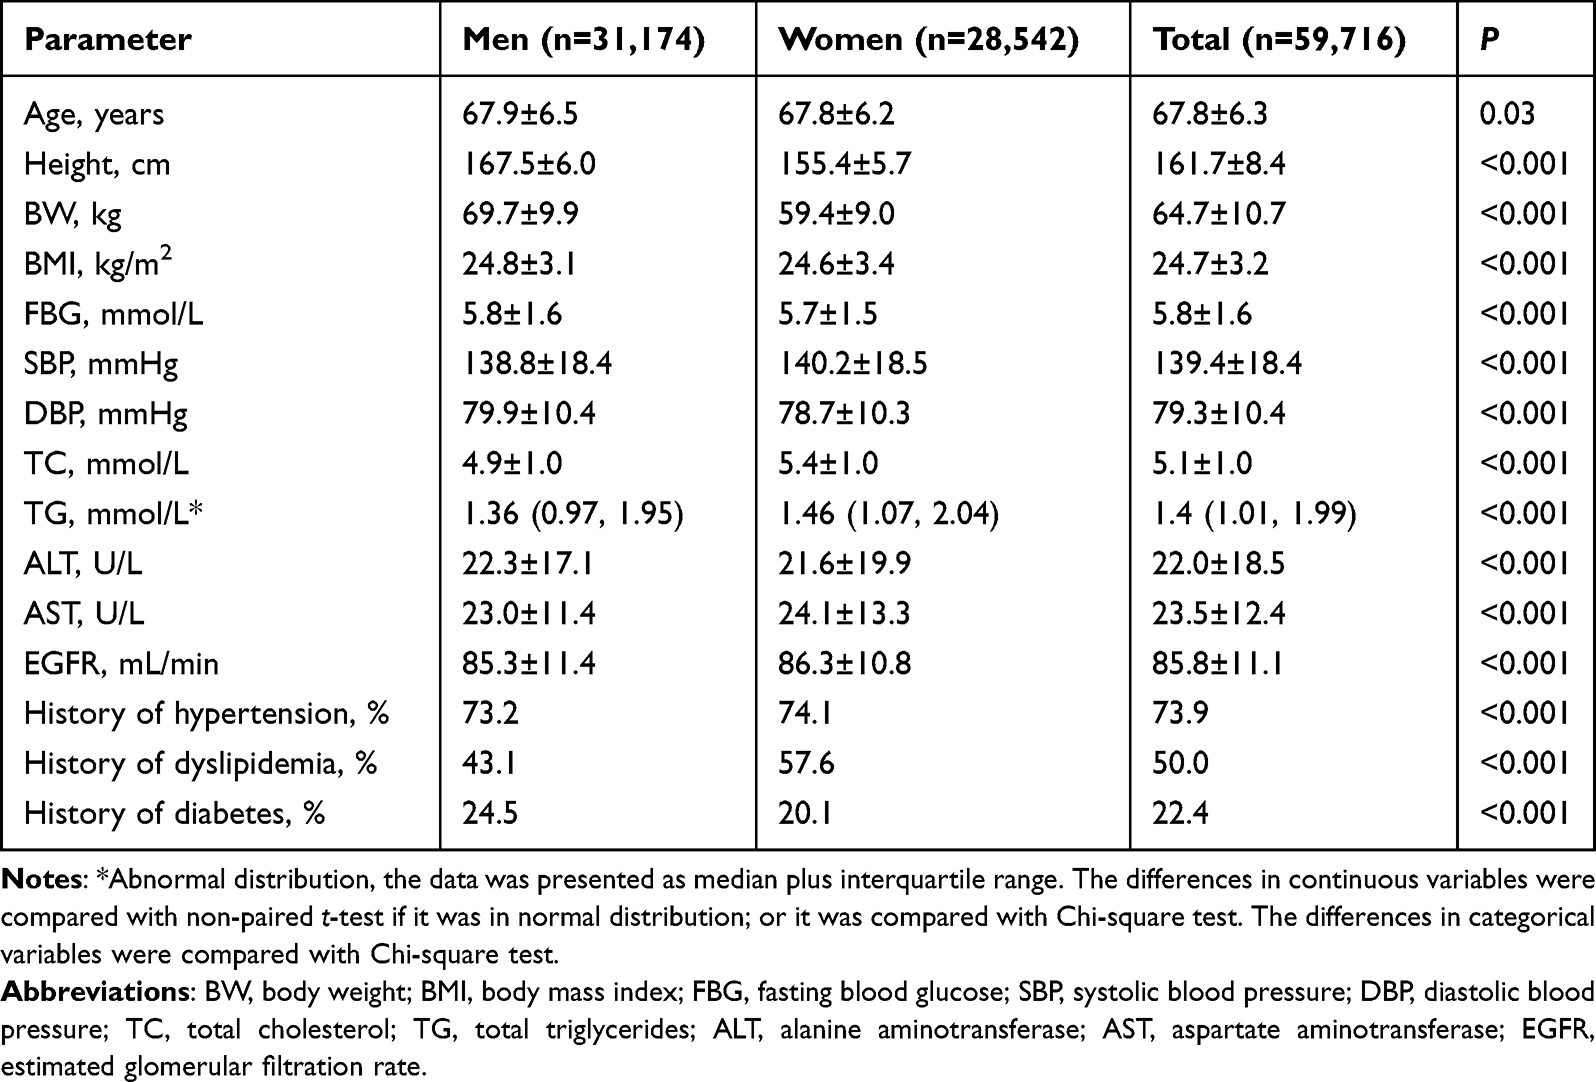 |
Table 1 Clinical Characteristics in 59,716 Chinese Aged Population |
The prevalence of underweight, overweight, and obesity were, respectively, 2.2%, 43.1%, and 14.3%. The prevalence of underweight increased while the prevalence of overweight and obesity decreased with the increase in age (Supplemental Table 1).
The median of TC and TG level decreased as the chronological age increased. The median TC was 5.22±0.99 mmol/L and 4.90±1.04 mmol/L, respectively, for the participants who were younger than 65 years old and participants who were older than 80 years old. The situation was similar for TG level. The level of TG was 1.43 (interquartile range: 1.03, 2.03) mmol/L and 1.26 (interquartile range: 0.90, 1.76) mmol/L for the two extreme age groups (Figure 2).
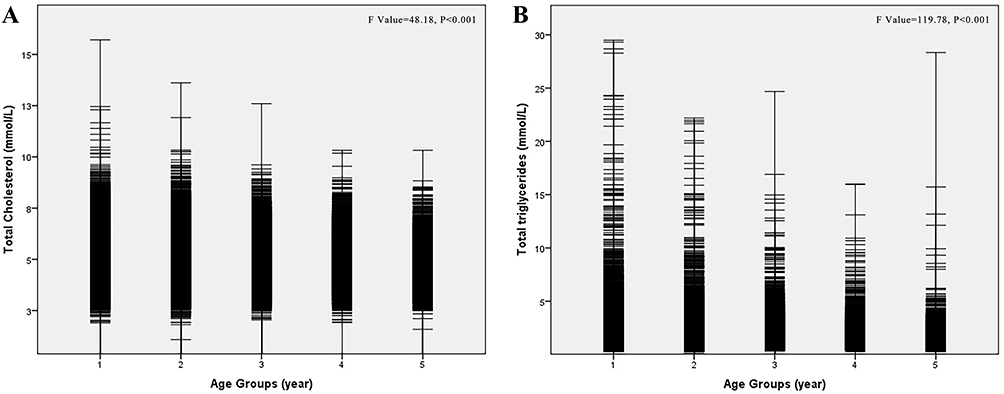 |
Figure 2 (A) The concentration of total cholesterol across different age groups in 59,716 Chinese aged population. (B) The concentration of total triglycerides across different age groups in 59,716 Chinese aged population. Group 1, 60–64 y; Group 2, 65–69 y; Group 3, 70–74 y; Group 4, 75–79 y; Group 5, ≥80y. The differences in serum total cholesterol and total triglycerides were compared with ANOVA test. |
The prevalence of dyslipidemia was 50.4% in the current study population. Compared to the youngest age group (<65y), the adjusted odds ratio was 0.88 (95% CI: 0.84, 0.92), 0.77 (95% CI: 0.73, 0.81), 0.66 (95% CI: 0.61, 0.70), 0.55 (95% CI: 0.50, 0.59) for the participants who were 65 to 69, 70–74, 75–79, and ≥80 years old (p trend <0.001) after adjustment of sex, SBP, DBP, FBG, ALT, AST, and eGFR (Table 2, model 3).
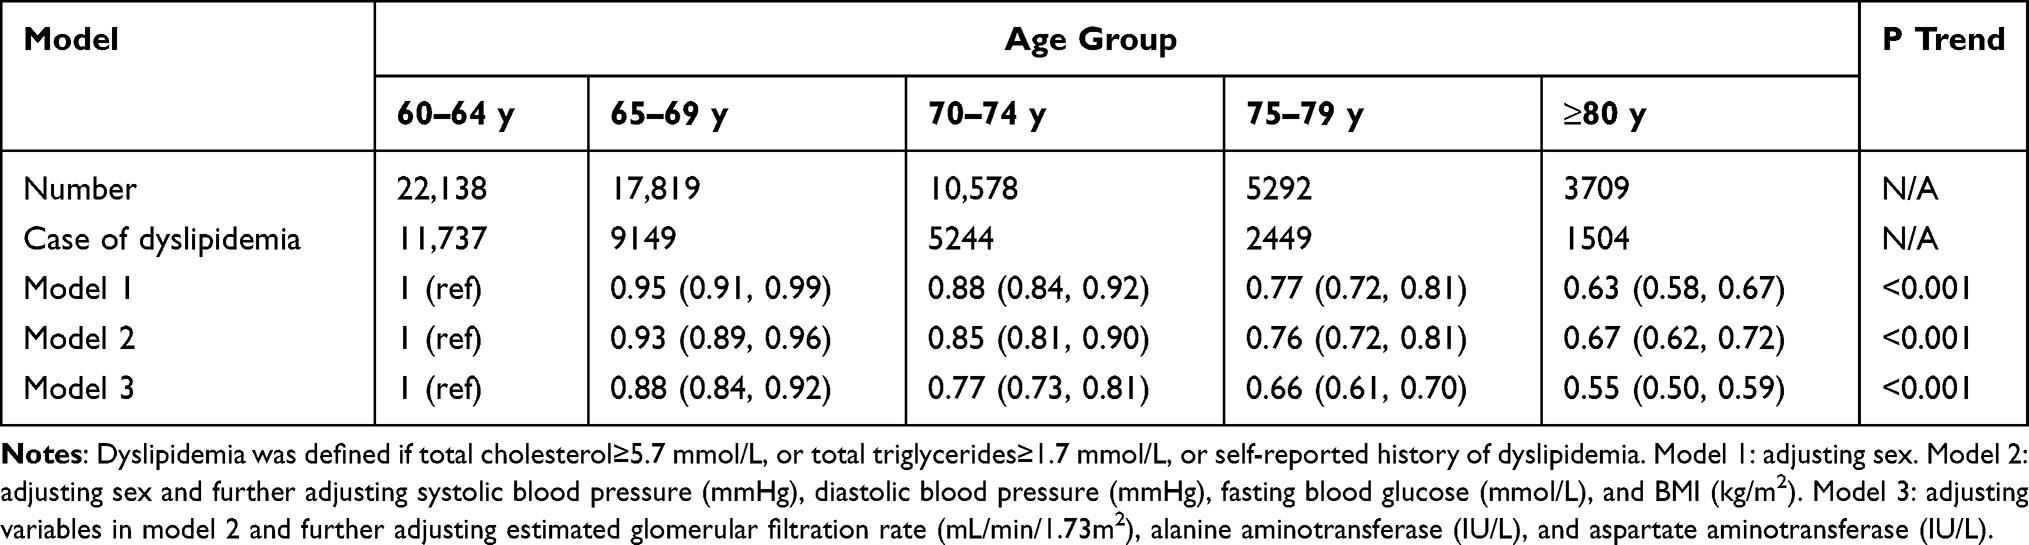 |
Table 2 The Association Between Age and the Risk of Dyslipidemia in 59,716 Chinese Aged Population: Multivariate Logistic Regression Analysis |
We further performed the association between chronological age and dyslipidemia in three sensitivity analyses (Table 3). The association was similar with main analysis after excluding participants with low body weight (n=1293) and overweight and obesity (n=34,272), excluding participants with high blood pressure (n=43,775) and history of hypertension (n=2975), excluding participants with high fasting blood glucose (n=15,667) and history of diabetes (n=594).
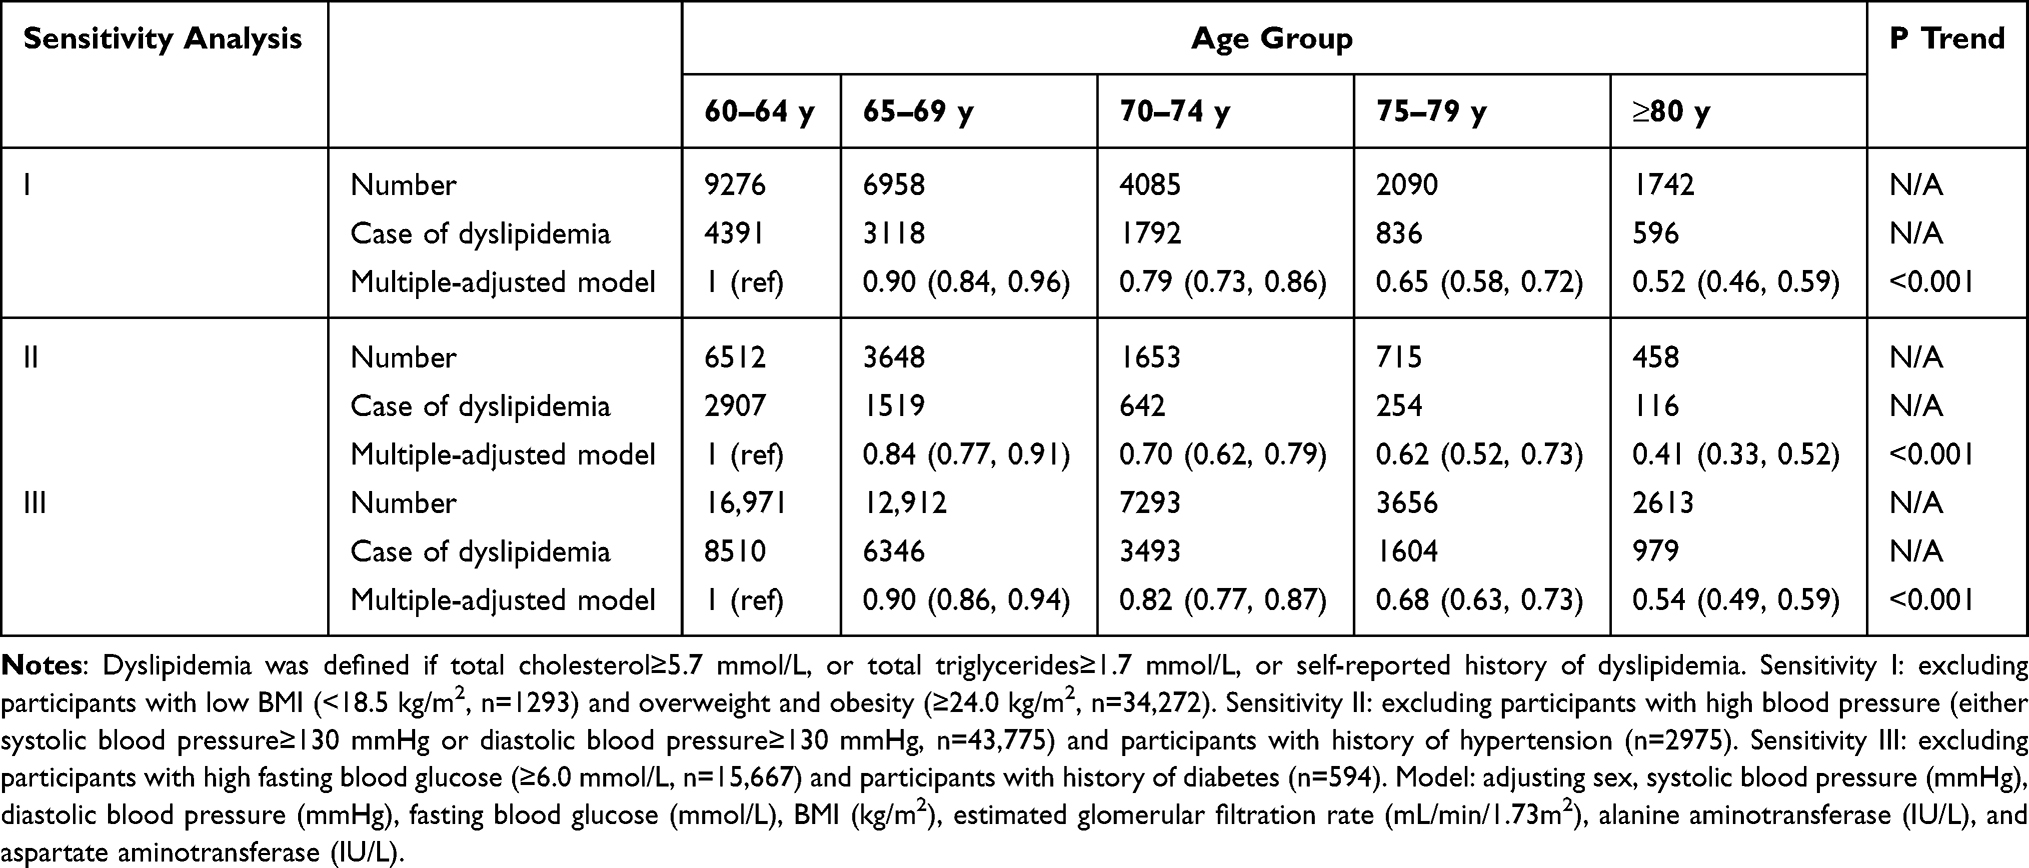 |
Table 3 The Association Between Age and the Risk of Dyslipidemia in Chinese Aged Population by Logistic Regression Model: Sensitivity Analysis |
Discussions
In the current cross-sectional study including 59,716 Chinese aged population, we found that chronological age was associated with a higher risk of dyslipidemia after adjusting for conventional risk factors for dyslipidemia, including BMI, sex, blood pressure, fasting blood glucose, and liver and renal function. With the increase in chronological age, the risk of dyslipidemia decreased.
Our study reported that the prevalence of dyslipidemia (confirmed by total cholesterol ≥5.7 mmol/L, or total triglycerides ≥1.7 mmol/L, or self-reported history of dyslipidemia) was 50.4%. Lu et al4 performed a national-wide cross-sectional study in 2,314,538 Chinese adults aged 35 to 75 years old and reported that the prevalence of dyslipidemia was 33.8%. Using data from the 2015 China National Stroke Screening and Prevention Project (CNSSPP), another cross-sectional study including 135,403 Chinese adults (≥40 years) reported that the prevalence of dyslipidemia was 42.7%.27 Another cross-sectional study performed in Chinese older adults (60–98 years old) reported that the prevalence of dyslipidemia was 56.8%.5 Our study, together with other studies, supported the conclusion that dyslipidemia in Chinese adults is very common, though it is lower than that in American adults.28
With the increase in age, the prevalence of overweight and obesity in elderly decreased while the prevalence of underweight increased in previous studies.29–31 A previous study including 2032 Mexican adults (≥50 year) reported that 0.6% of them was found to be underweight, 21.4% normal weight, 49.4% overweight, and 28.7% obesity.29 The study performed in Japanese older adults (≥50 year) reported that the prevalence of underweight was 8.6% and 9.7% in men and women, while the prevalence of overweight/obesity was 22.5% and 26.8% in men and women, respectively.30 The study from Korea reported that the prevalence of underweight was 3.5%, while overweight/obesity was 57.9%.31 Our study reported that the prevalence of underweight was 2.2%, while overweight/obesity was 57.4%. Another Brazilian study reported that the prevalence of underweight was 15.6%.32 It is obviously higher than that in our study (2.2% in our study vs 15.6% in Brazilian study). Economic status might be one of the possible reasons, because the participants were from Shanghai China, which is known as the most prosperous city in China. Another possible reason was the average age among different studies. The average age in our study is older than that in Mexican30 and Korean32 studies, while younger than that in Japanese study.31 Further, the prevalence of underweight doubled in participants aged 80 years or more, which indicated it remained important to make sure that aged population could get enough nutrition to maintain a healthy body weight.
Previous studies in general population found that with the increase in age, the prevalence of high TC, TG, and LDL-C raised simultaneously peaked at about 50- to 60-year-old, and then began to present a downward trend.5,12,14–17,33–36 This trend was similar in men with that in women.33 However, the results were inconsistent in aged population. One cross-sectional study reported concentrations of TC and TG decreased as chronological age increased, but the risk of high low-density-lipoprotein cholesterol (LDL-C) increased.5 Another cross-sectional study reported dyslipidemia was negatively associated with age in participants with abnormal glucose metabolism but not in those with non-diabetic participants.13 Our results supported the point that TC and TG decreased as age increased. Cohort studies are needed to further evaluate the association between changes in lipid profiles and events of cardiovascular diseases and even death.
The strength of the current study included a large sample size and adjustment of a series of risk factors for dyslipidemia. However, some limitations must be addressed. First of all, we cannot infer a causal relationship between chronological age and dyslipidemia because of the cross-sectional design. Similarly, we did not know whether the change in the concentration of lipid profiles could have some potential effects on cardiovascular events due to cross-sectional study design. Second, diet and physical activity, which were closely associated with the risk of dyslipidemia,37 were lost. However, we performed three sensitivity analysis, including excluding participants with overweight and obesity, with high blood pressure or with a history of hypertension, with abnormal fasting blood glucose or with a history of diabetes, because these participants were more likely to have imbalanced diet and sedentary behavior. We thus could not analyze the extent to which adjustment for diet and physical activity would have modified the association between chronological age and dyslipidemia. Third, all the participants were recruited from those who underwent health checkup in our hospital. Thus, the generalizability of study population was limited. Furthermore, Shanghai is known as the most prosperous city in China, this study population cannot represent people from other regions in China. Fourth, information on history of hypertension and diabetes were self-reported, we could not exclude the possibility of recall bias. Finally, we did not have the information on lipid-lowering drugs such as statin, which might cause distraction on the results and misclassification of dyslipidemia.
Conclusions
Chronological age was closely associated with the risk of dyslipidemia in Chinese aged population. As age increased, the levels of TC and TG gradually decreased. Because dyslipidemia is involved in the development of both atherosclerosis and cardiovascular events, a well-designed cohort study is necessary to elucidate the effects of change in lipid profiles on the risk of atherosclerosis and cardiovascular events.
Data Sharing Statement
Dr Renying Xu ([email protected]) had full access to all the data in the study and takes responsibility for the integrity of the data and the accuracy of the data analysis.
Acknowledgments
Qingyao Li and Ying Jiang are co-first authors. Yun Li and Renying Xu are co-correspondence authors.
Funding
There is no funding to report.
Disclosure
The authors report no conflicts of interest in this work.
References
1. Fuster V. Changing demographics: a new approach to global health care due to the aging population. J Am Coll Cardiol. 2017;69(24):3002–3005. doi:10.1016/j.jacc.2017.05.013
2. Liu S, Li Y, Zeng X, et al. Burden of cardiovascular diseases in China, 1990–2016: findings from the 2016 global burden of disease study. JAMA Cardiol. 2019;4(4):342–352. doi:10.1001/jamacardio.2019.0295
3. Li X, Wu C, Lu J, et al. Cardiovascular risk factors in China: a nationwide population-based cohort study. Lancet Public Health. 2020;5(12):e672–e81. doi:10.1016/S2468-2667(20)30191-2
4. Lu Y, Zhang H, Lu J, et al. Prevalence of dyslipidemia and availability of lipid-lowering medications among primary health care settings in China. JAMA Netw Open. 2021;4(9):e2127573. doi:10.1001/jamanetworkopen.2021.27573
5. Lin HQ, Wu JY, Chen ML, et al. Prevalence of dyslipidemia and prediction of 10-year CVD risk among older adults living in southeast coastal regions in China: a cross-sectional study. Clin Interv Aging. 2019;14:1119–1129. doi:10.2147/CIA.S207665
6. Song PK, Man QQ, Li H, et al. Trends in lipids level and dyslipidemia among Chinese Adults, 2002–2015. Biomed Environ Sci. 2019;32:559–570. doi:10.3967/bes2019.074
7. Wolf D, Ley K. Immunity and inflammation in atherosclerosis. Circ Res. 2019;124(2):315–327. doi:10.1161/CIRCRESAHA.118.313591
8. Reiner Ž. Hypertriglyceridaemia and risk of coronary artery disease. Nat Rev Cardiol. 2017;14(7):401–411. doi:10.1038/nrcardio.2017.31
9. Chen J, Zhu Q, Yu L, Li Y, Jia S, Zhang J. Stroke risk factors of stroke patients in China: a nationwide community-based cross-sectional study. Int J Environ Res Public Health. 2022;19:4807.
10. Aslam F, Haque A, Lee LV, Foody J. Hyperlipidemia in older adults. Clin Geriatr Med. 2009;25:591–606, vii. doi:10.1016/j.cger.2009.08.001
11. Lu Y, Wang P, Zhou T, et al. Comparison of prevalence, awareness, treatment, and control of cardiovascular risk factors in China and the United States. J Am Heart Assoc. 2018;7. doi:10.1161/JAHA.117.007462
12. Xi Y, Niu L, Cao N, et al. Prevalence of dyslipidemia and associated risk factors among adults aged >/=35 years in northern China: a cross-sectional study. BMC Public Health. 2020;20:1068. doi:10.1186/s12889-020-09172-9
13. Li Y, Zhao L, Yu D, Ding G, Hu C. The prevalence and risk factors of dyslipidemia in different diabetic progression stages among middle-aged and elderly populations in China. PLoS One. 2018;13(10):e0205709. doi:10.1371/journal.pone.0205709
14. Ni WQ, Liu XL, Zhuo ZP, et al. Serum lipids and associated factors of dyslipidemia in the adult population in Shenzhen. Lipids Health Dis. 2015;14:71. doi:10.1186/s12944-015-0073-7
15. Bayram F, Kocer D, Gundogan K, et al. Prevalence of dyslipidemia and associated risk factors in Turkish adults. J Clin Lipidol. 2014;8(2):206–216. doi:10.1016/j.jacl.2013.12.011
16. Mahmoud I, Sulaiman N. Dyslipidaemia prevalence and associated risk factors in the United Arab Emirates: a population-based study. BMJ Open. 2019;9(11):e031969. doi:10.1136/bmjopen-2019-031969
17. Gao H, Wang H, Shan G, et al. Prevalence of dyslipidemia and associated risk factors among adult residents of Shenmu City, China. PLoS One. 2021;16(5):e0250573. doi:10.1371/journal.pone.0250573
18. Hager MR, Narla AD, Tannock LR. Dyslipidemia in patients with chronic kidney disease. Rev Endocr Metab Disord. 2017;18(1):29–40. doi:10.1007/s11154-016-9402-z
19. Kong X, Ma Y, Chen J, et al. Evaluation of the chronic kidney disease epidemiology collaboration equation for estimating glomerular filtration rate in the Chinese population. Nephrol Dial Transplant. 2013;28(3):641–651. doi:10.1093/ndt/gfs491
20. Xu R, Cai H, Fan Z, Wan Y, Gao X. The change in kidney function was associated with carotid artery plaque in a community-based population: a cohort study. Nutr Metab Cardiovasc Dis. 2021;31(1):119–126. doi:10.1016/j.numecd.2020.08.016
21. Zhou B; Coorperative Meta-Analysis Group Of China Obesity Task F. 我国成人体重指数和腰围对相关疾病危险因素异常的预测价值 适宜体重指数和腰围切点的研究 [Predictive values of body mass index and waist circumference to risk factors of related diseases in Chinese adult population]. Zhonghua Liu Xing Bing Xue Za Zhi. 2002;23(1):5–10. Chinese.
22. Shibata Y, Ojima T, Nakamura M, et al. Associations of overweight, obesity, and underweight with high serum total cholesterol level over 30 years among the Japanese elderly: NIPPON DATA 80, 90, and 2010. J Epidemiol. 2019;29(4):133–138. doi:10.2188/jea.JE20170229
23. Kuwabara M, Kuwabara R, Niwa K, et al. Different risk for hypertension, diabetes, dyslipidemia, and hyperuricemia according to level of body mass index in Japanese and American subjects. Nutrients. 2018:10. doi:10.3390/nu11010010
24. Ramon-Arbues E, Martinez-Abadia B, Gracia-Tabuenca T, et al. Prevalencia de sobrepeso/obesidad y su asociación con diabetes, hipertensión, dislipemia y síndrome metabólico: estudio transversal de una muestra de trabajadores en Aragón, España [Prevalence of overweight/obesity and its association with diabetes, hypertension, dyslipidemia and metabolic syndrome: a cross-sectional study of a sample of workers in Aragon, Spain]. Nutr Hosp. 2019;36:51–59. Spain. doi:10.20960/nh.1980
25. Hurtubise J, McLellan K, Durr K, Onasanya O, Nwabuko D, Ndisang JF. The different facets of dyslipidemia and hypertension in atherosclerosis. Curr Atheroscler Rep. 2016;18:82. doi:10.1007/s11883-016-0632-z
26. Athyros VG, Doumas M, Imprialos KP, et al. Diabetes and lipid metabolism. Hormones. 2018;17:61–67. doi:10.1007/s42000-018-0014-8
27. Opoku S, Gan Y, Yobo EA, et al. Awareness, treatment, control, and determinants of dyslipidemia among adults in China. Sci Rep. 2021;11:10056. doi:10.1038/s41598-021-89401-2
28. Zhou J, Cai L, Ni S, et al. Associations of dietary PUFA with dyslipidaemia among the US adults: the findings from National Health and Nutrition Examination Survey (NHANES) 2009–2016. Br J Nutr. 2022;127:1386–1394. doi:10.1017/S0007114521002300
29. Rivas-Marino G, Negin J, Salinas-Rodriguez A, et al. Prevalence of overweight and obesity in older Mexican adults and its association with physical activity and related factors: an analysis of the study on global ageing and adult health. Am J Hum Biol. 2015;27:641–651. doi:10.1002/ajhb.22642
30. Tarui I, Okada E, Okada C, Saito A, Takimoto H. Trends in BMI among elderly Japanese population: findings from 1973 to 2016 Japan national health and nutrition survey. Public Health Nutr. 2020;23(11):1907–1915. doi:10.1017/S1368980019004828
31. Shin HY, Kang HT. Recent trends in the prevalence of underweight, overweight, and obesity in Korean adults: the Korean national health and nutrition examination survey from 1998 to 2014. J Epidemiol. 2017;27:413–419. doi:10.1016/j.je.2016.08.014
32. Francisco P, Assumpcao D, Borim FSA, Malta DC. Prevalence and factors associated with underweight among Brazilian older adults. Cien Saude Colet. 2019;24(7):2443–2452. doi:10.1590/1413-81232018247.21512017
33. Opoku S, Gan Y, Fu W, et al. Prevalence and risk factors for dyslipidemia among adults in rural and urban China: findings from the China National Stroke Screening and prevention project (CNSSPP). BMC Public Health. 2019;19(1):1500. doi:10.1186/s12889-019-7827-5
34. Qi L, Ding X, Tang W, Li Q, Mao D, Wang Y. Prevalence and risk factors associated with dyslipidemia in Chongqing, China. Int J Environ Res Public Health. 2015;12(10):13455–13465. doi:10.3390/ijerph121013455
35. Sun G-Z, Li Z, Guo L, Zhou Y, Yang H-M, Sun Y-X. High prevalence of dyslipidemia and associated risk factors among rural Chinese adults. Lipids Health Dis. 2014;13(1):189. doi:10.1186/1476-511X-13-189
36. Gu T, Zhou W, Sun J, Wang J, Zhu D, Bi Y. Gender and age differences in lipid profile among Chinese adults in Nanjing: a retrospective study of over 230,000 individuals from 2009 to 2015. Exp Clin Endocrinol Diabetes. 2018;126(07):429–436. doi:10.1055/s-0043-117417
37. Guo Q, Ma Z, Zhu C, Zeng Q. Dietary diversity and physical activity associations with lipid indices among Beijingese: a cross-sectional study. Asia Pac J Clin Nutr. 2020;29(3):628–637. doi:10.6133/apjcn.202009_29(3).0023
 © 2023 The Author(s). This work is published and licensed by Dove Medical Press Limited. The
full terms of this license are available at https://www.dovepress.com/terms
and incorporate the Creative Commons Attribution
- Non Commercial (unported, 3.0) License.
By accessing the work you hereby accept the Terms. Non-commercial uses of the work are permitted
without any further permission from Dove Medical Press Limited, provided the work is properly
attributed. For permission for commercial use of this work, please see paragraphs 4.2 and 5 of our Terms.
© 2023 The Author(s). This work is published and licensed by Dove Medical Press Limited. The
full terms of this license are available at https://www.dovepress.com/terms
and incorporate the Creative Commons Attribution
- Non Commercial (unported, 3.0) License.
By accessing the work you hereby accept the Terms. Non-commercial uses of the work are permitted
without any further permission from Dove Medical Press Limited, provided the work is properly
attributed. For permission for commercial use of this work, please see paragraphs 4.2 and 5 of our Terms.