Back to Journals » Cancer Management and Research » Volume 13
The Assessment of Prostate Cancer Aggressiveness Using a Combination of Quantitative Diffusion-Weighted Imaging and Dynamic Contrast-Enhanced Magnetic Resonance Imaging
Authors Zhu G, Luo J, Ouyang Z, Cheng Z, Deng Y, Guan Y, Du G, Zhao F
Received 8 May 2021
Accepted for publication 18 June 2021
Published 2 July 2021 Volume 2021:13 Pages 5287—5295
DOI https://doi.org/10.2147/CMAR.S319306
Checked for plagiarism Yes
Review by Single anonymous peer review
Peer reviewer comments 2
Editor who approved publication: Professor Seema Singh
Guangbin Zhu,1,* Jinwen Luo,1,* Zhongmin Ouyang,1 Zenglan Cheng,1 Yi Deng,1 Yubao Guan,1 Guoxin Du,1 Fengjin Zhao2
1Guangzhou Key Laboratory of Enhanced Recovery after Abdominal Surgery, Department of Radiology, The Fifth Affiliated Hospital of Guangzhou Medical University, Guangzhou, 510799, People’s Republic of China; 2Department of Urology, The Fifth Affiliated Hospital of Guangzhou Medical University, Guangzhou, 510799, People’s Republic of China
*These authors contributed equally to this work
Correspondence: Zhongmin Ouyang
Guangzhou Key Laboratory of Enhanced Recovery after Abdominal Surgery, Department of Radiology, The Fifth Affiliated Hospital of Guangzhou Medical University, No. 621 of Gangwan Road, Huangpu District, Guangzhou, 510799, People’s Republic of China
Tel +86-20-85959142
Email [email protected]
Objective: To explore the value of combining dynamic contrast-enhanced magnetic resonance imaging (DCE-MRI) quantitative parameters with apparent diffusion coefficient (ADC) values in the diagnosis of prostate cancer.
Methods: The clinical data of 146 patients with prostate lesions, including 87 patients with prostate cancer (PCa) and 59 with benign prostatic hyperplasia (BPH), were collected. After DCE-MRI and diffusion-weighted imaging (DWI) prostate scans, the magnitude of the DCE-MRI transfer constant (Ktrans), rate constant (kep), the volume of the extravascular extracellular space (ve), and the ADC between the groups were compared, and the correlations between the DCE-MRI parameters and Gleason scores were analyzed. The diagnostic efficacy of these quantitative parameters was assessed by the area under the receiver operating characteristic (ROC) curve.
Results: The DCE-MRI parameters Ktrans and kep were significantly greater in the PCa group than in the BPH group (p < 0.05). The ROC curve showed the area under the Ktrans, kep, and ADC curves to be 0.665, 0.658, and 0.782, respectively. When all three quantitative indicators were combined, the area under the ROC curve was 0.904, with sensitivity and specificity rates of 83.6% and 93.7%, respectively. The Gleason scores were positively correlated with the Ktrans, kep, and ve (r = 0.39, 0.572, 0.30, respectively; p < 0.05) and negatively correlated with the ADC (r = – 0.525; p < 0.05).
Conclusion: The DCE-MRI quantitative parameters Ktrans and kep, as well as the ADC value, provided effective references for the differential diagnosis of PCa and BPH, as well as more precise and reliable quantitative parameters for grading the aggressiveness of PCa.
Keywords: quantitative DWI, dynamic contrast-enhanced MRI, ADC value, Ktrans, kep, benign prostatic hyperplasia, prostate cancer
Introduction
Benign prostatic hyperplasia (BPH) and prostate cancer (PCa) are urogenital system diseases that are common among elderly males. Needle biopsies through the rectum guided by transrectal ultrasound (TRUS) are the gold standard for diagnosing PCa. The positivity rates remain high even in repeated needle biopsies for cases that have undergone extensive needle biopsies. However, over- and missed diagnoses of inert tumors remain an issue in clinical settings. Using multiparametric magnetic resonance imaging (MP-MRI) to triage men may allow 27% of patients to avoid a primary biopsy and diagnose 5% fewer clinically insignificant cancers.1 If subsequent TRUS biopsies were guided by MP-MRI findings, rather than the standard pathway of TRUS biopsy for all, up to 18% more cases of clinically significant cancer may be detected.1,2 Used as a triage test before the first prostate biopsy, MP-MRI could reduce unnecessary biopsies by 25%. It could also reduce the overdiagnosis of clinically insignificant PCa and improve the detection of clinically significant cancer.
Generally, multiparametric-MRI (mp-MRI) is the most accurate form of medical imaging for the diagnosis, localization, and staging of PCa, where T2-weighted sequences can show foci with low signal intensity in the peripheral zone.3–6 However, many pathological symptoms, eg, post-biopsy bleeding and prostatitis, calcification, and fibrosis after hormonal or radiation therapy, also present as lesions with low signal intensities similar to PCa, which increases the difficulty of differential diagnosis. Dynamic contrast-enhanced (DCE)-MRI can obtain dynamic information on the distribution of the contrast agent in the blood and its movement in and out of blood vessels, reflecting quantitative hemodynamic parameters such as tumor microcirculation and perfusion. Furthermore, diffusion-weighted imaging (DWI) can non-invasively measure the diffusion of water molecules in tissue. The apparent diffusion coefficient (ADC) value is also more reflective of the diffusion properties of water molecules than directly obtained b-value images.4,5
This paper retrospectively analyzes the DCE-MRI and DWI scans of 146 pathologically confirmed cases of prostatic lesions. The value of the ADC and the parameters of perfusion-weighted imaging in diagnosing benign/malignant prostate lesions are examined to boost the accuracy of PCa diagnoses. Based on the Gleason score, patients with aggressive PCa are divided into three groups, ie, primary (Gleason score [GS] ≤ 6), secondary (GS = 3 + 4 or 4 + 3), and tertiary (GS ≥ 8) groups. The correlations of the above parameters with the Gleason scores are analyzed to provide more precise and reliable quantitative parameters for distinguishing malignant prostate tumors.
Materials and Methods
Study Population
Based on standardized MRI scans, needle prostate biopsies, and pre-operative PSA blood levels, we collected data on the pathological diagnoses of 146 hospital patients presenting with hematuria, dysuria, renal retention, and other relevant symptoms between May 2017 and September 2020. These cases were divided into two groups, the PCa and the BPH group. Based on the Gleason score, the PCa patients were divided into three groups: primary (GS ≤ 6), secondary (GS = 3 + 4 or 4 + 3), and tertiary (GS ≥ 8) groups. The participant inclusion criteria for the study were as follows: (1) a complete clinical history and MRI scans that are adequate for quantitative analysis of the ADC; (2) no previous needle biopsy, surgery, radiotherapy, or endocrine therapy prior to completing the prostate MRI; (3) prostate biopsies performed within four weeks of the MRI scan; (4) patients met the clinical research approval criteria set by the ethics committee and signed informed consent letters for inclusion in the study.
All cases in this study were patients of the Fifth Affiliated Hospital of Guangzhou Medical University (Guangzhou, China). The images were obtained from the radiology department’s Picture Archiving and Communications System (PACS). The study was conducted according to the guidelines of the Declaration of Helsinki, and approved by the Institutional Review Board of Fifth Affiliated Hospital of Guangzhou Medical University (KY01-2018-10-14). Written informed consent was obtained from all participants.
Magnetic Resonance Imaging Data Acquisition
The MRI examinations were performed using 3 Tesla MRI scanners (Siemens Magnetom Skyra, Germany) with pelvic-phased array coils. The patients were scanned in the supine position, and the scanning range included the prostate and seminal vesicle. Anatomical high resolution T2-weighted images (T2WIs) were acquired in the transaxial plane using turbo spin-echo (TR/TE = 8869/120 ms, echo train length = 26, field of view [FOV] = 140 mm, reconstruction matrix size = 512 × 512, slice thickness = 3 mm. Transverse diffusion-weighted images were obtained using a single-shot spin-echo/echo-planar imaging sequence with the following parameters: 3400/117 and b-values of 0 and 1000 sec/mm2. The corresponding ADC maps were calculated automatically (using b-values of 0 and 1000 s/mm2).
The patients were injected with a high-pressure bolus of gadodiamide (Omniscan) in an upper extremity vein at a dose of 0.1 mmol/kg and flow rate of 2.5 mL/s using a high-pressure injector (Tennessee XD2003, Ulrich, Germany), followed by a 20-mL saline flush injected at the same rate. Transverse contrast-enhanced three-dimensional (3D)-volume-interpolated body examination sequences of the upper abdomen were acquired during suspended respiration 20 seconds after the contrast injection. The acquisition time was 13 seconds, and a total of 16 acquisitions were made with the following parameters: TR = 17 ms, TE = 1.6 ms, slice thickness = 3.0 mm, interslice gap = 0 mm, matrix = 224 × 224, FOV = 230×230 mm, flip angle = 15°.
For each patient, ADC maps were automatically generated from the DW images on the scanner, and the DCE-MRI data were processed using a commercially available software workstation system (Syngo Multimodality Workplace, Siemens®). The DCE-MRI pharmacokinetic parameters (volume transfer constant [Ktrans], reflux rate [kep], and volume fraction of the extravascular extracellular matrix [ve]) were estimated by fitting the standard Tofts model to the concentration–time curves.
The regions of interest (ROIs) of the ADC map, Ktrans, kep, and ve, were adjusted according to the shape and size of the lesions on the T2WIs. Additionally, the mean values of three consecutive images of each lesion were calculated. After the subject order was randomized to avoid bias, the measurement of all the parameters was performed by a radiologist with five years of experience.
Statistical Analyses
All statistical analyses were performed with statistical software (SPSS Statistics 23.0 for Windows). The values were recorded as the mean ± standard deviation. The DCE-MRI Ktrans, kep, ve, and ADC values for the two groups were compared. Levene’s test was used to evaluate the equality of variances for the data from each group. If the variances were equal, comparisons were made using the two-sample t-test. Otherwise, comparisons were made using the Mann–Whitney U-test. The significance level was set as p < 0.05. The receiver operating characteristic (ROC) curve was used to analyze the diagnostic efficacy of the various parameters. A logistic regression analysis and the ROC curve were used to evaluate the combined diagnostic efficacy.
Based on the Gleason score, the patients with aggressive PCa were divided into the primary, secondary, and tertiary groups, as previously stated. The correlations between the above parameters and Gleason scores were analyzed and p < 0.05 was considered to indicate a significant difference. Pearson’s correlation was performed between the MRI parameters, and Spearman correlation coefficient was performed when correlating with the Gleason scores.
Results
Patient and Tumor Characteristics
A total of 146 patients were included in this study. The mean age was 64.21 ± 14.31 years, with the oldest and youngest being 84 and 45 years old, respectively. The time between MRI and biopsy was 11 days on average (ranging from 2 to 24 days). The BPH group included 59 patients and the PCa group included 87. Among the 87 patients of the PCa group, 28 were in the primary group (GS ≤ 6), 34 were in the secondary group (GS = 3 + 4 or 4 + 3), and 25 were in the tertiary group (GS ≥ 8). For 13 patients, PCa foci were present only in the central zone. In 74 cases, the foci were located in the peripheral zone or involved multiple regions, making it impossible to identify the primary site. The PCa foci had spread to one or both seminal vesicles in 26 cases, to the bladder, rectum, obturator internus muscle, and pelvic lymph nodes in 14 cases, and the bone in 9 cases.
Comparison of Prostate Apparent Diffusion Coefficient Value and Contrast-Enhanced Magnetic Resonance Imaging Quantitative Perfusion Parameters
According to the pathological findings, as the b-value increased, the DWI signal intensity increased in the PCa group, and the ADC was significantly lower in tumors than in normal prostates (Table 1). The changes in the DWI signal intensity were not statistically significant in the BPH group. The ADC values presented as high signal intensities or showed no significant differences from the signal intensities of the surrounding tissue. Invasion of PCa into the central zone and seminal vesicles presented as high signal intensities in the DWI scans but low signal intensities in the ADC maps (Figure 1).
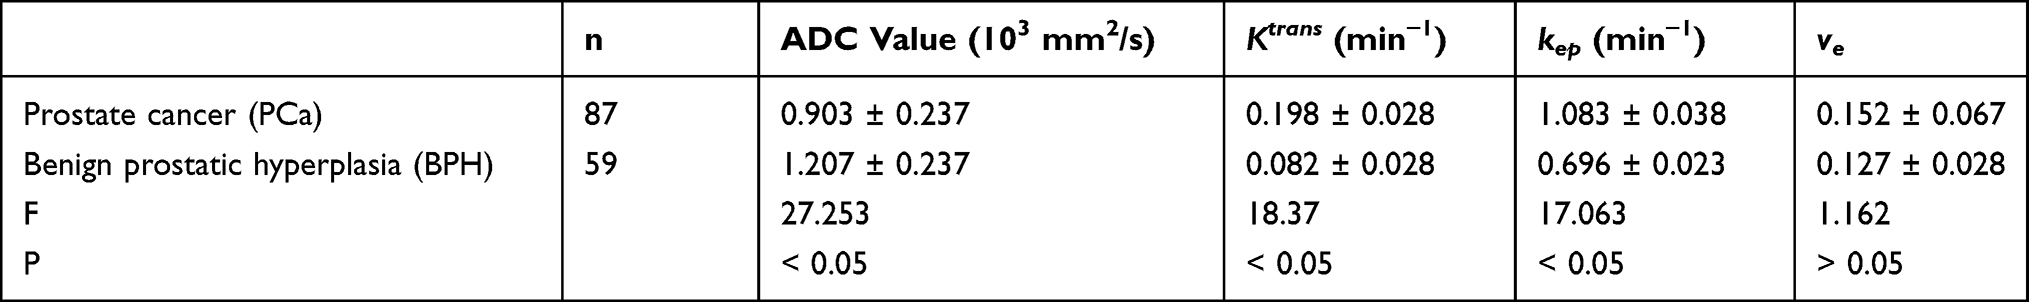 |
Table 1 Comparison of the ADC Values and DCE-MRI Parameters for the PCa and BPH Groups |
 |
Figure 1 A 56-year-old male presenting with urological symptoms such as frequent/urgent micturition. (A) The T2-weighted images showing lower signal intensity in parts of the left lobe of the prostate; (B) the diffusion-weighted imaging (b-value = 1000 s/mm2), showing a somewhat higher signal intensity; (C) the apparent diffusion coefficient map showing somewhat lower signal intensity; (D) the dynamic contrast-enhanced scan delineating the region of interest; (E) the signal–time curve, presenting the outflow type; (F–H) the Toft pharmacokinetic model quantitative analysis of the dynamic contrast-enhanced magnetic resonance imaging transfer constant, rate constant, and the volume of the extravascular extracellular space, presented as pseudocolored images. (I) the needle biopsy pathology report suggesting prostate acinar adenocarcinoma; Gleason score, 3 + 4 = 7. |
The ADC values were significantly lower for the PCa group than the BPH and control groups (p < 0.05). Among the DCE-MRI parameters, the Ktrans and kep were distinctly higher in the PCa group compared with the BPH group at a statistically significant level (p < 0.05). The difference between the ve values was not statistically significant (p > 0.05). An analysis of the diagnostic efficacy based on the ROC curves showed the area under the Ktrans, kep, and ADC curves was 0.665, 0.658, and 0.782, respectively. When all three quantitative indicators were combined, the area under the ROC curve was 0.904, with sensitivity and specificity rates of 83.6% and 93.7%, respectively (Figure 2).
 |
Figure 2 The receiver operating characteristic curves for prostate cancer diagnosis using the prostate apparent diffusion coefficient values and dynamic contrast-enhanced magnetic resonance imaging transfer constant and rate constant parameters. |
Correlation of the Apparent Diffusion Coefficient, Dynamic Contrast-Enhanced Magnetic Resonance Imaging Transfer Constant, Rate Constant, and the Volume of the Extravascular Extracellular Space Values with the Gleason Score
Among the 87 patients of the PCa group, 28 had a GS ≤6, 34 a GS of 3 + 4 or 4 + 3, and 25 had a GS of ≥8. The Gleason score had a strong negative correlation with the ADC (r = –0.525, p < 0.05), a strong positive correlation with the Ktrans (r = 0.39, p < 0.05), a moderate positive correlation with the kep (r = 0.572, p < 0.05), and a positive correlation with the ve (r = 0.30, p < 0.05, Table 2).
 |
Table 2 ADC, Ktrans, Kep, and Ve Values for Different PCa Sub-Groups (x ± s) |
The Logistic Regression Model for Prostate Cancer Apparent Diffusion Coefficient and Dynamic Contrast-Enhanced Magnetic Resonance Imaging Quantitative Perfusion Parameters and Its Efficacy
Using a univariate analysis, the statistically significant factors were selected as independent variables, with the BPH and PCa lesions as dependent variables. A bivariate logistic regression analysis of the ADC and DCE-MRI perfusion parameters was performed, and the results are shown in Table 3. Among these parameters, there was no statistically significant difference in the ve between the BPH and PCa patients, while the ADC, Ktrans, and kep were statistically significant independent predictors of malignant prostate lesions, based on the following results: P = ex/(1 + ex), x = –17.411 – (–6.110 × ADC) + (39.501 × Ktrans) + (24.521 × kep), where e is the natural logarithm. This equation was subsequently used to determine the likelihood of diagnosing malignant prostate lesions and to plot the ROC curve (Figure 3). The area under the curve was 0.991. The degree of sensitivity was 98.7% and the specificity was 93.22%. The best cut-off variable was 0.38 (p < 0.01).
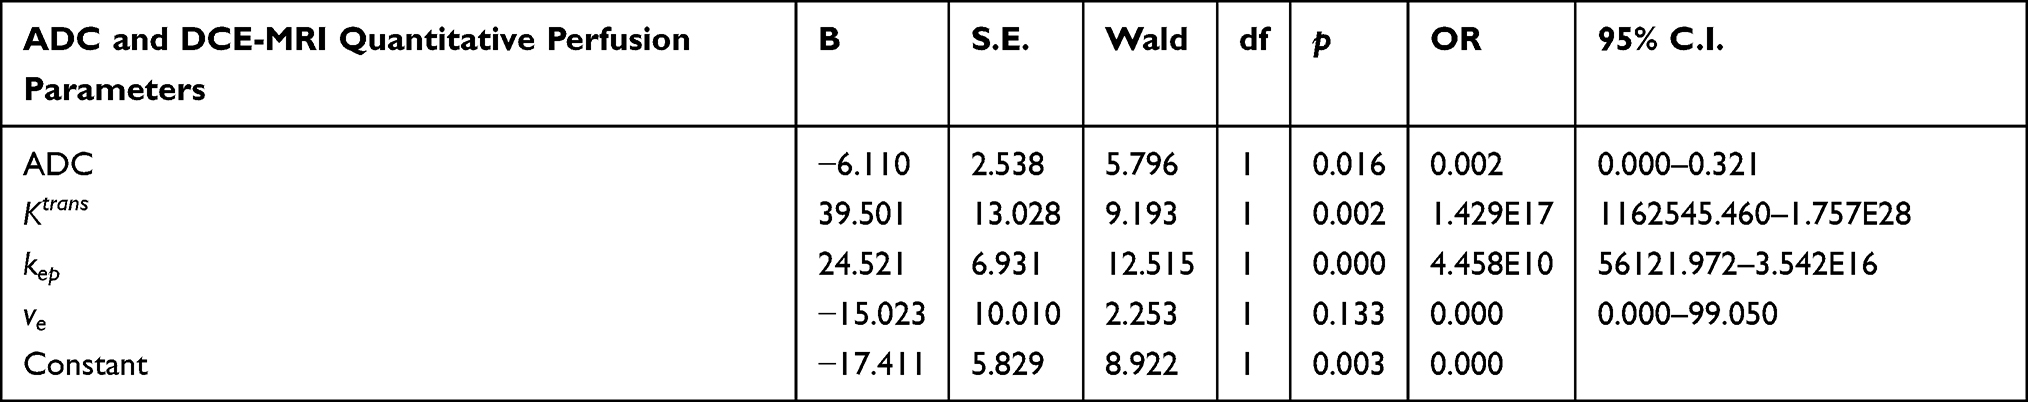 |
Table 3 Bivariate Logistic Regression Analysis of ADC and DCE-MRI Perfusion Parameters |
 |
Figure 3 The relationship between the different prostate cancer grades and dynamic contrast-enhanced magnetic resonance imaging quantitative perfusion parameters and apparent diffusion coefficient. |
Discussion
Overall, DWI can detect directional differences in the diffusion of water molecules, as well as microscopic changes at the cellular level.3–7 The cell density in a tumor is related to the diffusion of water molecules. Fast-growing and aggressive tumors can cause obvious restrictions in DWI scans, yielding an ADC value that can help to evaluate the biology of the tumors. In this study, b-values of 0 and 1000 s/mm2 were selected, which allowed the DWI scans to yield a more accurate ADC and ensured the image quality. Based on the DWI and T2WI scans, ROIs were delineated, and the ADC value was measured. The ADC was significantly lower in the PCa than in the BPH group (p < 0.05). The area under the ADC curve was 0.796, with a sensitivity and specificity of 70.1% and 89.1%, respectively. The ADC value was also lower in the tertiary PCa group (Gleason score, (SC) > 7) than in the lower-grade groups and negatively correlated with the Gleason scores, suggesting that it could serve as a good reference when diagnosing and grading the aggressiveness of PCa.
Angiogenesis in PCa tissue is closely related to the growth and metastasis of cancer cells. High blood vessel perfusion promotes tumor cell growth, infiltration, and peripheral metastasis. A DCE-MRI scan can dynamically detect the process, whereby the contrast agent enters the tumor tissue and passes in and out of blood vessels, thus reflecting the blood vessel distribution, density, and blood perfusion in the lesion. Tofts established a two-compartment pharmacokinetic model based on the gadodiamide concentration–time curve, allowing for the quantitative analysis of parameters such as Ktrans, kep, and ve. The Ktrans reflects the uptake of the contrast agent, which is affected by the combined effect of tissue blood flow and permeability. Greater levels of perfusion and permeability in tumor tissue are indicated by a higher Ktrans value, suggesting a higher degree of malignancy.8–14 The kep is a parameter that reflects the return of the contrast agent to the blood vessel, while the ve indicates the volume of extracellular space outside the tumor’s blood vessels.
The results of this study showed that the Ktrans and kep values were significantly higher in the PCa group than in the BPH group. The reason for this may be because greater tumor aggressiveness leads to increased neovascularization, vascular permeability, and growth. The rapid growth of blood vessels causes the endothelial cell space to become significantly larger than the surrounding normal vascular endothelial space, leading to a significant increase in the Ktrans and kep. Meanwhile, although the blood perfusion in the areas around a BPH lesion increases somewhat compared with that of normal tissue, there are fewer changes to the vascular structure and endothelial cell space. Therefore, changes in the Ktrans and kep are not significant. Moreover, ve is the interstitial volume fraction. The differences in the ve values between the groups in this instance were not statistically significant, possibly due to factors such as spatiotemporal distributional imbalances in blood flow, EES and tissue hydrostatic pressure, and ischemic score, leading to variability in the values.
The correlation analysis between the Gleason scores and Ktrans, kep, and ve showed that the former had a strong positive correlation with the Ktrans (r = 0.39, p < 0.05), a moderate positive correlation with the kep (r = 0.572, p < 0.05), and a positive correlation with the ve (r = 0.30, p < 0.05). The areas under the Ktrans, kep, and ADC curves were 0.665, 0.658, and 0.782, respectively. When all three quantitative indicators were combined, the area under the ROC curve was 0.904, with sensitivity and specificity rates of 83.6% and 93.7%, respectively, indicating a significant increase in the diagnostic efficacy.
Our study included some limitations. First, PSA levels are an important clinical indicator when screening for PCa. As the patients underwent several blood tests for PSA levels once they had been admitted, with relatively large differences in the results, we did not explore the correlation between the PSA levels and relevant quantitative imaging indicators. Second, in delineating the tumor ROI, we only took the average value of the largest slice on the horizontal axis into account to facilitate clinical operability, which involved a certain level of subjectivity. Third, our study divided the PCa cases into primary, secondary, and tertiary grades, based on the Gleason scores; however, it did not compare the MR parameters between the cases with GS = 3 + 4 and GS = 4 + 3. Fourth, the pathology results were primarily obtained through prostate needle biopsies. Few large pathological specimens were obtained after radical prostatectomy, making it impossible to eliminate the risk that high-grade regions had been missed. Furthermore, the joint diagnostic efficacy of the prostate ADC, Ktrans, kep, and perfusion parameters was somewhat lower than that reported in relevant Chinese studies, which may be related to the higher age of the patients included in our study, who also happened to present with symptoms of hematuria, dysuria, and renal retention.
In conclusion, in addition to routine physical examinations and PSA blood tests, the DCE-MRI quantitative parameters Ktrans and kep, together with ADC values, could better reflect the characteristics of blood perfusion and water molecule diffusion in the regions around PCa lesions, while also having a relatively strong level of correlation with Gleason scores. The Ktrans, kep, and ADC values had a relatively high diagnostic value in the identification of malignant prostate lesions and could provide more precise and reliable quantitative parameters for grading the aggressiveness of PCa.
Institutional Review Board Statement
The study was conducted according to the guidelines of the Declaration of Helsinki, and approved by the Institutional Review Board of Fifth Affiliated Hospital of Guangzhou Medical University (KY01-2018-10-14). Written informed consent was obtained from all participants.
Funding
The study was supported by the Key Technology Research Project of Guangzhou Science, Technology and Innovation Committee (No. 201902020001); National Science and Technology Major Project of China (No. 2020ZX09201026), and the Guangzhou Science and Technology project (No. 201905010004).
Disclosure
The authors declare no conflicts of interest for this work.
References
1. Radtke JP, Wiesenfarth M, Kesch C, et al. Combined clinical parameters and multiparametric magnetic resonance imaging for advanced risk modeling of prostate cancer-patient-tailored risk stratification can reduce unnecessary biopsies. Eur Urol. 2017;72(6):888–896. doi:10.1016/j.eururo.2017.03.039
2. Mehralivand S, Bednarova S, Shih JH, et al. Prospective evaluation of PI-RADS™ version 2 Using the International Society of Urological Pathology Prostate Cancer Grade Group System. J Urol. 2017;198(3):583–590. doi:10.1016/j.juro.2017.03.131
3. De Visschere P, Lumen N, Ost P, Decaestecker K, Pattyn E, Villeirs G. Dynamic contrast-enhanced imaging has limited added value over T2-weighted imaging and diffusion-weighted imaging when using PI-RADSv2 for diagnosis of clinically significant prostate cancer in patients with elevated PSA. Clin Radiol. 2017;72(1):23–32. doi:10.1016/j.crad.2016.09.011
4. Roethke MC, Kuder TA, Kuru TH, et al. Evaluation of diffusion kurtosis imaging versus standard diffusion imaging for detection and grading of peripheral zone prostate cancer. Invest Radiol. 2015;50(8):483–489. doi:10.1097/RLI.0000000000000155
5. Hötker AM, Mazaheri Y, Aras Ö, et al. Assessment of prostate cancer aggressiveness by use of the combination of quantitative DWI and dynamic contrast-enhanced MRI. AJR Am J Roentgenol. 2016;206(4):756–763. doi:10.2214/AJR.15.14912
6. Dong Y, Feng Q, Yang W, et al. Preoperative prediction of sentinel lymph node metastasis in breast cancer based on radiomics of T2-weighted fat-suppression and diffusion-weighted MRI. Eur Radiol. 2018;28(2):582–591. doi:10.1007/s00330-017-5005-7
7. Rozenberg R, Thornhill RE, Flood TA, Hakim SW, Lim C, Schieda N. Whole-tumor quantitative apparent diffusion coefficient histogram and texture analysis to predict gleason score upgrading in intermediate-risk 3 + 4 = 7 prostate cancer. AJR Am J Roentgenol. 2016;206(4):775–782. doi:10.2214/AJR.15.15462
8. Shiradkar R, Ghose S, Jambor I, et al. Radiomic features from pretreatment biparametric MRI predict prostate cancer biochemical recurrence: preliminary findings. J Magn Reson Imaging. 2018;48(6):1626–1636. doi:10.1002/jmri.26178
9. Donato P, Morton A, Yaxley J, et al. Improved detection and reduced biopsies: the effect of a multiparametric magnetic resonance imaging-based triage prostate cancer pathway in a public teaching hospital. World J Urol. 2020;38(2):371–379. doi:10.1007/s00345-019-02774-y
10. Beyhan M, Sade R, Koc E, Adanur S, Kantarci M. The evaluation of prostate lesions with IVIM DWI and MR perfusion parameters at 3T MRI. Radiol Med. 2019;124(2):87–93. doi:10.1007/s11547-018-0930-3
11. Pesapane F, Patella F, Fumarola EM, et al. Intravoxel incoherent motion (IVIM) diffusion weighted imaging (DWI) in the periferic prostate cancer detection and stratification. Med Oncol. 2017;34(3):35. doi:10.1007/s12032-017-0892-7
12. Bao J, Wang X, Hu C, Hou J, Dong F, Guo L. Differentiation of prostate cancer lesions in the transition zone by diffusion-weighted MRI. Eur J Radiol Open. 2017;4:123–128. doi:10.1016/j.ejro.2017.08.003
13. Bray F, Ferlay J, Soerjomataram I, Siegel RL, Torre LA, Jemal A. Global cancer statistics 2018: GLOBOCAN estimates of incidence and mortality worldwide for 36 cancers in 185 countries. CA Cancer J Clin. 2018;68(6):394–424. Erratum in: CA Cancer J Clin. 2020;70(4):313. doi:10.3322/caac.21492
14. Sanz-Requena R, Martí-Bonmatí L, Pérez-Martínez R, García-Martí G. Dynamic contrast-enhanced case-control analysis in 3T MRI of prostate cancer can help to characterize tumor aggressiveness. Eur J Radiol. 2016;85(11):2119–2126. doi:10.1016/j.ejrad.2016.09.022
 © 2021 The Author(s). This work is published and licensed by Dove Medical Press Limited. The
full terms of this license are available at https://www.dovepress.com/terms
and incorporate the Creative Commons Attribution
- Non Commercial (unported, 3.0) License.
By accessing the work you hereby accept the Terms. Non-commercial uses of the work are permitted
without any further permission from Dove Medical Press Limited, provided the work is properly
attributed. For permission for commercial use of this work, please see paragraphs 4.2 and 5 of our Terms.
© 2021 The Author(s). This work is published and licensed by Dove Medical Press Limited. The
full terms of this license are available at https://www.dovepress.com/terms
and incorporate the Creative Commons Attribution
- Non Commercial (unported, 3.0) License.
By accessing the work you hereby accept the Terms. Non-commercial uses of the work are permitted
without any further permission from Dove Medical Press Limited, provided the work is properly
attributed. For permission for commercial use of this work, please see paragraphs 4.2 and 5 of our Terms.