")
Back to Archived Journals » Journal of Vascular Diagnostics and Interventions » Volume 4
The advent of ultrafast ultrasound in vascular imaging: a review
Authors Couade M
Received 15 October 2015
Accepted for publication 24 November 2015
Published 2 May 2016 Volume 2016:4 Pages 9—22
DOI https://doi.org/10.2147/JVD.S68045
Checked for plagiarism Yes
Review by Single anonymous peer review
Peer reviewer comments 3
Editor who approved publication: Dr Rahmi Oklu
Mathieu Couade
SuperSonic Imagine, Aix en Provence, France
Abstract: In the last 10 years the advent of computational power and the availability of fully programmable research ultrasound imaging systems have allowed the emergence of ultrafast ultrasound imaging (<1000 frames per second), which has become a central research topic in the ultrasound community. Ultrafast ultrasound imaging relies deeply on the capability of massive parallel beamforming/processing of a single transmit ultrasound event insonifying a large field of view. This ultrafast acquisition capability opens up new tradeoffs in terms of processing and observations of transient rapid phenomena. Firstly, it can be used to improve conventional imaging modes such as B-mode, Doppler modes, Contrast Enhanced Ultrasound in terms of sensitivity, contrast, spatial, and/or temporal resolutions. It can also enrich conventional color flow imaging modes by providing quantitative and synchronous spectral information on the whole image. Secondly it can be used to capture transient phenomena that where unseen with conventional frame rates (<50 Hz) enabling completely novel imaging modes such as real time shear wave elastography (SWE),
a technique for mapping quantitatively soft tissue elasticities, or ultrafast PWV, a technique for measuring locally the pulse wave velocity (PWV). In this review, we first introduce the theoretical basis of ultrafast imaging. We then present a state of the art of ultrafast ultrasound imaging in the specific field of arterial wall mechanical properties characterization.
Keywords: ultrafast imaging, SWE, PWV, arterial stiffness, ultrasound
Introduction
The concept of ultrafast ultrasound imaging was first introduced by Bruneel et al1 almost 40 years ago. However, its implementation on a commercial ultrasound diagnostic device has only been possible recently, thanks to the massive parallel processing power of personal computers developed in the last decade. Ultrafast ultrasound imaging relies on plane or diverging wave transmissions rather than line by line scanning focused beams used in conventional ultrasound imaging devices. This novel insonification strategy has overcome the low frame rate limitation of conventional ultrasound imaging (<100 frames/s) by reducing the number of insonifications required to generate an equivalent image; therefore reducing the total time of flight while allowing imaging frame rates to reach several thousands of Hertz. This tremendous increase in frame rate is not only a technological breakthrough but it has also allowed the advent of novel ultrasound imaging modes, such as shear wave elastography (SWE), ultrafast Doppler, ultrafast contrast imaging, and even functional ultrasound imaging of brain activity.
Indeed imaging at an ultrahigh frame rate (several thousands of frames per second [fps]) provides a unique way to observe and track transient physiologic events such as blood flow,2 arterial pulse wave propagation,3,4 cardiac contraction,5 and brain activity.6 Today there are two main applications of ultrafast imaging in the vascular imaging field. The first application is the local estimation of pulse wave velocity (PWV) by tracking its propagation along an arterial segment, a technique often called “pulse wave imaging”.7 The second one uses ultrafast imaging to track the propagation of mechanical wave induced remotely by acoustic radiation force to reconstruct elastic maps of arterial walls throughout the cardiac cycle.8 This latter technique, called SWE, was first introduced and extensively developed in the radiological field for the characterization of suspicious masses in the breast8 and thyroid,9 the detection of suspicious areas in the prostate,10 and also for liver fibrosis assessment.11 Recently, the capability of SWE to locally measure in vitro and in vivo myocardial elasticity has also been investigated.12,13
In this review, the first section will provide an overview of existing methods used to assess arterial mechanical properties with conventional ultrasound with their advantages and limitations. The second part will present the ultrafast imaging theory and its applications in vascular imaging. The last section will summarize the clinical studies using ultrafast imaging for vascular applications.
State of the art: estimation of viscoelastic properties of the arterial wall
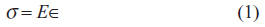
Arterial stiffness is a generic term which usually refers to the arterial distensibility, defined as the coefficient of proportionality between the increase of pressure systole and the relative change of diameter induced by this pressure step. Intrinsically, the distensibility is related to the bulk elasticity of the arterial wall as well as its diameter and wall thickness. Therefore, a modification of this apparent stiffness or distensibility can be the consequence of a simple thickening of the wall or a deeper modification of the wall structure and therefore its bulk elasticity. Ultimately, the mechanical properties of the arterial wall should be described locally as the relationship between the deformation and the stress, and a proper model should be used in order to compute higher scale parameters such as distensibility that can be interpreted more easily in a given clinical context. In reality, we usually have access directly to such a parameter or so-called “index of arterial stiffness” without the possibility to derive more intrinsic parameters due to a lack of information, usually the knowledge of the pressure inside the lumen. In this review, the term “stiffness” refers to the Young’s modulus defined in Figure 1, Equations 1 and 2.
 | Figure 1 Definition of the Young modulus. |
Today different techniques exist that estimate either local or global arterial wall mechanical properties. The need to measure global or local arterial wall viscoelastic properties highly depends on the pathology. For instance, a global index of arterial stiffness is required to assess the vascular resistance of cardiac afterload to monitor subjects at risk, such as patients suffering from high blood pressure, while the characterization of focal pathologies, such as plaques or aneurysms, benefits from a local mapping of elastic properties. Methods to measure local and regional arterial stiffness are usually based on ultrasound or magnetic resonance imaging (MRI), while a global index of arterial stiffness is usually obtained with methods based on tonometry. In this section, we will focus on ultrasound techniques that are available today. These methods rely on two physical phenomena, which are both linked to arterial wall elasticity; the first one being the deformation of the arteries with blood pressure variation and the second one being the analysis of the propagation of the pulse wave.
Elasticity estimation based on deformation or strain measurement
Under certain assumptions, elastic properties of soft tissue can be estimated with an ultrasound scanner by means of strain elastography (or static elastography), which consists of measuring the strain (∊) induced within the tissue under the application of an external stress (σ) (Figure 1). If ∊ and σ are known, it is possible to retrieve the elastic properties of the tissues using a proper model of the stress–strain relationship. Usually, the stress–strain relationship is supposed linear (Hooke’s law) and the Young’s modulus, E or elasticity of the medium is derived from the following equation:
Assuming that the arterial walls’ mechanical properties follow Hooke’s law (Equation 1), the Young’s modulus of the arterial wall can be quantitatively estimated by combining pressure estimation with arterial diameter variation measurement with the following equation:
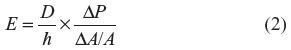
where D is the artery diameter, A the surface of the artery lumen, ΔA its variation between diastole and systole, ΔP is the variation of blood pressure between diastole and systole, and h the arterial wall thickness. Indeed, pulsatile blood pressure provides a “natural” source of stress, which generates a change in arterial diameter. Blood pressure variation can either be measured at a specific site invasively with a catheter or non-invasively with the measurement of brachial arterial pressure combined with a so-called “transfer function”.14
This method of estimation of arterial stiffness has several limitations. Firstly, as the diameter variation needs to be tracked at a sub-pixel scale, specific algorithms applied on the transducer per-channel signals (backscattered echoes) are required15,16 in combination with a high frequency probe, limiting the scope of strain imaging to superficial vessels such as the carotid arteries.14
Another limitation appears in the presence of a strong inhomogeneity such as an arterial plaque: despite the possibility to measure the deformation locally, the local stress within the plaque cannot be derived from the application of a transfer function on brachial pressure measurement. Similar techniques based on MRI with better access to deep arteries are also available but only in clinical research settings.17
The last limitation is linked to the fact that Equation 2 is obtained assuming a linear dependency between stress and strain as shown in Figure 2A. This is convenient as a single elastic parameter (Young’s modulus) can be derived from ΔP and ΔA. However, soft biological tissues, and more particularly the arterial wall, do not follow Hooke’s law: they usually stiffen under mechanical compression or stretching, as a mechanism of protection, which prevents excessive deformations occurring. One convenient way to represent this non-linear behavior is to define a “tangential elasticity” for a given level of applied stress, defined as the local slope of the stress–strain curve. Thus, it represents the elasticity perceived when applying a small amount of stress at a given level of preload, as shown in Figure 2B.
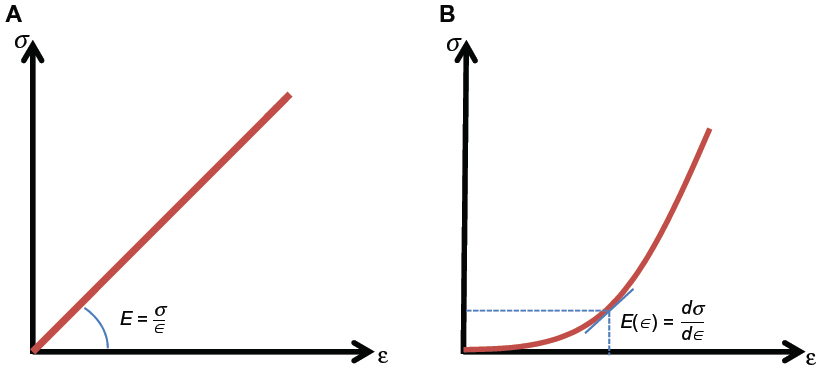 | Figure 2 Linear versus non-linear elastic behavior. |
The arterial wall can be seen as a composite material consisting of elastin and collagen fibers, which are mainly responsible for its mechanical properties. When the arterial pressure increases, the elastin fibers progressively unfold resulting in a slight increase in arterial wall stiffness. When systolic pressure increases above normal, collagen fibers take over elastin and a strong increase of stiffness occurs. This increase of stiffness with stretching allows the stability of the artery by limiting the increase in diameter and thereby prevents the breakdown of less rigid structures (elastin, smooth muscle cells, etc).18
This non-linear stress-strain relationship implies that the measurement of a single elastic value between diastole and systole very dependent on the blood pressure during the acquisition. In Giannattasio et al,19 diastolic and systolic stiffness estimations are obtained by measuring the slope of the stress–strain relationship respectively around diastolic and systolic pressures, providing two different elastic values (or tangential elasticity). By taking into account the non-linear elasticity of the arterial wall, this approach produces stiffness indexes, which are less dependent on the blood pressure at the time of the measurement. Additionally, diastolic and systolic stiffness may provide complementary information from a clinical perspective. For instance, beyond the estimation of a single index of arterial stiffness, the knowledge of the arterial stiffness increase in systole may be useful to detect a weak portion of an artery and predict the risk of aneurysm formation.
Elasticity estimation based on PWV: from global to regional arterial wall stiffness estimation
Another approach, which does not require the knowledge of the pressure, uses arterial pulse wave propagation speed or PWV to derive arterial wall stiffness. More precisely, assuming that the pulse wave induces negligible strain and that the arterial wall is a linear and isotropic elastic tube, the relationship between PWV and the Young’s modulus can be expressed with the Moens–Korteweg equation,20 as proposed by Bramwell and Hill21 with the following equation:
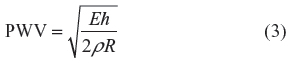
where E is Young’s modulus, ρ the density of the arterial wall, h its thickness, and R its radius.
In practice, the average PWV along a given arterial segment is estimated by taking the ratio between its length and the pulse wave transit time between its two extremities. Existing techniques measuring PWV can be classified into two main groups: global PWV and local PWV.
The first group of techniques estimates PWV with tonometry devices. The propagation distance between the two sites of pulse pressure measurement is estimated approximately with a measuring tape while the time delay of the pulse wave is estimated by measuring the waveform delay between the two sites as represented in Figure 3. Two devices are commercialized today, the Complior® (Alam Medical, Vincennes, France) and the SphygmoCor (AtCor Medical, West Ryde, NSW, Australia). This technique has very good reproducibility, applicability, and proven clinical value,22 but remains limited to a global estimation of central arterial stiffness.
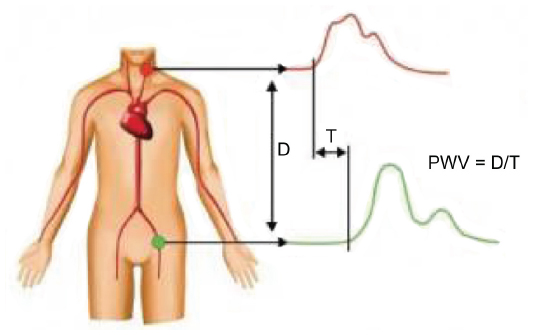 | Figure 3 Principle of the measurement of pulse wave velocity (PWV) with tonometry: the arterial pulse wave delay (T) and the distance (D) between the femoral and carotid sites are estimated and PWV is computed as the ratio D/T. |
Nevertheless, PWV measured between the carotid and the femoral site is the reference technique today. This average PWV estimation mainly depends on the aortic stiffness and has been proposed and validated as a predictive value of cardiovascular risks.23
The second group of techniques relies on more local measurements of PWV at specific sites, such as the carotid24 or the abdominal aorta,25 using conventional focused ultrasound. As the arterial pulse wave propagates typically at 5 to 15 m/s, the propagation time over a few centimeters is typically inferior to a millisecond and thus a high frame rate is required to measure locally the pulse wave transit time (>1,000 fps). Several authors proposed using Doppler imaging with a low line density (typically eight to 16 lines) to reach a high imaging frame rate.24 Another approach relies on smart electrocardiogram (ECG)-gated acquisitions over multiple cardiac cycles26 to track the propagating pulse at different times in the cardiac cycle.
However, both global and local PWV approaches have some limitations. Indeed, none of the hypotheses used to establish the Moens–Korteweg equation (Equation 3) are strictly verified. This might explain the discrepancy observed between the Young’s modulus (E) estimations derived from strain imaging and from PWV measurement at the same site.7
Theory of ultrafast imaging and its application to arterial wall mechanical characterization
Principle of ultrafast imaging
The recent development of ultrafast scanners allowed a tremendous increase in ultrasound imaging temporal resolution from typically less than 100 fps to several thousands. SuperSonic Imagine (Aix en Provence, France) was the first company to develop a unique architecture allowing the implementation of UltraFast™ imaging onto a commercially available diagnostic ultrasound device, called Aixplorer®. This technological breakthrough has permitted the advent of several novel imaging modes using ultrafast imaging, including SWE, ultrafast Doppler, and ultrafast PWV (ufPWV)27 and the diagnostic contributions of these modes have been clinically proven in general radiology. While strong potential exists for ultrafast imaging in the cardiovascular field, it remains to be fully explored and clinically validated.
Ultrafast imaging is based on the reconstruction of a complete image from a single transmit receive ultrasound event, in opposition to conventional imaging, which consists of scanning line by line the imaging plane with focused beams. This is achieved by transmitting unfocused acoustic signals such as plane waves, which identically insonify the entire region of interest (ROI). Indeed, the reconstruction of a complete image from a single transmission is performed at the expense of image quality (resolution and contrast), as backscattering signal comes from the entire imaging plane instead of only a narrow acoustic line. To retrieve the transmission focalization on each pixel of the image and thus, image quality, one can coherently combine plane waves of different inclinations, a process known as synthetic imaging.27 Figure 4 shows the comparison between a conventional image reconstructed from focused beams and images reconstructed with plane waves compounding using and increasing number of transmissions. The trade-off between frame rate and image quality then depends on the number of transmissions used to reconstruct a synthetic image, which affects each pixel of the image almost identically,27 while conventional imaging is optimal only at the focal depth.
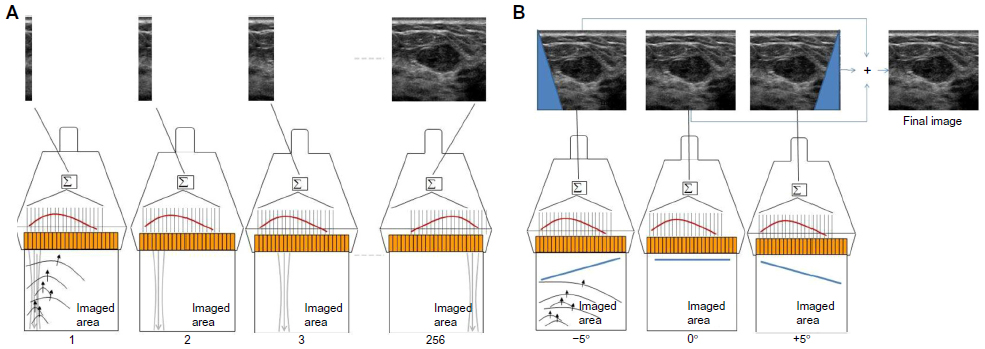 | Figure 4 Conventional focused and ultrafast ultrasound imaging sequences for a typical medical imaging setup (4 cm deep region of interest). |
Ultrafast imaging of the arterial pulse wave, potential applications and limits
Sorensen et al3 studied the impact of frame rate on the reproducibility of PWV measurement on healthy subjects (PWV <5 m/s) using ultrafast imaging. They observed an improvement in reproducibility with frame rate increased up to a value of approximately 1,000 fps. As PWV can increase above 10 m/s with aging and pathologies, a frame rate of more than 2,000 fps should probably be required in order to cover the entire range of encountered velocities. Reaching such a high frame rate with conventional focused Doppler imaging requires a drastic reduction of the number of scan lines, typically eight to 16. Furthermore, scan lines are not acquired simultaneously and the acquisition delay of each line needs to be compensated for when estimating the transit time of the pulse wave between the scan lines. Ultrafast imaging does not suffer from these limitations. For instance, in the case of the carotid artery, more than ten transmissions can be combined to obtain a single synthetic image over the full ROI. Because all pixels within an image are acquired simultaneously, there is no time delay to consider between regions of the image. Finally, ultrafast imaging drastically simplifies the acquisition sequence for pulse wave imaging and allows a much higher temporal and lateral resolution over a large ROI, improving the precision and the reproducibility of the measurement.28,29 An example of PWV values obtained with ultrafast imaging is represented in Figure 5. After careful alignment of the probe with the arterial wall, the acquisition is performed within 2 seconds and the result is displayed in a few tens of seconds.
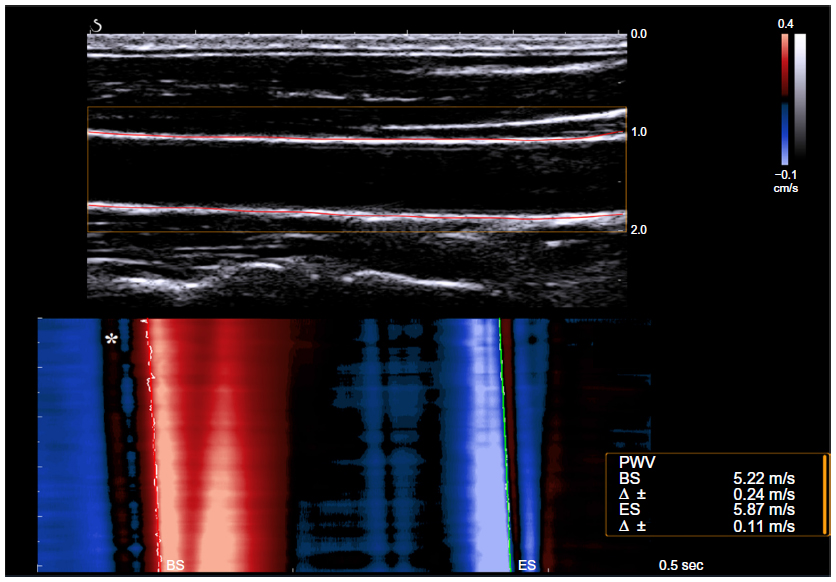 | Figure 5 Pulse wave velocity (PWV) values obtained at the carotid site with ultrafast imaging. |
Although higher temporal and spatial resolutions might not always be required when considering a homogeneous segment of an artery it will be required for a more local analysis of arterial wall mechanical properties. Recently, Apostolakis et al proposed to reconstruct maps of PWV for the characterization of focal pathologies such as arterial plaques or aneurysms.30 These studies report encouraging results allowing the differentiation between pathological and normal arterial wall segments. Nevertheless, this approach is limited by the very low spatiotemporal frequency content of the arterial pulse wave, which limits the spatial resolution of PWV measurements. While the shape, amplitude, frequency, and occurrence of the pulse waves are deeply related to the pathophysiological conditions of a subject and thus worth being analyzed,14 they are not well suited for a high spatial resolution mapping of the arterial walls’ elastic properties. Indeed, local elastic inhomogeneity such as arterial plaques or aneurysms alters the propagation of the pulse wave but the estimation of underlying local PWV is doomed to be imprecise as their size is much smaller than the spatial extension of the pulse wave (pulse wavelength is in the order of centimeter to meter [Table 1]). Keeping this limitation in mind, the analysis of the pulse wave propagation within relatively large heterogeneity within the arterial wall such as an aortic aneurysm may provide useful biomarkers for the monitoring of such focal vascular diseases. Another limitation of PWV is the fact that it can provide information of arterial wall elasticity only at specific remarkable points in time in the cardiac cycle, usually at the SF and at high distention.
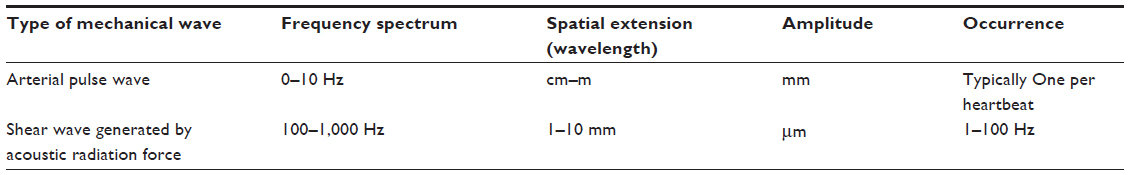 | Table 1 Properties of the arterial pulse wave versus shear wave generated by acoustic radiation force |
SWE
SWE is an imaging technique based on the analysis of transient mechanical vibrations induced remotely using an acoustic radiation force or “pushing beam”. Acoustic radiation force is the result of the conversion of ultrasonic vibration (MHz) into a roughly unidirectional stress constant during the burst duration (typically 100 μs). This acoustic pressure induces a local displacement of the tissue with a range of a few microns. Once the acoustic radiation force is released, this local vibration propagates in soft tissues as a shear wave, the speed of which cs (so-called “shear wave speed”) is directly linked to the underlying elasticity or Young’s modulus E through the following equation:
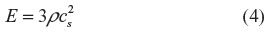
In order to retrieve local cs, shear wave propagation following the pushing beam is tracked at high frame rate (typically 3,000 to 10,000 fps) using ultrafast plane wave imaging. This high frame rate is required in order to analyze the propagation at a millimetric scale in the full propagating region: for typical range of soft tissue elasticity, cs varies from 1 to 10 m/s, which corresponds to a propagation time of less than a millisecond between two points separated by 1 mm. The complete principle of SWE is summarized in Figure 6.
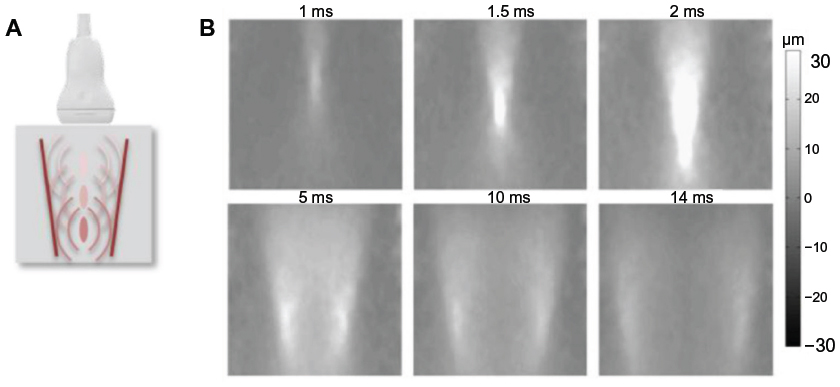 | Figure 6 Principle of shear wave elastography. |
SWE is very similar to PWV as it is based on the measurement of the propagation speed (or celerity) of mechanical waves in soft tissues. Nevertheless, compared to the arterial pulse wave, shear waves generated with a pushing beam have different properties, as shown in Table 1. First, acoustic radiation force generates much higher frequency and thus shear wave propagation can be analyzed at a lower spatial scale (<1 cm) allowing to map elasticity with higher spatial resolution in the order of millimeters. Secondly and as opposed to the arterial pulse wave, the shear stress induced by the acoustic radiation force is too small to produce a significant change in elasticity as a result of the non-linear stress–strain relationship of biological tissues. Thus, if the elasticity does not change significantly during the few milliseconds required to record shear wave propagation within the ROI, it is possible to follow the variation of elasticity caused by physiologic events such as myocardium or skeletal muscle contraction. However, the small amplitude of generated shear waves makes them more difficult to detect than the arterial pulse wave. Finally, because the pushing beam can be generated at any time, elasticity can be retrieved at any stage of the cardiac cycle, while PWV can only be estimated at specific instants (usually systolic foot [SF] and dicrotic notch [DN]).
Equation 4 can be used in a bulk homogeneous medium containing elastic inclusions larger than a wavelength, but it cannot be applied directly to the arterial wall, as its thickness is close to the shear wavelength (mm). While the shear wave propagates, reflections occur at the boundary of the arterial wall, modifying the apparent propagation speed, the wall acting like a “wave guide”. The theory of guided shear wave propagation in the arterial wall has been studied by different groups in silico, in vitro, and in vivo.31,32 In summary, the shear wave propagation depends on the elasticity of the wall as well as the surrounding medium, the frequency of the wave f, and the geometric parameters of the wall, especially its thickness h. The exact expression of the propagation speed cannot be derived analytically in a general case. Nevertheless, a simple empirical formula has been proposed and validated in vitro by Couade et al.31 This formula is valid for a soft plate immerged in water, with a thickness h and a bulk shear wave propagation speed cs:
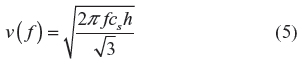
The influence of the cylindrical shape of the arterial wall as well as the elasticity of the surrounding medium can also be taken into account by solving numerically the propagation equations.32
In Figure 7, the effect of the geometry and the contrast between the elasticity of the arterial wall and the surrounding medium is depicted. As the arterial wall is much stiffer than the surrounding tissues, the influence of this last parameter can be neglected in first approximation especially at high frequency. Similarly, the influence of the cylindrical geometry of the artery can be neglected at high frequency. Finally, the arterial wall can be approximated as a soft plate surrounded with water in order to derive its elasticity from the shear wave velocity (SWV) measurements.
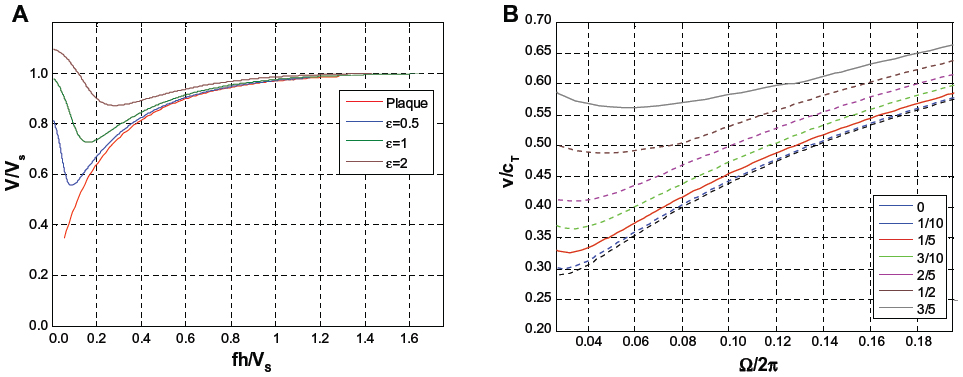 | Figure 7 Theoretical dispersion curves of a shear wave propagating in a soft cylindrical shell. |
This simple model has been applied in vivo by Couade et al,31 showing SWV measurement capability to estimate arterial wall stiffness. Although both shear wave and arterial pulse wave propagates at comparable speed, it is possible to filter out the propagation of the arterial pulse wave. This is possible since generated shear waves exhibit a much higher frequency. As the acquisition is performed within a few milliseconds, it can be repeated multiple times over the cardiac cycle, enabling the visualization of wall elasticity variation generated by the progressive stretching induced by systolic pressure, as shown in Figure 8.
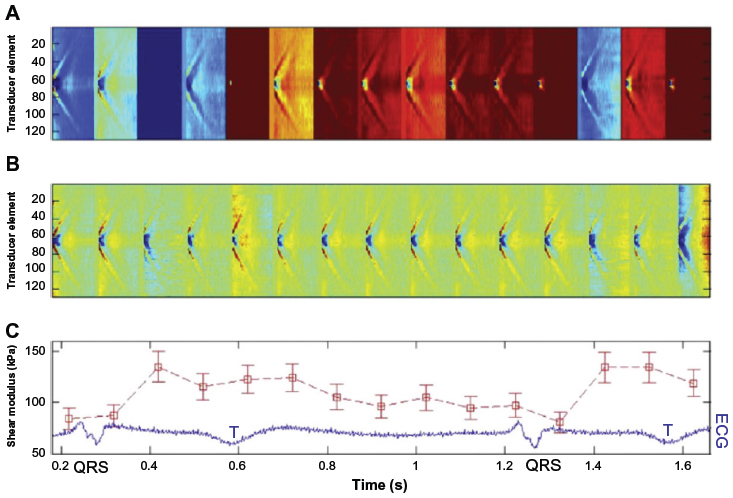 | Figure 8 Real-time in vivo measurement of carotid arterial wall shear modulus variation during a single heart cycle (13 values per cycle) with time-registered electrocardiogram (ECG). |
Ultrafast Doppler imaging
The application of ultrafast imaging to flow imaging has filled the gap between blood flow mapping and quantitative analysis of velocities,27 allowing a full analysis of Doppler spectrum for any pixel of the color flow cine-loop. On a conventional scanner, such a quantitative analysis is only possible when limiting the ROI to one acoustic line (pulsed wave Doppler mode). More recently, advanced spatiotemporal tissue motion filtering taking advantage of the huge amount of data available synchronously within a large ROI to increase sensitivity to slow blood flow (< mm/s)33 has been applied to the mapping of newborns’ brain vasculature34 and for the discrimination of fetal and maternal blood flow in the placenta.35 Such a technique could potentially be used to detect and map arterial plaque vascularization, which is correlated with its vulnerability and thus cardiovascular events, as shown by a recent study using contrast-enhanced ultrasound.36
Ultrafast imaging for evaluation of arterial wall mechanical properties: literature review and clinical perspectives
While ultrafast-based imaging modes have been extensively clinically validated in the field of radiology both at the academic and industrial research levels, the cardiovascular applications of this technology have been mainly investigated by academic research groups in the scope of preclinical studies as research scanners with ultrafast capabilities have become more available in the recent years. The realization of wider clinical studies will be conditioned in the future by the availability of this technology for vascular applications on commercial scanners.
ufPWV
While the feasibility of PWV direct measurement has been proven on conventional scanners, to our knowledge, it has never been implemented on a commercial system. Consequently, no side-by-side clinical study has been conducted to compare the diagnostic performance of ultrafast versus conventional imaging to measure PWV. Nevertheless, ultrafast imaging has been adopted by research groups as an improvement of pulse wave imaging. As it offers a better visualization of the pulse wave propagation and eases the identification of different peaks, which compose the arterial pulse wave, some of these studies have been focusing on measuring the propagation speed at these different times. As previously pointed out by Hermeling et al,28 PWV can be measured with ultrasound at least at two different instants of the cardiac cycle corresponding to a low distention (SF) and high distention (DN). In the same study, PWV has been found lower when measured in early systole than in late systole. They also demonstrated a significant increase of PWVdn with age while no significant dependency of PWVsf was found with age. In a recent paper, Mirault et al29 used ufPWV to establish reference values of this technique on the carotid artery for both a normal cohort (N=102) and a patient cohort (N=37) suffering from Ehler Danlos syndrome (EDS). ufPWV was also measured at two different times at the beginning of systole (BS) or SF and at the end of systole [es] or DN. In the normal cohort, results were very similar to the one obtained by Hermeling et al.28 While PWVbs was very stable with aging, except in young adults, PWVes increased significantly with age. In addition, PWVes was significantly higher in late systole than when measured in early systole, a much smaller increase of PWV was reported in the EDS cohort. These results were attributed to the lack of collagen in the arterial wall of EDS subjects. According to these results, PWVs measured both around the SF (low pressure) and at the DN (high pressure) contain complementary information on the biomechanical properties of the arterial wall, which is a step toward a better characterization of vascular aging and structural weakness. Nevertheless, the non-linearity of the wall’s stress–strain relationship is more pronounced at high pressure, which makes PWVes more dependent on systolic pressure than PWVbs on diastolic pressure. As a consequence, ufPWV should be adjusted to take into account blood pressure and age, especially when considering PWVes. Nagaoka et al37 measured the propagation speed of the reflected wave occurring at the carotid bifurcation, as well as a much weaker wave occurring before the opening of the aortic valve and thus before the SF. This wave is attributed to the propagation of the vibrations induced by the isovolumetric contraction of the myocardium. As it propagates before the SF, it reflects stiffness of the arterial wall at the “true” diastolic pressure. Contrary, PWVsf or PWVbs is measured when the acceleration of the wall reaches its maximum, which typically corresponds to 50% of the pressure uptake but varies depending both on the shape of the waveform and on the applied signal. According to the results of this study, PWV measured at this site could provide a better estimation of the diastolic stiffness than PWVbs. In Figure 5, this peak is easily identified and a PWV could be derived from its analysis. Unfortunately, it is not always the case because of its small amplitude.
Ultrafast imaging can also be used for vector Doppler estimation.2 Nagaoka et al37 simultaneously derived PWV, longitudinal and transverse motion of the arterial wall from ultrafast acquisitions at the carotid site. Finally, published studies indicate the possibility to simultaneously investigate the propagation of the pulse wave as well as a quantitative mapping of arterial wall motion and blood flow in two dimensions38,39 using ultrafast imaging.
SWE
As reported in the Ultrafast imaging of the arterial pulse wave, potential applications and limits section and the SWE section, when propagating within the arterial wall, shear waves generated by acoustic radiation force are “guided waves” and thus a specific model is required in order to retrieve the arterial wall elasticity from the measurement of the propagation speed. It is important to keep in mind that the thickness and the elasticity of the arterial wall have a similar influence on the value of the shear wave propagation speed measured by SWE. For instance, if the arterial wall thickens locally without a change in its stiffness, higher propagation speed will be measured in this region. Finally, in the presence of strong local inhomogeneity for instance within an arterial plaque, this model cannot be applied and further developments are required to derive elastic maps such as the recent encouraging work by Nenadic et al40 and the development of 3D ultrafast imaging.41
Beyond a precise estimation of the Young’s modulus of a homogeneous section of an artery, several teams studied the case of local elastic inhomogeneity both in vitro and in vivo, in the presence of carotid plaque. Ramnarine et al42 acquired elastic maps of phantoms mimicking arterial stenosis and plaque with soft and hard elastic heterogeneities. They used conventional SWE and thus neglected the “guiding effect” of the arterial wall. Although the conversion of propagation speed maps into Young’s modulus maps with Equation 4 is theoretically incorrect, a strong contrast between hard and soft regions was observed with a good reproducibility both with and without the presence of a pulsatile flow in their in vitro setup. This is probably related to the fact that the material used to build the phantom had a linear behavior in the range of the applied stress. In vivo, as the acquisition of SWE maps was performed in real-time at a frame rate of 1 Hz without ECG triggering, successive maps were acquired at various instants of the cardiac cycle and thus more variability in the measured elastic value is expected. In the future, high frame rate SWE acquisitions and ECG triggering could improve the outcome of such studies. Ramnarine et al43 also evaluated SWE in vivo in arterial plaques on 54 subjects with carotid stenosis (>30%). In figure 9, an example of elasticity map acquired with SWE on a carotid plaque is presented. Good feasibility (96%) and reproducibility (coefficient of variation <20%) was observed and a correlation between elastic values measured by SWE and plaque stability was also described. Indeed symptomatic plaque appeared softer (mean 54 kPa; 95% confidence interval =44–64 kPa) than asymptomatic plaque (mean 88 kPa; 95% confidence interval =71–105 kPa). Garrard et al44 also conducted a similar study using histology as the reference after endarterectomy.
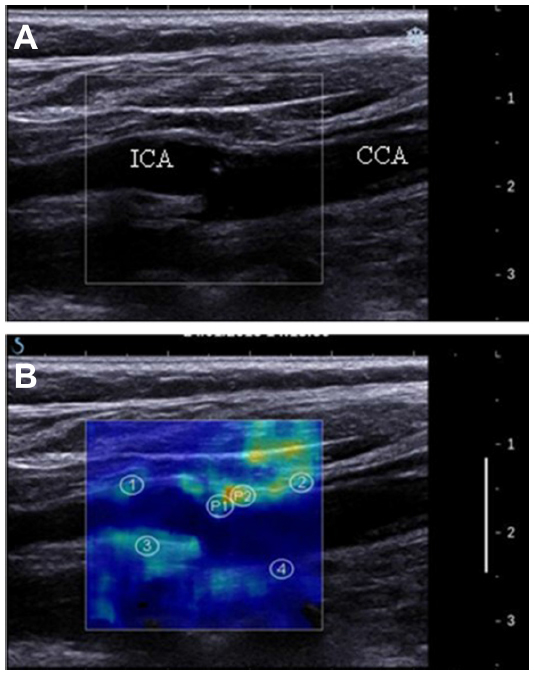 | Figure 9 Shear wave elastography of the arterial plaque. |
Similarly, unstable plaques were shown to be softer than stable plaques. These differences in elasticity were compared with histological findings such as the presence of hemorrhage, fibrous/lipid tissues, and significant correlations were found between those features and SWE elasticity values. Despite these encouraging findings, the elasticity values of stable and unstable plaque overlap when stable plaques had severe stenosis. The authors pointed out the influence of the degree of stenosis, which from a clinical point of view could be considered as a confounding factor. From a more theoretical point of view, the thickness of the arterial plaque may influence the propagation of shear wave and thus elastic values estimated with conventional SWE. Finally, those clinical results motivate further developments of SWE for the characterization of arterial plaque. Widman et al and Maksuti et al45,46 pursued the validation of guided wave theory applied to arterial stiffness estimation using shear wave propagation speed maps in both homogeneous and heterogeneous cylindrical tubes mimicking the arterial walls using a custom research package available on the Aixplorer® system. In this study, the plaque was modeled as a homogeneous inclusion of constant elasticity and thickness, which makes the theory of guided wave applicable as the geometry is supposed to be infinite in the propagation direction. Such conditions are unfortunately not always encountered in vivo as plaques are usually very heterogeneous in shape and content. In order to convert shear wave propagation speed maps measured in arterial plaques captured with ultrafast imaging into elastic maps, a new inversion method will be required. Until such a method is developed, “elasticity maps” of arterial plaque should be analyzed as “propagation speed maps” and displayed in m/s. This mode is also called SWV.
Shcherbakova et al47 studied arterial wall ex vivo on horse aorta with both SWV and tensile testing. Elastic anisotropy refers to the fact that the elasticity of a material may vary depending on the direction of the applied stress. For instance, skeletal muscles are stiffer in the direction of the fibers than perpendicularly to them.48 In Shcherbakova et al,47 tensile testing was performed by stretching-unstretching cycles in the circumferential direction, which is the main solicitation of the artery in systole. Tensile strain, stress, and corresponding SWV in m/s are represented on Figure 10.
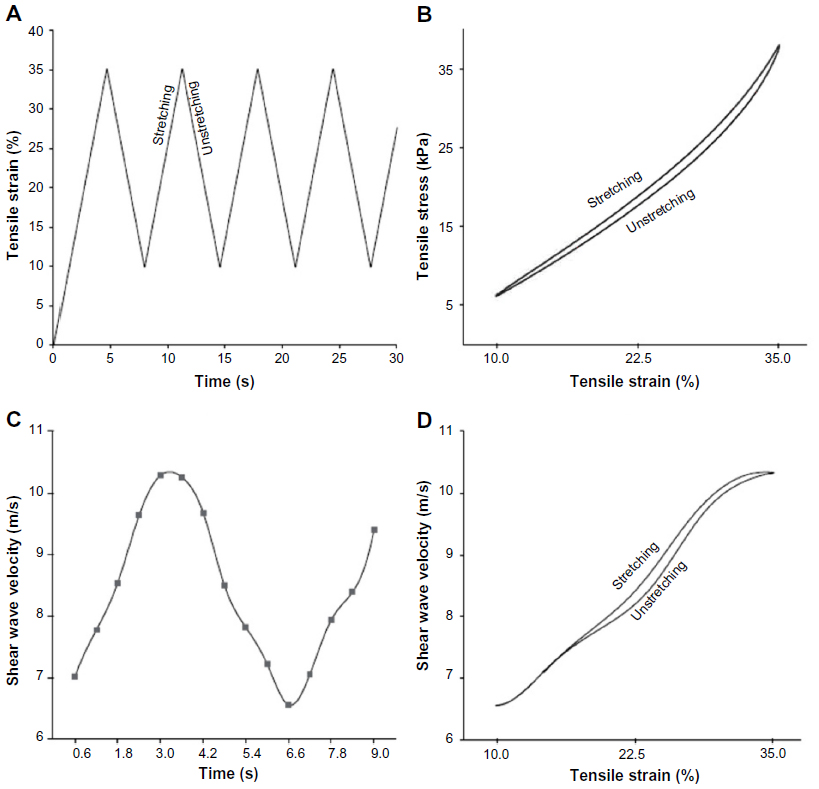 | Figure 10 Ex-vivo measurements of shear wave velocity in an arterial wall sample under mechanical testing cycles. |
Arterial wall stiffness was found to be higher in the circumferential direction than in the longitudinal direction with both SWV and tensile testing at all stretching levels. In the circumferential direction, an increase in stiffness was measured with both techniques, the relative increase being similar while absolute SWV values are typically 50% higher when assessed by SWV. This variation of SWVs with stress reflects the hyper-elastic properties of the arterial wall, which are also brought to light by PWV when measured in diastole and systole. In the longitudinal direction, perpendicular to the stretching direction, the propagation speed did not significantly vary with loading condition, as it was applied perpendicularly. This last result is in contrast with the findings of Couade et al.31 Indeed in this later work, a significant increase of the longitudinal stiffness was found in vivo on the carotid artery. This could be related to a significant difference in the loading condition (ideal uniaxial stretching in the ex vivo experiments) as well as differences in the underlying wall structure between aorta and carotid arteries. Finally, this study brought experimental proof of the capability of SWV to measure circumferential and longitudinal elastic properties of the artery by scanning respectively in a transverse and a longitudinal plane giving the opportunity to retrieve complementary information on the composite structure of the arterial wall related to the elastic fiber architecture (elastin/collagen).
Conclusion and perspectives
Among all, cardiovascular applications of ultrafast imaging are probably the most promising yet challenging, being the subject of a large number of studies. To date, ultrafast Doppler and ufPWV are the only tools available in clinic, which can provide quantitative information on both blood flow and arterial stiffness simultaneously. ufPWV provides a rapid and simple way to obtain an arterial stiffness index during a conventional ultrasound exam. Normal reference values of PWV measured with this technique in the carotid have recently been reported.35 Long-term studies of the predictive value of PWV measured in carotid value with ultrafast imaging for cardiovascular risk assessment have not been reported yet, which today limits its clinical scope. Independently, a few studies have indicated that SWV could be useful to assess the local arterial wall mechanical properties and differentiate stable from unstable plaques in the carotid artery. However, more work needs to be performed to fully validate SWV for that indication. While SWV could also be applied to other superficial arteries, access to deeper vessels such as the aorta remains challenging as the use of lower frequency transducers with lower spatial resolution is required and as the generation of shear wave propagation is more challenging at large depths. In this latter case, ufPWV could be an interesting alternative. Furthermore, a large amount of clinical studies have been focusing on the diagnostic and predictive value of aortic PWV as an index of central arterial stiffness. The use of ultrafast imaging in Doppler has allowed simultaneous blood flow mapping with its quantitative analysis of velocities, as well as increased Doppler sensitivity to enable micro-vascularization imaging. This ultrasensitive Doppler technique could potentially enable the visualization of arterial plaque vascularization, which is correlated with its vulnerability and thus cardiovascular events. Ultimately, as a strong coupling exists between the blood flow and the arterial wall, the application of ultrafast imaging to simultaneously quantify mechanical and vascular properties of the wall as well as blood flow hemodynamics may also be an untapped very promising research field.
Disclosure
Mathieu Couade is an employee at SuperSonic Imagine. The author reports no other conflicts of interest in this work.
References
Bruneel C, Torguet R, Rouvaen KM, Bridoux E, Nongaillard B. Ultrafast echotomographic system using optical processing of ultrasonic signals. Appl Phys Lett. 1977;30:371. | |
Bercoff J, Montaldo G, Loupas T, et al. Ultrafast compound Doppler imaging: providing full blood flow characterization. IEEE Trans Ultrason Ferroelectr Freq Control. 2011;58(1):134–147. | |
Sorensen GL, Jensen JB, Udesen J, Holfort IK, Jensen JA. Pulse wave velocity in the carotid artery. Proc IEEE Ultrason Symp. 2008:1386–1389. | |
Couade M, Pernot M, Messas E, et al. Ultrafast imaging of the arterial pulse wave. IRBM. 2011;32(2):106–108. | |
Couade M, Pernot M, Tanter M, et al. Ultrafast imaging of the heart using circular wave synthetic imaging with phased arrays. IEEE Ultrason Symp. 2009:515–518. | |
Macé E, Montaldo G, Cohen I, Baulac M, Fink M, Tanter M. Functional ultrasound imaging of the brain. Nat Methods. 2011;8(8):662–664. | |
Vappou J, Luo J, Konofagou EE. Pulse wave imaging for noninvasive and quantitative measurement of arterial stiffness in vivo. Am Hypertens. 2010;23(4):393–398. | |
Bercoff J, Tanter M, Fink M. Supersonic shear imaging: a new technique for soft tissue elasticity mapping. IEEE Trans Ultrason Ferroelectr Freq Control. 2004;51(4):396–409. | |
Sebag F, Vaillant-Lombard J, Berbis J, et al. Shear wave elastography: a new ultrasound imaging mode for the differential diagnosis of benign and malignant thyroid nodules. J Clin Endocrinol Metab. 2010;95(12):5281–5288. | |
Correas JM, Tissier AM, Khairoune A, et al. Prostate cancer: diagnostic performance of real-time shear-wave elastography. Radiology. 2015; 275(1):280–289. | |
Bavu E, Gennisson JL, Couade M, et al. Noninvasive in vivo liver fibrosis evaluation using supersonic shear imaging: a clinical study on 113 hepatitis C virus patients. Ultrasound Med Biol. 2011;37(9):1361–1373. | |
Couade M, Pernot M, Messas E, et al. In vivo quantitative mapping of myocardial stiffening and transmural anisotropy during the cardiac cycle. IEEE Trans Med Imaging. 2011;30(2):295–305. | |
Pernot M, Couade M, Mateo P, Crozatier B, Fischmeister R, Tanter M. Real-time assessment of myocardial contractility using shear wave imaging. J Am Coll Cardiol. 2011;58(1):65–72. | |
Safar ME, O’Rourke M, Frohlich ED, editors. Blood Pressure and Arterial Wall Mechanics in Cardiovascular Diseases. London: Springer; 2014. | |
Hoeks AP, Brands PJ, Smeets FA, Reneman RS. Assessment of the distensibility of superficial arteries. Ultrasound Med Biol. 1990;16(2):121–128. | |
Van Bortel LM, Balkestein EJ, van der Heijden-Spek JJ, et al. Non-invasive assessment of local arterial pulse pressure: comparison of applanation tonometry and echo-tracking. J Hypertens. 2001;19(6):1037–1044. | |
Resnick LM, Militianu D, Cunnings AJ, Pipe JG, Evelhoch JL, Soulen RL. Direct magnetic resonance determination of aortic distensibility in essential hypertension: relation to age, abdominal visceral fat, and in situ intracellular free magnesium. Hypertension. 1997; 30(3 Pt 2):654–659. | |
Shadwick RE. Mechanical design in arteries. J Exp Biol. 1999;202(Pt 23):3305–3313. | |
Giannattasio C, Salvi P, Valbusa F, et al. Simultaneous measurement of beat-to-beat carotid diameter and pressure changes to assess arterial mechanical properties. Hypertension. 2008;52(5):896–902. | |
Moens I. Die Pulscurve. Leiden: EJ Brill; 1878. | |
Bramwell JC, Hill AV. The velocity of the pulse wave in man. Proc R Soc Lond B. 1922;93:298–306. | |
Laurent S, Cockcroft J, Van Bortel L, et al. Expert consensus document on arterial stiffness: methodological issues and clinical applications. Eur Heart J. 2006;27(21):2588–2605. | |
Safar ME, Henry O, Meaume S. Aortic pulse wave velocity: an independent marker of cardiovascular risk. Am J Geriatr Cardiol. 2002;11(5):295–298. | |
Eriksson A, Greiff E, Loupas T, Persson M, Pesque P. Arterial pulse wave velocity with tissue Doppler imaging. Ultrasound Med Biol. 2002;28(5):571–580. | |
Li RX, Luo J, Balaram SK, Chaudhry FA, Shahmirzadi D, Konofagou EE. Pulse wave imaging in normal, hypertensive and aneurysmal human aortas in vivo: a feasibility study. Phys Med Biol. 2013;58(13):4549–4562. | |
Pernot M, Fujikura K, Fung-Kee-Fung SD, Konofagou EE. ECG-gated, mechanical and electromechanical wave imaging of cardiovascular tissues in vivo. Ultrasound Med Biol. 2007;33(7):1075–1085. | |
Montaldo G, Tanter M, Bercoff J, Benech N, Fink M. Coherent plane-wave compounding for very high frame rate ultrasonography and transient elastography. IEEE Trans Ultrason Ferroelectr Freq Control. 2009;56(3):489–506. | |
Hermeling E, Reesink KD, Kornmann LM, Reneman RS, Hoeks AP. The dicrotic notch as alternative time-reference point to measure local pulse wave velocity in the carotid artery by means of ultrasonography. J Hypertens. 2009;27(10):2028–2035. | |
Mirault T, Pernot M, Frank M, et al. Carotid stiffness change over the cardiac cycle by ultrafast ultrasound imaging in healthy volunteers and vascular Ehlers–Danlos syndrome. J Hypertens. 2015;33(9):1890–1896. | |
Apostolakis I, Nandlall S, Konofagou E. Piecewise Pulse Wave Imaging (pPWI) for detection and monitoring of focal vascular disease in murine aortas and carotids in vivo. IEEE Trans Med Imaging. Epub 2015 Jul 7. | |
Couade M, Pernot M, Prada C, et al. Quantitative assessment of arterial wall biomechanical properties using shear wave imaging. Ultrasound Med Biol. 2010;36(10):1662–1676. | |
Couade M. Imagerie des propriété viscoélastiques du coeur et des artères par échographie ultrarapide et palpation à distance [Imaging of the viscoelastic of the heart of the arteries by ultrafast ultrasound imaging and remote palpation]. [doctoral thesis]. Paris: Université Paris 7; 2011. French. | |
Demene C, Deffieux T, Pernot M, et al. Spatiotemporal clutter filtering of ultrafast ultrasound data highly increases Doppler and fUltrasound sensitivity. IEEE Trans Med Imaging. 2015;34(11):2271–2285. | |
Demené C, Pernot M, Biran V, et al. Ultrafast Doppler reveals the mapping of cerebral vascular resistivity in neonates. J Cereb Blood Flow Metab. 2014;34(6):1009–1017. | |
Osmanski BF, Lecarpentier E, Montaldo G, Tsatsaris V, Chavatte-Palmer P, Tanter M. Discriminative imaging of maternal and fetal blood flow within the placenta using ultrafast ultrasound. Sci Rep. 2015;5:13394. | |
Staub D, Patel MB, Tibrewala A, et al. Vasa vasorum and plaque neovascularization on contrast-enhanced carotid ultrasound imaging correlates with cardiovascular disease and past cardiovascular events. Stroke. 2010;41(1):41–47. | |
Nagaoka R, Masuno G, Kobayashi K, Yoshizawa S, Umemura S, Saijo Y. Measurement of regional pulse-wave velocity using spatial compound imaging of the common carotid artery in vivo. Ultrasonics. 2015;55:92–103. | |
Hasegawa H, Kanai H. Simultaneous imaging of artery-wall strain and blood flow by high frame rate acquisition of RF signals. IEEE Trans Ultrason Ferroelectr Freq Control. 2008;55(12):2626–2639. | |
Ekroll IK, Swillens A, Segers P, Dahl T, Torp H, Lovstakken L. Simultaneous quantification of flow and tissue velocities based on multi-angle plane wave imaging. IEEE Trans Ultrason Ferroelectr Freq Control. 2013;60(4):727–738. | |
Nenadic IZ, Bernal M, Brum J, et al. Recovering shear wave velocity in boundary sensitive media with two-dimensional motion tracking. Ultrasonics Symposium (IUS), 2014 IEEE International. 2014:1093–1096. | |
Gennisson JL, Provost J, Deffieux T, et al. 4-D ultrafast shear-wave imaging. IEEE Trans Ultrason Ferroelectr Freq Control. 2015;62(6):1059–1065. | |
Ramnarine KV, Garrard JW, Dexter K, Nduwayo S, Panerai RB, Robinson TG. Shear wave elastography assessment of carotid plaque stiffness: in vitro reproducibility study. Ultrasound Med Biol. 2014; 40(1):200–209. | |
Ramnarine KV, Garrard JW, Kanber B, Nduwayo S, Hartshorne TC, Robinson TG. Shear wave elastography imaging of carotid plaques: feasible, reproducible and of clinical potential. Cardiovasc Ultrasound. 2014;12:49. | |
Garrard JW, Ummur P, Nduwayo S, et al. Shear wave elastography may be superior to greyscale median for the identification of carotid plaque vulnerability: a comparison with histology. Ultraschall Med. 2015;36(4):386–390. | |
Widman E, Maksuti E, Larsson D, Urban MW, Bjällmark A, Larsson M. Shear wave elastography plaque characterization with mechanical testing validation: a phantom study. Phys Med Biol. 2015;60(8):3151–3174. | |
Maksuti E, Widman E, Larsson D, Urban MW, Larsson M, Bjällmark A. Arterial stiffness estimation by shear wave elastography: validation in phantoms with mechanical testing. Ultrasound Med Biol. Epub 2015 Oct 8. | |
Shcherbakova DA, Papadacci C, Swillens A, et al. Supersonic shear wave imaging to assess arterial nonlinear behavior and anisotropy: proof of principle via ex vivo testing of the horse aorta. Adv Mech Eng. 2014:1–12. | |
Gennisson JL, Catheline S, Chaffaï S, Fink M. Transient elastography in anisotropic medium: application to the measurement of slow and fast shear wave speeds in muscles. J Acoust Soc Am. 2003;114(1):536–541. | |
Nguyen TM. Elastographie haute résolution pour l’évaluation des propriétés élastiques de la cornée et de la peau [High-resolution elastography for the assessment of the elastic properties of the cornea and the skin].[doctoral thesis]. Paris: Université Paris 7; 2012. French. |
 © 2016 The Author(s). This work is published and licensed by Dove Medical Press Limited. The full terms of this license are available at https://www.dovepress.com/terms.php and incorporate the Creative Commons Attribution - Non Commercial (unported, v3.0) License.
By accessing the work you hereby accept the Terms. Non-commercial uses of the work are permitted without any further permission from Dove Medical Press Limited, provided the work is properly attributed. For permission for commercial use of this work, please see paragraphs 4.2 and 5 of our Terms.
© 2016 The Author(s). This work is published and licensed by Dove Medical Press Limited. The full terms of this license are available at https://www.dovepress.com/terms.php and incorporate the Creative Commons Attribution - Non Commercial (unported, v3.0) License.
By accessing the work you hereby accept the Terms. Non-commercial uses of the work are permitted without any further permission from Dove Medical Press Limited, provided the work is properly attributed. For permission for commercial use of this work, please see paragraphs 4.2 and 5 of our Terms.